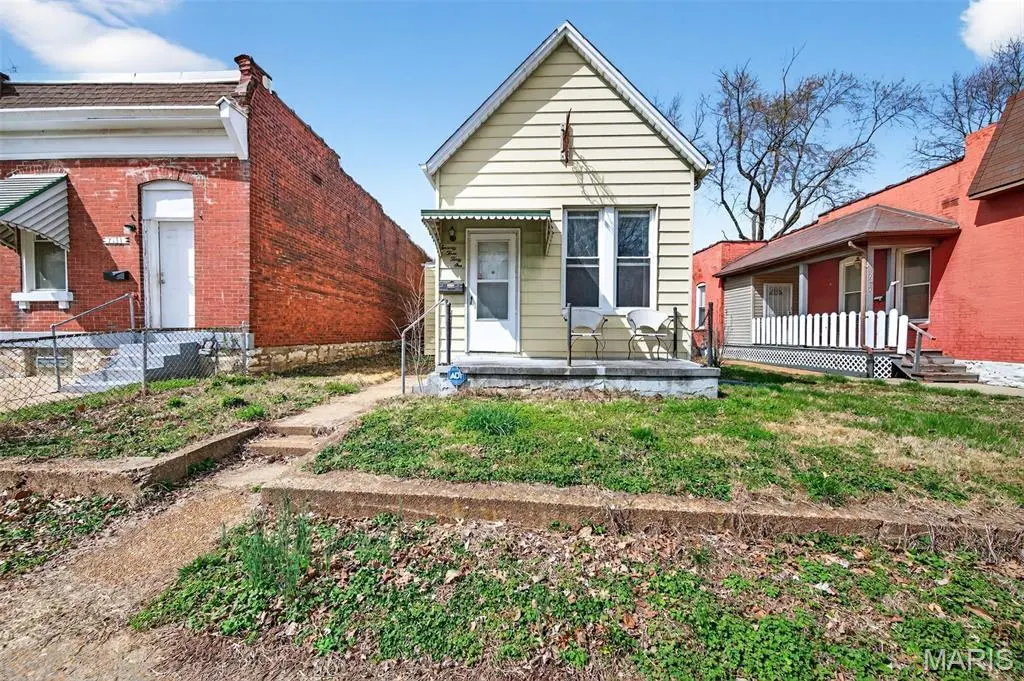
7331 Vermont Ave · St. Louis, MO
Flood risk 1/10 · Minimal
- FEMA flood zone
- X (unshaded)
- Chance of flooding over 30 yrs
- 0.0%
- Est. flood insurance / yr
- $473 – $860
Fire risk 1/10 · Minimal
- Est. fire insurance / yr
- $1,054 – $1,958
Heat risk 5/10 · Moderate
- Hot days now (above 109°F)
- 7 days/yr
- Hot days in 30 yrs
- 21 days/yr
Wind risk 2/10 · Minimal
- Chance of severe wind over 30 yrs
- 1.0%
Air-quality risk 3/10 · Minor
- Unhealthy air days now
- 3 days/yr
- Unhealthy air days in 30 yrs
- 4 days/yr
Risk factors via First Street. Map © Google.
Why this score? — see what drove the B grade
The composite is a weighted blend of 9 inputs, each scored 0–100. Each bar is that input's sub-score; the figure is the points it added to the 100-point composite (weight × sub-score).
- Cash flow +29.5/30.0
- ARV discount +15.0/15.0
- DSCR +10.0/10.0
- 1% rule +7.6/10.0
- Rent growth +3.3/5.0
- Livability +2.5/5.0
- Condition / age +2.5/5.0
- Schools +1.2/10.0
- Appreciation +0.0/10.0
$75,000
🖨 Deal sheet 📄 Offer letter ✓ Due diligence
Listing remarks MLS
BACK ON THE MARKET NO FAULT OF SELLER! ALL INSPECTONS COMPLETED! PASS CITY OCCUPANCY! READY TO BE YOURS!!! Opportunity in South St. Louis! Charming bungalow located near Carondelet Park with quick access to Highway 55 and just minutes from the River Des Peres Trail. This home features a spacious eat-in kitchen with newer appliances, updated flooring, and a newer furnace. Interior includes a blend of hardwood, tile, and carpet throughout. The large fenced yard offers great outdoor space and includes an oversized 24x26 two-car garage plus additional off-street parking. Basement includes washer/dryer hookups and provides plenty of storage. Great opportunity for owner-occupants or investors looking for a solid South City property. Convenient location, functional layout, and garage parking make this one stand out in the area. Properties in this price range move quickly — schedule your showing today.
Key facts
- Newer appliances
- Updated flooring
- Bungalow
Tags
Neighborhood map
What this means for you Summary
Snapshot
- This is a 1-bed/1.0-bath single-family listed at $75k.
Deal economics
- At list price, monthly cash flow is $268 ($3k/yr) — positive.
- The deal already cash-flows at list — no discount required.
- Meets the 1% rule at list price ($947 rent vs $75k).
- Recommended offer: $73k (3.0% below list) — sets the bar for market timing.
- Cap rate 10.6% vs local median 5.0% in St. Louis — top-decile yield for the area; either an underpriced asset or a hidden risk that comps aren't pricing in. Stress-test before assuming the spread holds.
Location & tenants
- Location reads: area grade B — affects rentability + tenant quality, not the cash-flow math above.
- St. Louis City (urban): math 10% / reading 18% proficiency, ranked #312 of 324 in MO (top 96%) — low school quality limits family demand, transient renter base, plan for 1-2y turnover; 80% free/reduced lunch — lower-income household profile, screen leases tightly.
- Market conditions: Rents rising (+3.3%/yr); 125 active listings in the ZIP; 40 comparable units currently listed for rent nearby; rentals at typical pace (median 24d on market — plan ~3-4 weeks tenant-placement turnaround); 45% of comp listings sitting > 30 days — soft ceiling on asking rent; 294 units permitted in St. Louis city in 2024 (227 in 5+ unit buildings).
Forward outlook
- Local home prices are declining (-3.0%/yr); year-one equity from $519 of loan paydown is wiped out by about $2k of value loss. Plan a longer hold.
- St. Louis County population projected to shrink 6% by 2050 — rents likely to lag national; underwrite the cash flow, not the appreciation.
- At projected returns (-3.0% appreciation + 3.3% rent growth), your $21k cash investment doubles in ~8 years — after that, you're playing with house money.
Negotiation context
- It's been on market 53 days — a 3% lower offer ($73k) is reasonable based on typical stale-listing flexibility.
- 2 sale attempts; this cycle's ask has dropped $5k (6%) from the opening price — seller is motivated, your offer sets the floor, not the list.
Risks & watch-outs
- Watch-outs: built in 1892 — expect roof / HVAC / electrical / plumbing capex.
- Climate carrying-cost: extreme-heat days projected 7→21/yr by 2055 (HVAC capex compounding) — expect insurance premiums to compound above CPI over the hold.
Questions for the listing agent
- It's been on market 53 days. Have you received any prior offers? Is the seller open to a 3% concession, seller financing, or rate buy-down credit?
- Built in 1892 — when were the roof, HVAC, electrical panel, plumbing, and water heater last replaced?
- Is there a deadline driving the sale (1031 exchange, divorce, estate, relocation)? That informs how much negotiation room exists.
- What's the average days-on-market for RENTAL listings here right now (not sales)? A rising rental-DOM trend means longer vacancies and softer asking-rent achievability than the comps imply.
- What's the recent tenant-quality profile in this submarket — average credit score on applications, eviction rate, late-payment / NSF rate, and stable-employment percentage? A property-management company in the area should have these aggregated.
- How much new for-sale + rental construction is in the pipeline within 1–3 miles? Heavy new supply typically softens prices + rents 12–24 months out; constrained supply supports both.
Investment metrics
- 1% rule
- 1.26% ✓
- Cap rate
- 10.58%
- Cash-on-cash
- 15.31%
- DSCR
- 1.68
- GRM
- 6.6
CMA / ARV
- ARV (median comp)
- $111,772
- List price
- $75,000
- Delta
- -32.90%
- Verdict
- UNDERPRICED
- Comps
- 20 within 1.0 mi
Show comp detail 12 sales within ~0.75 mi
| Address | Dist | Beds/Ba | Sqft | Sold | Price | $/sf | Match |
|---|---|---|---|---|---|---|---|
| 7132 Vermont Ave | 0.12mi | 2/2.0 (+1) | 912 (+4%) | 1mo | $149,900 | $164 | 77 |
| 125 Koeln Ave | 0.31mi | 2/1.0 (+1) | 833 (-5%) | 2mo | $110,000 | $132 | 71 |
| 6733 Alabama Ave | 0.34mi | 2/1.0 (+1) | 900 (+3%) | 7mo | $119,900 | $133 | 68 |
| 7300 Vermont Ave | 0.06mi | 2/1.5 (+1) | 992 (+14%) | 0mo | $199,900 | $202 | 68 |
| 3627 Blow St | 0.40mi | 2/1.0 (+1) | 912 (+4%) | 4mo | $183,000 | $201 | 66 |
| 6608 Idaho Ave | 0.49mi | 2/1.0 (+1) | 858 (-2%) | 8mo | $44,900 | $52 | 63 |
| 3651 Blow St | 0.45mi | 2/2.0 (+1) | 936 (+7%) | 2mo | $185,000 | $198 | 57 |
| 7320 Eugene Ave | 0.46mi | 1/1.0 | 762 (-13%) | 2mo | $135,000 | $177 | 55 |
| 3714 French Ave | 0.55mi | 2/1.0 (+1) | 930 (+6%) | 7mo | $195,000 | $210 | 52 |
| 7105 S Grand Blvd | 0.36mi | 2/1.0 (+1) | 976 (+12%) | 8mo | $219,000 | $224 | 52 |
| 3624 Steins St | 0.45mi | 2/1.0 (+1) | 780 (-11%) | 8mo | $150,000 | $192 | 50 |
| 3749 Roswell Ave | 0.60mi | 2/1.0 (+1) | 768 (-12%) | 8mo | $147,000 | $191 | 40 |
Match score weights: distance 35% · size 25% · config 20% · recency 20%. Top-matched comps best support the ARV.
Projected returns pro-forma
-3.0% appreciation · 3.27% rent growth · sell at horizon
- IRR
- 6.3%
- Equity multiple
- 1.25×
- Total profit
- $5,163
- Equity at exit
- $11,183
- IRR
- 15.9%
- Equity multiple
- 2.31×
- Total profit
- $27,498
- Equity at exit
- $6,485
Cash invested: $21,000 (down + closing). Projections, not guarantees.
Landlord ↔ Tenant lean methodology
- Overall (STATE)
- 81 Strongly Landlord-Friendly
- State Missouri
- 81 Strongly Landlord-Friendly · R+10
- County
- — inherits STATE
- City
- — inherits STATE
ZIP-level market 63111
- Rents YoY
- 3.3%
- Active inventory
- 125
- Price-to-rent
- 6.6×
Monthly cashflow live
- Estimated rent
- $947 high interval (Pro) →
- Mortgage (P&I)
- −$393
- Tax from tax record
- −$55 /mo · $665/yr
- Insurance
- −$31
- HOA
- −$0
- Vacancy / Maint / Mgmt
- −$199
- Net cashflow
- $268
Break-even live
UW: 25.0% down · 7.5% · 30yr · 1.5% tax · 5.0% vac · 8.0% maint · 8.0% mgmt
Financing live
Cash to close
- Down payment
- $18,750
- Closing costs
- $2,250
- Reserves months
- —
- Total cash needed
- —
Loan-product check · same deal, 3 products live
Conventional
25% down · 7.5% · 30yr
- Down + closing
- —
- Monthly P&I
- —
- Monthly cashflow
- —
- DSCR
- —
- Eligible?
- —
Personal DTI + credit; lowest rate.
DSCR
20% down · 8.5% · 30yr
- Down + closing
- —
- Monthly P&I
- —
- Monthly cashflow
- —
- DSCR
- —
- Eligible?
- —
No personal income docs; deal must DSCR.
Hard money
10% down · 12.0% · 12mo
- Down + closing
- —
- Monthly P&I
- —
- Monthly cashflow
- —
- DSCR
- —
- Eligible?
- —
Short-term bridge; refi at stabilization.
Rent comps 40 comps
| Address | Beds | Baths | Sqft | Rent | $/sqft | DOM | Units | Dist |
|---|---|---|---|---|---|---|---|---|
| 7320 Vermont Ave Unit 2nd St. Louis, MO | 1.0 | 1.0 | 710 | $750 | $1.06 | 43d | 1 | 0.06mi |
| 7417 Vermont Ave St. Louis, MO | 1.0–2.0 | 1.0–2.0 | 1144 | $997 | $0.87 | 1d | 8 | 0.09mi |
| 7417 Vermont Ave Unit 103 St. Louis, MO | 2.0 | 2.0 | 1069 | $1,500 | $1.40 | 14d | 1 | 0.09mi |
| 7614 Virginia Ave Unit 7614 St. Louis, MO | 2.0 | 1.0 | 750 | $750 | $1.00 | 23d | 1 | 0.25mi |
| 812 Schirmer St Saint Louis, MO | 1.0 | 1.0 | 900 | $795 | $0.88 | 43d | 1 | 0.32mi |
| 813 W Courtois St Apt C St. Louis, MO | 2.0 | 1.0 | 1000 | $895 | $0.90 | 43d | 1 | 0.33mi |
| 807 W Courtois St Apt D St. Louis, MO | 2.0 | 1.0 | 900 | $925 | $1.03 | 43d | 1 | 0.33mi |
| 815 W Courtois St St. Louis, MO | 1.0 | 1.0 | 900 | $795 | $0.88 | 14d | 1 | 0.33mi |
| 807 W Courtois St Apt B St. Louis, MO | 1.0 | 1.0 | 600 | $735 | $1.23 | 43d | 1 | 0.33mi |
| 125 Koeln Ave Saint Louis, MO | 2.0 | 1.0 | 833 | $1,499 | $1.80 | 43d | 1 | 0.34mi |
| 7024 Pennsylvania Ave Unit F St. Louis, MO | 2.0 | 1.0 | 1081 | $930 | $0.86 | 16d | 1 | 0.37mi |
| 7851 Bandero Dr Saint Louis, MO | 1.0–2.0 | 1.0 | 800 | $1,000 | $1.25 | 12d | 1 | 0.46mi |
| 6436 Idaho Ave Saint Louis, MO | 2.0 | 1.0 | 1050 | $995 | $0.95 | 43d | 1 | 0.51mi |
| 128 Haven St Unit 2F St. Louis, MO | 2.0 | 1.0 | 900 | $950 | $1.06 | 10d | 1 | 0.53mi |
| 8125 Michigan Ave St. Louis, MO | 1.0–2.0 | 1.0–2.0 | 797 | $820 | $1.03 | 14d | 1 | 0.57mi |
| 3601 Holly Hills Blvd Apt 19 St. Louis, MO | 2.0 | 1.0 | 700 | $875 | $1.25 | 3d | 1 | 0.68mi |
| 6327 S Grand Blvd Unit 1E St. Louis, MO | 1.0 | 1.0 | 650 | $799 | $1.23 | 43d | 1 | 0.71mi |
| 6118 Vermont Ave Saint Louis, MO | 1.0 | 1.0 | 759 | $1,150 | $1.52 | 43d | 1 | 0.80mi |
| 6118 Vermont Ave Saint Louis, MO | 1.0 | 1.0 | 759 | $1,250 | $1.65 | 14d | 1 | 0.80mi |
| 8511 Idaho Ave Unit 1st Floor St. Louis, MO | 1.0 | 1.0 | 750 | $850 | $1.13 | 12d | 1 | 0.80mi |
| 3637 Bowen St Apt 2E St. Louis, MO | 1.0 | 1.0 | 785 | $1,095 | $1.39 | 19d | 1 | 0.85mi |
| 711 Wilmington Ave Unit NA St. Louis, MO | 2.0 | 1.0 | 1051 | $1,300 | $1.24 | 43d | 1 | 0.89mi |
| 712 Dover Pl Saint Louis, MO | 2.0 | 1.0 | 1100 | $900 | $0.82 | 43d | 1 | 0.93mi |
| 712 Dover Pl Unit 1FL St. Louis, MO | 2.0 | 1.0 | 1100 | $1,000 | $0.91 | 43d | 1 | 0.93mi |
| 6024 Dewey Ave St. Louis, MO | 1.0 | 1.0 | 950 | $1,075 | $1.13 | 43d | 1 | 0.95mi |
| 3945 Crosby Dr Saint Louis, MO | 2.0 | 1.0 | 1100 | $2,083 | $1.89 | 1d | 1 | 0.95mi |
| 5507 Louisiana 2nd fl St. Louis, MO | 1.0 | 1.0 | 705 | $795 | $1.13 | 43d | 1 | 1.01mi |
| 5625 S Grand Blvd Unit 5625 St. Louis, MO | 1.0 | 1.0 | 650 | $840 | $1.29 | 23d | 1 | 1.08mi |
| 5625 S Grand Blvd Unit 2D St. Louis, MO | 1.0 | 1.0 | 650 | $840 | $1.29 | 10d | 1 | 1.08mi |
| 3815 Wilmington Ave Apt 2N St. Louis, MO | 2.0 | 1.0 | 800 | $1,095 | $1.37 | 43d | 1 | 1.08mi |
| 218-220 Bellerive Blvd Unit 218 St. Louis, MO | 1.0 | 1.0 | 550 | $725 | $1.32 | 12d | 1 | 1.08mi |
| 5618 S Grand Blvd Unit 10 St. Louis, MO | 1.0 | 1.0 | 600 | $799 | $1.33 | 43d | 1 | 1.10mi |
| 120 Bellerive Blvd Saint Louis, MO | 1.0 | 1.0 | 700 | $795 | $1.14 | 43d | 1 | 1.11mi |
| 120 Bellerive Blvd Saint Louis, MO | 1.0 | 1.0 | 795 | $745 | $0.94 | 16d | 1 | 1.11mi |
| 112 Bellerive Blvd Saint Louis, MO | 1.0 | 1.0 | 700 | $795 | $1.14 | 43d | 1 | 1.11mi |
| 5707 Dewey Ave Unit 1F St. Louis, MO | 2.0 | 1.0 | 1000 | $1,050 | $1.05 | 14d | 1 | 1.12mi |
| 510 Fassen St Unit 512 St. Louis, MO | 1.0 | 1.0 | 700 | $795 | $1.14 | 14d | 1 | 1.17mi |
| 510 Fassen St Unit 510 St. Louis, MO | 1.0 | 1.0 | 700 | $850 | $1.21 | 14d | 1 | 1.17mi |
| 4101 Germania Ave Apt 1A St. Louis, MO | 1.0 | 1.0 | 800 | $925 | $1.16 | 14d | 1 | 1.17mi |
| 207 Waller Ave Saint Louis, MO | 2.0 | 1.0 | 900 | $1,075 | $1.19 | 23d | 1 | 1.18mi |
Listing history 5 events
-
2026-04-26price $75,000 918-char remark
Show marketing remark (918 chars)
BACK ON THE MARKET NO FAULT OF SELLER! ALL INSPECTONS COMPLETED! PASS CITY OCCUPANCY! READY TO BE YOURS!!! Opportunity in South St. Louis! Charming bungalow located near Carondelet Park with quick access to Highway 55 and just minutes from the River Des Peres Trail. This home features a spacious eat-in kitchen with newer appliances, updated flooring, and a newer furnace. Interior includes a blend of hardwood, tile, and carpet throughout. The large fenced yard offers great outdoor space and includes an oversized 24x26 two-car garage plus additional off-street parking. Basement includes washer/dryer hookups and provides plenty of storage. Great opportunity for owner-occupants or investors looking for a solid South City property. Convenient location, functional layout, and garage parking make this one stand out in the area. Properties in this price range move quickly — schedule your showing today.
-
2026-04-06status Active 918-char remark
Show marketing remark (918 chars)
BACK ON THE MARKET NO FAULT OF SELLER! ALL INSPECTONS COMPLETED! PASS CITY OCCUPANCY! READY TO BE YOURS!!! Opportunity in South St. Louis! Charming bungalow located near Carondelet Park with quick access to Highway 55 and just minutes from the River Des Peres Trail. This home features a spacious eat-in kitchen with newer appliances, updated flooring, and a newer furnace. Interior includes a blend of hardwood, tile, and carpet throughout. The large fenced yard offers great outdoor space and includes an oversized 24x26 two-car garage plus additional off-street parking. Basement includes washer/dryer hookups and provides plenty of storage. Great opportunity for owner-occupants or investors looking for a solid South City property. Convenient location, functional layout, and garage parking make this one stand out in the area. Properties in this price range move quickly — schedule your showing today.
-
2026-03-18status Pending 918-char remark
Show marketing remark (918 chars)
BACK ON THE MARKET NO FAULT OF SELLER! ALL INSPECTONS COMPLETED! PASS CITY OCCUPANCY! READY TO BE YOURS!!! Opportunity in South St. Louis! Charming bungalow located near Carondelet Park with quick access to Highway 55 and just minutes from the River Des Peres Trail. This home features a spacious eat-in kitchen with newer appliances, updated flooring, and a newer furnace. Interior includes a blend of hardwood, tile, and carpet throughout. The large fenced yard offers great outdoor space and includes an oversized 24x26 two-car garage plus additional off-street parking. Basement includes washer/dryer hookups and provides plenty of storage. Great opportunity for owner-occupants or investors looking for a solid South City property. Convenient location, functional layout, and garage parking make this one stand out in the area. Properties in this price range move quickly — schedule your showing today.
-
2026-03-15$80,000 Active 918-char remark
Show marketing remark (918 chars)
BACK ON THE MARKET NO FAULT OF SELLER! ALL INSPECTONS COMPLETED! PASS CITY OCCUPANCY! READY TO BE YOURS!!! Opportunity in South St. Louis! Charming bungalow located near Carondelet Park with quick access to Highway 55 and just minutes from the River Des Peres Trail. This home features a spacious eat-in kitchen with newer appliances, updated flooring, and a newer furnace. Interior includes a blend of hardwood, tile, and carpet throughout. The large fenced yard offers great outdoor space and includes an oversized 24x26 two-car garage plus additional off-street parking. Basement includes washer/dryer hookups and provides plenty of storage. Great opportunity for owner-occupants or investors looking for a solid South City property. Convenient location, functional layout, and garage parking make this one stand out in the area. Properties in this price range move quickly — schedule your showing today.
-
2007-03-27soldstatus $71,000
ⓘ Source: listings_history table (triggers on properties + properties_extension) + one-shot
backfill from property_details.listing_events for pre-trigger history.
Tax reassessment forecast MO · Resets to sale price
- Current annual tax
- $665 · $55/mo
- Projected year-2 tax
- $728 · $61/mo
- Expected delta
- +$63/yr (+$5/mo · 9.4%)
ⓘ Screening estimate from a state-policy table — verify with the county assessor before closing.
Climate risk First Street
- Flood 1/10 Low FEMA zone X (unshaded) · 0% chance over 30 yrs
- Wildfire 1/10 Low
- Heat 5/10 Major 7 d/yr ≥109°F today · 21 d/yr by 30 yrs out
- Wind 2/10 Low 100% chance of damaging wind over 30 yrs
- Air quality 3/10 Moderate 3 unhealthy d/yr today · 4 by 30 yrs out
Nearby sold comps map
Loading sold comps map…
Walkable amenities ~0.75 mi
Loading nearby amenities…
Taxation est. · year 1
- Rental income
- $11,361
- − Mortgage interest
- −$4,201
- − Property taxes
- −$665
- − Insurance
- −$375
- − Repairs & maintenance
- −$909
- − Management
- −$909
- − Depreciation
- −$2,182
- Taxable income
- $2,120
- Est. tax owed @ 24.0%
- −$509
- After-tax cash flow
- $2,707/yr
For passive investors: Depreciation is non-cash, so a rental often shows a tax loss while cash-flowing — sheltering income. Rental losses are passive: they offset passive income freely, and up to $25,000/yr can offset ordinary (W-2) income if you actively participate and your MAGI is under $100k (phasing out to $0 by $150k); unused losses carry forward. On sale, claimed depreciation is recaptured at up to 25%, and gains may owe capital-gains tax (a 1031 exchange can defer both). Figures are a year-1 estimate at your 24.0% rate — not tax advice; consult a CPA.
Schools (NCES district)
- District
- St. Louis City
- NCES district ID
- 2929280
- Math proficiency
- 10% ▼ -6.00%
- Reading proficiency
- 18% ▼ -3.00%
- Median HH income
- $35,685
- Composite
- 11.54/100
- National rank
- #9699
- State rank
- #312 of 324 in MO
Livability — St. Louis
No livability data for this city. (Only ~50 U.S. cities are tracked.)
Census & demographics
- Census place
- St. Louis, MO
- County
- Saint Louis City · 254,015 people
- City population
- 283,259
- Metro
- St. Louis, MO-IL
- Population (ZIP)
- 18,851
- Household income
- $47,039
- Rent vs Own
- Severe rent burden
- 1364.0
Population outlook (St. Louis County) Hauer SSP2
- Today (2025)
- 315,737 people
- By 2030
- 313,865 · -0.6%
- By 2040
- 305,439 · -3.3%
- By 2050
- 296,529 · -6.1%
- By 2075
- 271,028 · -14.2%
- By 2100
- 255,359 · -19.1%
Race, ethnicity, and origin ACS 2023
- Neighborhood character
- Diverse neighborhood (Simpson 0.65)
- Race & ethnicity
- Black 42% White 41% Two or more races 11% Hispanic / Latino 9% Asian 1%
- Hispanic origin (detail)
- Mexican 6%
- Common ancestry
- Lithuanian 3% Slovak 1% Romanian 1%
- Foreign-born
- 7% · Canada, India
- Languages at home
- 90% English-only · Spanish 7% Other Indo-European 1%
Political lean MEDSL · St. Louis
- 2024 margin
- Solid D (+64.7) · D 81.4% · R 16.7% · Other 2.0%
- 2008→2024 swing
- -3.5pp toward R · 2008: 68.2pp · 2024: 64.7pp
- All cycles
- 2024: D+64.7 2020: D+66.2 2016: D+63.7 2012: D+66.6 2008: D+68.2
Not yet ingested
- Civics
- —
Market trends
- HPI YoY
- ▼ -92.80%
- Current HPI
- 169.4644
- Rent YoY
- ▲ 3.27%
- Metro
- St. Louis, MO-IL
- State GDP YoY
- ▲ 1.84%
- F500 in state
- 20
Industry mix (Fortune 500 HQ in MO)
| Industry | F500 HQs | Revenue |
|---|---|---|
| Healthcare | 1 | $163B |
|
||
| Insurance | 1 | $21B |
|
||
| Industrial Technology | 1 | $17B |
|
||
| Retail | 1 | $16B |
|
||
| Industrial Distribution | 1 | $10B |
|
||
| Utilities | 1 | $9B |
|
||
Price history
+5.6% since first listed5 events — show timeline
- 2026-04-26 Price Changed $75,000 MARIS as Distributed by MLS Grid
- 2026-04-06 Relisted — MARIS as Distributed by MLS Grid
- 2026-03-18 Pending — MARIS as Distributed by MLS Grid
- 2026-03-15 Listed $80,000 MARIS as Distributed by MLS Grid
- 2007-03-27 Sold (Public Records) $71,000 Public Records
Property tax history
+2.8%/yrLatest (2023): $665 · +5.4% YoY. Source: county tax records.
Cash-flow waterfall
monthlySold comps — $/sqft
last 12 mo · ≤1 miLoading sold comps…