 Duplex
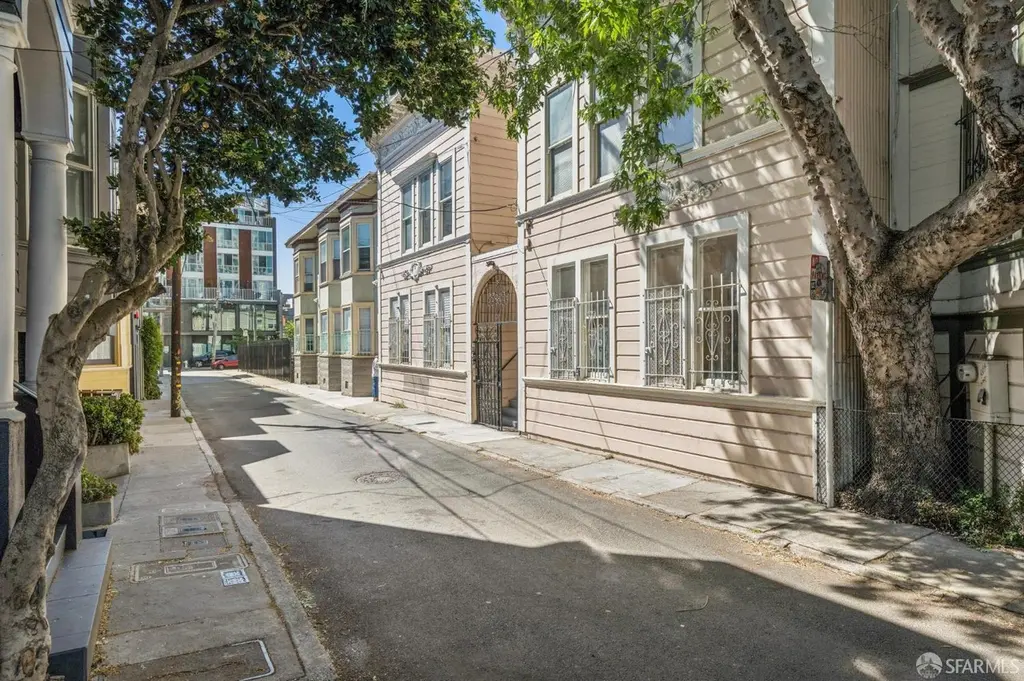
42-44 Sumner St · San Francisco, CA
Flood risk 1/10 · Minimal
- FEMA flood zone
- X (unshaded)
- Chance of flooding over 30 yrs
- 0.0%
- Est. flood insurance / yr
- $507 – $1,088
Fire risk 1/10 · Minimal
- Est. fire insurance / yr
- $659 – $1,223
Heat risk 3/10 · Minor
- Hot days now (above 79°F)
- 8 days/yr
- Hot days in 30 yrs
- 17 days/yr
Wind risk 1/10 · Minimal
- Chance of severe wind over 30 yrs
- —
Air-quality risk 8/10 · Major
- Unhealthy air days now
- 15 days/yr
- Unhealthy air days in 30 yrs
- 15 days/yr
Risk factors via First Street. Map © Google.
Why this score? — see what drove the C grade
The composite is a weighted blend of 9 inputs, each scored 0–100. Each bar is that input's sub-score; the figure is the points it added to the 100-point composite (weight × sub-score).
- Cash flow +17.6/30.0
- ARV discount +7.5/15.0
- Appreciation +7.5/10.0
- DSCR +5.5/10.0
- 1% rule +5.3/10.0
- Rent growth +5.0/5.0
- Schools +5.0/10.0
- Livability +3.8/5.0
- Condition / age +2.5/5.0
$998,000
🖨 Deal sheet 📄 Offer letter ✓ Due diligence
Multi-family units
County records classify this as Multi-Family (2-4 Unit). Listing-text estimate: 2 units. confirmed
Listing remarks
A rare investment opportunity or the perfect owner-occupant property in the heart of SoMa. Live in one unit and collect rental income from the other while enjoying the character and charm of a bygone San Francisco era. Built during SoMa's Edwardian period, long before much of the surrounding neighborhood took shape, this well-maintained two-unit building sits on an exceptionally quiet side street while remaining close to everything the city has to offer. Rich with original character and period details, the property seamlessly blends historic charm with modern upgrades. The lower unit features a beautifully remodeled two-bedroom, two-bath floor plan, along with a large bonus room that could
Key facts
- Large bonus room
- Original character
- Two unit building
Tags
Property features AI
Finance
- Other: Green appliances (energy efficient)
- Financial info: Two-unit property: 2 total units, 1 vacant, 1 leased (one unit month-to-month); Unit 2 is tenant-occupied
- HOA & community: No association fee
Exterior
- Parking:
- Security: Carbon monoxide detector(s); Smoke detector(s); Security gate; Window bars with quick release
- Utilities: Electricity available (separate meter); Natural gas connected (separate meter); Public water; Public sewer (sewer in street); Internet available
- Home design: Residential income duplex; Edwardian style; Two levels / 2 stories; One building
- Construction: Built in 1906; Concrete foundation; Shingle and wood siding
- Exterior features: Uncovered deck; Uncovered patio; Garden; Irregular lot; Fenced; Dual-pane partial windows
Interior
- Kitchen: Dishwasher; Disposal; Dual fuel range
- Bedrooms: 4 bedrooms total; Unit 1: 2 legal bedrooms (can function as 3)
- Flooring: Tile; Wood
- Bathrooms: 3 full bathrooms
- Heating & cooling: Wall furnace (heating present)
- Interior features: Low-flow plumbing fixtures and toilets; Storage space; Updated/remodeled condition
- Laundry & utility: In-unit laundry with washer/dryer; Laundry closet
Neighborhood map
What this means for you Summary
Snapshot
- This is a 2 × 2-bed/1.5-bath units multifamily listed at $998k.
Deal economics
- At list price, monthly cash flow is $781 ($9k/yr) — positive. Per door: $390/mo.
- The deal already cash-flows at list — no discount required.
- Meets the 1% rule at list price ($10k rent vs $998k).
- Cap rate 7.2% vs local median 2.1% in San Francisco — top-decile yield for the area; either an underpriced asset or a hidden risk that comps aren't pricing in. Stress-test before assuming the spread holds.
Location & tenants
- Location reads 76/100 on livability (#90 in CA, #3,143 nationally) — a middle-class / working-renter tenant base. Strengths: amenities A+, commute A+, employment A+; Watch: crime F, cost of living F.
- San Francisco Unified (urban): math 50% / reading 56% proficiency, ranked #322 of 1,400 in CA (top 23%) — acceptable for families but not a draw, mixed tenant base, ~2y average lease.
- Market conditions: Rents rising fast (+15.5%/yr); 108 active listings in the ZIP; 21 comparable units currently listed for rent nearby; rentals at typical pace (median 15d on market — plan ~3-4 weeks tenant-placement turnaround); high-income renter base; 750 units permitted in San Francisco County in 2024 (688 in 5+ unit buildings).
- At $10,287/mo this rent would consume 106% of the median local household income ($116k/yr) (locally 2666% of renters already pay >50% of income on rent) — very limited rent-growth headroom before tenants either downsize or default.
Forward outlook
- In year one you build about $56k of equity ($7k loan paydown + $50k appreciation (5.0% local appreciation)).
- San Francisco County population projected at +39% by 2050 — long-run rental-demand tailwind backs the buy-and-hold thesis.
- At projected returns (5.0% appreciation + 8.0% rent growth), your $279k cash investment doubles in ~4 years — after that, you're playing with house money.
- By year 2, paydown + projected appreciation supports a ~$90k cash-out refi (75% LTV) — recoverable capital for the next deal without selling this one.
Negotiation context
- Only 14 days on market — expect competitive offers; lowballing is unlikely to land.
- 8 sale attempts since 26y ago with the ask held roughly flat each time — persistent listings suggest the price (not the market) is what's stuck; bring a comps-based counter.
Risks & watch-outs
- Watch-outs: built in 1906 — expect roof / HVAC / electrical / plumbing capex.
Questions for the listing agent
- Can we see the unit-by-unit rent roll, current vacancy, and any below-market leases? What's the average tenancy length?
- What capital expenditures (roof, boiler, parking lot, exteriors) have been made in the last 5 years, and what's planned in the next 2?
- Built in 1906 — when were the roof, HVAC, electrical panel, plumbing, and water heater last replaced?
- Is there a deadline driving the sale (1031 exchange, divorce, estate, relocation)? That informs how much negotiation room exists.
- Schools are B-rated — typically a magnet for longer-tenancy family renters. What's the average tenant stay here, and is there a school-zone premium baked into asking?
- Crime grade is F in this area — have there been break-ins, vandalism, or insurance claims at this property in the last 3 years? What carrier currently insures it and at what premium?
- What's the average days-on-market for RENTAL listings here right now (not sales)? A rising rental-DOM trend means longer vacancies and softer asking-rent achievability than the comps imply.
- What's the recent tenant-quality profile in this submarket — average credit score on applications, eviction rate, late-payment / NSF rate, and stable-employment percentage? A property-management company in the area should have these aggregated.
- How much new apartment / multifamily construction is in the pipeline within 1–3 miles? Heavy new supply (>2% of stock underway) typically softens rents 12–24 months out; light construction supports rent growth.
Investment metrics
- 1% rule
- 1.03% ✓
- Cap rate
- 7.23%
- Cash-on-cash
- 3.35%
- DSCR
- 1.15
- GRM
- 8.1
CMA / ARV
No comps found within radius.
Projected returns pro-forma
4.96% appreciation · 8.0% rent growth · sell at horizon
- IRR
- 18.3%
- Equity multiple
- 2.19×
- Total profit
- $332,422
- Equity at exit
- $563,281
- IRR
- 20.7%
- Equity multiple
- 4.92×
- Total profit
- $1,094,380
- Equity at exit
- $970,272
Cash invested: $279,440 (down + closing). Projections, not guarantees.
Landlord ↔ Tenant lean methodology
- Overall (CITY)
- 0 Strongly Tenant-Friendly
- State California
- 18 Strongly Tenant-Friendly · D+13
- County
- — inherits STATE
- City San Francisco
- 0 Strongly Tenant-Friendly · D+57
ZIP-level market 94103
- Home prices YoY
- 2.9%
- Rents YoY
- 15.5%
- Active inventory
- 108
- Price-to-rent
- 16.2×
Monthly cashflow live
- Estimated rent
- $10,287 high interval (Pro) →
- Mortgage (P&I)
- −$5,234
- Tax from tax record
- −$1,696 /mo · $20,356/yr
- Insurance
- −$416
- HOA
- −$0
- Vacancy / Maint / Mgmt
- −$2,160
- Net cashflow
- $781
Break-even live
2-unit breakdown (identical units grouped — click to expand)
| Units | Beds | Baths | Est. rent |
|---|---|---|---|
| 2× units | 2 | 1.5 | $10,288 |
| #1 | 2 | 1.5 | $5,144 |
| #2 | 2 | 1.5 | $5,144 |
| Total (2 units) | $10,287 | ||
UW: 25.0% down · 7.5% · 30yr · 1.5% tax · 5.0% vac · 8.0% maint · 8.0% mgmt
Financing live
Cash to close
- Down payment
- $249,500
- Closing costs
- $29,940
- Reserves months
- —
- Total cash needed
- —
Loan-product check · same deal, 3 products live
Conventional
25% down · 7.5% · 30yr
- Down + closing
- —
- Monthly P&I
- —
- Monthly cashflow
- —
- DSCR
- —
- Eligible?
- —
Personal DTI + credit; lowest rate.
DSCR
20% down · 8.5% · 30yr
- Down + closing
- —
- Monthly P&I
- —
- Monthly cashflow
- —
- DSCR
- —
- Eligible?
- —
No personal income docs; deal must DSCR.
Hard money
10% down · 12.0% · 12mo
- Down + closing
- —
- Monthly P&I
- —
- Monthly cashflow
- —
- DSCR
- —
- Eligible?
- —
Short-term bridge; refi at stabilization.
Rent comps 21 comps
| Address | Beds | Baths | Sqft | Rent | $/sqft | DOM | Units | Dist |
|---|---|---|---|---|---|---|---|---|
| 30 Washburn St Unit 3 San Francisco, CA | 2.0 | 2.0 | 1576 | $5,995 | $3.80 | 7d | 1 | 0.21mi |
| 30 Washburn St San Francisco, CA | 2.0 | 2.0 | 1576 | $5,995 | $3.80 | 24d | 1 | 0.21mi |
| 673 Brannan St San Francisco, CA | 1.0–5.0 | 1.0–2.0 | 1302 | $5,406 | $4.15 | 1d | 2 | 0.60mi |
| 471 S Van Ness Ave San Francisco, CA | 4.0 | 3.0 | 2140 | $11,000 | $5.14 | 14d | 1 | 0.79mi |
| 1 Bluxome St San Francisco, CA | 1.0–2.0 | 2.0 | 1750 | $7,700 | $4.40 | 43d | 2 | 0.84mi |
| 188 Minna St Unit 27AL San Francisco, CA | 3.0 | 3.0 | 2027 | $30,000 | $14.80 | 43d | 1 | 0.88mi |
| 235 Berry St #316 San Francisco, CA | 2.0 | 2.5 | 1610 | $7,595 | $4.72 | 43d | 1 | 0.92mi |
| 255 King St San Francisco, CA | 3.0 | 1.0–2.5 | 1228 | $8,160 | $6.64 | 2d | 1 | 0.96mi |
| 542 Valencia St Unit A San Francisco, CA | 2.0 | 1.0 | 1600 | $5,000 | $3.12 | 24d | 1 | 1.02mi |
| 333 Bush St San Francisco, CA | 2.0 | 2.0 | 1654 | $10,975 | $6.64 | 43d | 2 | 1.09mi |
| 333 Bush St San Francisco, CA | 2.0 | 2.0 | 1733 | $11,253 | $6.49 | 24d | 2 | 1.09mi |
| 333 Bush St #4006 San Francisco, CA | 2.0 | 2.0 | 1798 | $15,000 | $8.34 | 4d | 1 | 1.11mi |
| 39 Tehama St San Francisco, CA | 1.0–2.0 | 1.0–2.0 | 1291 | $20,493 | $15.87 | 1d | 14 | 1.12mi |
| 1310 Jones St San Francisco, CA | 2.0 | 2.0 | 1367 | $10,250 | $7.50 | 3d | 4 | 1.21mi |
| 425 1st St San Francisco, CA | 3.0 | 3.0 | 1928 | $13,995 | $7.26 | 20d | 1 | 1.24mi |
| 340 Fremont St San Francisco, CA | 3.0 | 1.0–3.0 | 1146 | $8,359 | $7.29 | 1d | 5 | 1.25mi |
| 1961 California St San Francisco, CA | 3.0 | 2.0 | 1838 | $6,079 | $3.31 | 43d | 1 | 1.27mi |
| 399 Fremont St San Francisco, CA | 2.0 | 1.0–2.5 | 1077 | $10,288 | $9.55 | 1d | 43 | 1.28mi |
| 1340 Taylor St San Francisco, CA | 4.0 | 3.0 | 2110 | $21,420 | $10.15 | 14d | 1 | 1.30mi |
| 569-571 Capp St San Francisco, CA | 3.0 | 1.0 | 1600 | $6,995 | $4.37 | 2d | 1 | 1.32mi |
| 1107 Broadway Unit 1309749P San Francisco, CA | 3.0 | 1.5 | 2142 | $17,588 | $8.21 | 23d | 1 | 1.44mi |
Listing history 10 events
-
2026-06-18days on market $998,000 Active 14 DOM
-
2026-06-17days on market $998,000 Active 13 DOM
-
2026-06-16days on market $998,000 Active 12 DOM
-
2026-06-15days on market $998,000 Active 11 DOM
-
2026-06-13days on market $998,000 Active 9 DOM
-
2026-06-13days on market $998,000 Active 8 DOM
-
2026-06-09days on market $998,000 Active 5 DOM
-
2026-06-08days on market $998,000 Active 4 DOM
-
2026-06-07remarks 699-char remark
-
2026-06-07$998,000 Active 3 DOM
ⓘ Source: listings_history table (triggers on properties + properties_extension) + one-shot
backfill from property_details.listing_events for pre-trigger history.
Tax reassessment forecast CA · Resets to sale price
- Current annual tax
- $20,356 · $1,696/mo
- Projected year-2 tax
- $20,356 · $1,696/mo
- Expected delta
- $0/yr ($0/mo · 0.0%)
ⓘ Screening estimate from a state-policy table — verify with the county assessor before closing.
Climate risk First Street
- Flood 1/10 Low FEMA zone X (unshaded) · 0% chance over 30 yrs
- Wildfire 1/10 Low
- Heat 3/10 Moderate 8 d/yr ≥79°F today · 17 d/yr by 30 yrs out
- Wind 1/10 Low
- Air quality 8/10 Severe 15 unhealthy d/yr today · 15 by 30 yrs out
Nearby sold comps map
Loading sold comps map…
Walkable amenities ~0.75 mi
Loading nearby amenities…
Taxation est. · year 1
- Rental income
- $123,444
- − Mortgage interest
- −$55,904
- − Property taxes
- −$20,356
- − Insurance
- −$4,990
- − Repairs & maintenance
- −$9,876
- − Management
- −$9,876
- − Depreciation
- −$29,033
- Taxable loss
- −$6,589
- Est. tax savings @ 24.0%
- +$1,581
- After-tax cash flow
- $10,953/yr
For passive investors: Depreciation is non-cash, so a rental often shows a tax loss while cash-flowing — sheltering income. Rental losses are passive: they offset passive income freely, and up to $25,000/yr can offset ordinary (W-2) income if you actively participate and your MAGI is under $100k (phasing out to $0 by $150k); unused losses carry forward. On sale, claimed depreciation is recaptured at up to 25%, and gains may owe capital-gains tax (a 1031 exchange can defer both). Figures are a year-1 estimate at your 24.0% rate — not tax advice; consult a CPA.
Schools (NCES district)
- District
- San Francisco Unified
- NCES district ID
- 0634410
- Math proficiency
- 50% ▬ 0.00%
- Reading proficiency
- 56% ▲ 1.00%
- Median HH income
- $81,249
- Composite
- 50.14/100
- National rank
- #4088
- State rank
- #322 of 1400 in CA
Livability — San Francisco
- Score
- 76/100
- State rank
- #90
- US rank
- #3143
Category grades
Schools grade is shown separately in the Schools card above.
Census & demographics
- Census place
- San Francisco, CA
- County
- San Francisco County · 827,552 people
- City population
- 827,552
- Metro
- San Francisco-Oakland-Berkeley, CA
- Population (ZIP)
- 34,964
- Household income
- $116,438
- Rent vs Own
- Severe rent burden
- 2666.0
Population outlook (San Francisco County) Hauer SSP2
- Today (2025)
- 1,030,936 people
- By 2030
- 1,110,409 · +7.7%
- By 2040
- 1,270,010 · +23.2%
- By 2050
- 1,435,001 · +39.2%
- By 2075
- 1,779,074 · +72.6%
- By 2100
- 1,966,767 · +90.8%
Race, ethnicity, and origin ACS 2023
- Neighborhood character
- Highly diverse neighborhood (Simpson 0.75)
- Race & ethnicity
- White 32% Asian 31% Hispanic / Latino 20% Two or more races 11% Black 10% Native American 2%
- Hispanic origin (detail)
- Mexican 11%
- Common ancestry
- Lithuanian 2% Slovak 2% Romanian 2%
- Foreign-born
- 36% · Canada, China, Vietnam
- Languages at home
- 56% English-only · Spanish 16% Chinese 9% Tagalog/Filipino 6%
Political lean MEDSL · San Francisco
- 2024 margin
- Solid D (+64.8) · D 80.3% · R 15.5% · Other 4.1%
- 2008→2024 swing
- -5.7pp toward R · 2008: 70.5pp · 2024: 64.8pp
- All cycles
- 2024: D+64.8 2020: D+72.5 2016: D+76.1 2012: D+70.2 2008: D+70.5
Not yet ingested
- Civics
- —
Market trends
- HPI YoY
- ▲ 4.96%
- Current HPI
- 175.4945
- Rent YoY
- ▲ 15.50%
- Metro
- San Francisco-Oakland-Berkeley, CA
- State GDP YoY
- ▲ 3.21%
- F500 in state
- 116
Industry mix (Fortune 500 HQ in CA)
| Industry | F500 HQs | Revenue |
|---|---|---|
| Technology | 27 | $1,492B |
|
||
| Financial Services | 3 | $174B |
|
||
| Retail | 3 | $44B |
|
||
| Insurance | 3 | $26B |
|
||
| Media / Entertainment | 2 | $115B |
|
||
| Pharmaceuticals / Biotech | 2 | $62B |
|
||
Price history
+209.9% since first listed19 events — show timeline
- 2026-06-04 Listed $998,000 San Francisco MLS
- 2019-04-24 Sold (Public Records) $1,405,000 Public Records
- 2019-04-24 Sold (MLS) $1,405,000 San Francisco MLS
- 2019-04-18 Pending — San Francisco MLS
- 2019-04-17 Delisted — San Francisco MLS
- 2019-03-25 Contingent — San Francisco MLS
- 2019-03-19 Contingent — San Francisco MLS
- 2019-03-08 Listed $849,000 San Francisco MLS
- 2019-03-08 Listed $1,475,000 San Francisco MLS
- 2014-09-05 Sold (Public Records) $862,500 Public Records
- 2014-09-05 Listed $862,500 San Francisco MLS
- 2014-09-05 Sold (MLS) $862,500 San Francisco MLS
- 2008-03-24 Listed $699,000 San Francisco MLS
- 2007-09-12 Sold (Public Records) $592,000 Public Records
- 2007-08-27 Delisted — San Francisco MLS
- 2007-07-12 Listed $975,000 San Francisco MLS
- 2001-05-25 Listed $718,000 San Francisco MLS
- 2000-05-19 Listed $399,000 San Francisco MLS
- 1989-04-28 Sold (Public Records) $322,000 Public Records
Property tax history
+6.3%/yrLatest (2025): $20,356 · +3.0% YoY. Source: county tax records.
Cash-flow waterfall
monthlySold comps — $/sqft
last 12 mo · ≤1 miLoading sold comps…