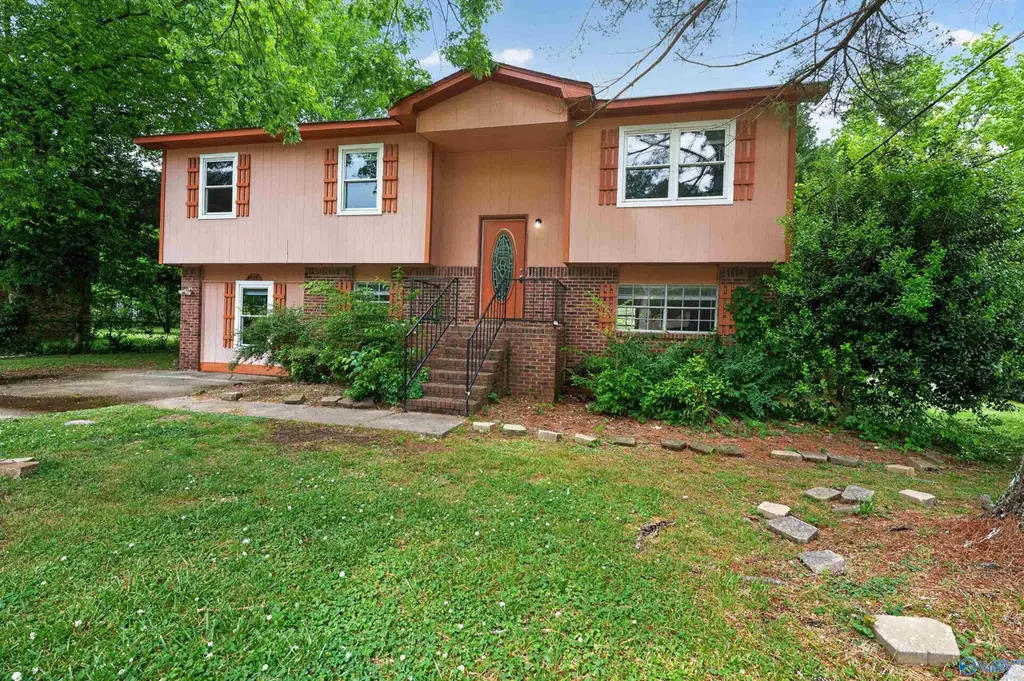
4056 Knollbrook Dr NW · Huntsville, AL
Flood risk 6/10 · Moderate
- FEMA flood zone
- X (unshaded)
- Chance of flooding over 30 yrs
- 0.71%
- Est. flood insurance / yr
- $507 – $1,088
Fire risk 3/10 · Minor
- Est. fire insurance / yr
- $916 – $1,700
Heat risk 6/10 · Moderate
- Hot days now (above 105°F)
- 7 days/yr
- Hot days in 30 yrs
- 20 days/yr
Wind risk 4/10 · Minor
- Chance of severe wind over 30 yrs
- 17.0%
Air-quality risk 2/10 · Minimal
- Unhealthy air days now
- 1 days/yr
- Unhealthy air days in 30 yrs
- 1 days/yr
Risk factors via First Street. Map © Google.
Why this score? — see what drove the C- grade
The composite is a weighted blend of 9 inputs, each scored 0–100. Each bar is that input's sub-score; the figure is the points it added to the 100-point composite (weight × sub-score).
- Cash flow +16.7/30.0
- ARV discount +13.6/15.0
- DSCR +5.2/10.0
- Livability +4.1/5.0
- 1% rule +4.0/10.0
- Schools +2.9/10.0
- Rent growth +2.5/5.0
- Condition / age +2.5/5.0
- Appreciation +0.0/10.0
$174,900
🖨 Deal sheet (PDF) 📄 Offer letter ✓ Due diligence
Listing remarks
Discover the potential of this spacious 2-story residence located in the heart of Huntsville. Offering 1,902 square feet of living space, this 4-bedroom, 2.5-bathroom home features a functional layout designed for comfortable living. The main level showcases a casual living room enhanced by hardwood flooring and a cozy fireplace, perfect for relaxing evenings. The eat-in kitchen provides ample workspace with laminate countertops and a convenient dining area. Retreat to the master suite, which includes a generous walk-in closet for all your storage needs. Three additional well-proportioned bedrooms ensure plenty of space for family, guests, or a dedicated home office.
Key facts
- Hardwood flooring
- Eat in kitchen
- 2 story residence
Tags
Property features AI
Finance
- Other: Property Type: Residential; Living area reported as 1,721 square feet
- HOA & community: No homeowners association; Subdivision: Rolling Hills
Exterior
- Parking: No parking/garage
- Utilities: Public water; Public sewer; Electric service
- Home design: Single-family residence; Built in 1979; Split-level / multi-level
- Construction: Slab foundation
- Exterior features: Public water; Public sewer; Lot approximately 0.24 acres (about 10,454 sq ft) with dimensions 75 x 124 x 96 x 126
Interior
- Kitchen: Range; Dishwasher; Refrigerator
- Bathrooms: 2 full bathrooms
- Heating & cooling: Central heating (electric); Central cooling
- Interior features: Wood-burning fireplace; Multi/split levels; 4 total rooms
Neighborhood map
What this means for you Summary
Snapshot
- This is a 4-bed/1.5-bath single-family listed at $175k.
Deal economics
- At list price, monthly cash flow is $109 ($1k/yr) — positive.
- The deal already cash-flows at list — no discount required.
- To meet the 1% rule (rent ≥ 1% of price), the offer needs to be $157k (10.1% below list).
- Recommended offer: $157k (10.1% below list) — sets the bar for 1% rule.
- Cap rate 7.0% vs local median 3.8% in Huntsville — top-decile yield for the area; either an underpriced asset or a hidden risk that comps aren't pricing in. Stress-test before assuming the spread holds.
Location & tenants
- Location reads 82/100 on livability (#3 in AL, #1,082 nationally) — a professional / high-income tenant draw. Strengths: commute A+, cost of living A+, housing A+; Watch: crime F.
- Huntsville City (urban): math 21% / reading 46% proficiency, ranked #48 of 129 in AL (top 37%) — families likely to look elsewhere, expect single-tenant / working-renter base with shorter leases.
- Zoned schools: Rolling Hills Elementary School (math 4% / reading 17%, grade F, #565 of 627 statewide, top 90%, 483 students, 86% FRL); Ronald Mcnair 78 (math 0% / reading 23%, grade F, #225 of 257 statewide, top 88%, 414 students, 87% FRL); Jemison High School (math 12% / reading 12%, grade F, #242 of 305 statewide, top 80%, 843 students, 64% FRL) — zoned schools average 79% FRL vs 46% district-wide (33 pts higher); higher-poverty schools than district average — tighter screening recommended.
- Zoned-school proficiency averages 11% at this address vs 34% district-wide (-22 pts) — the specific schools serving this property underperform the Huntsville City average; the district grade overstates school quality for this exact location.
- Market conditions: Rents soft (-0.1%/yr); 340 active listings in the ZIP; 28 comparable units currently listed for rent nearby; rentals lingering (median 46d on market — plan ~5-8 weeks vacancy on turnover, expect pricing pressure); 57% of comp listings sitting > 30 days — soft ceiling on asking rent; 4,709 units permitted in Madison County in 2024 (1,186 in 5+ unit buildings).
- This rent runs 37% of the median local income ($51k/yr) — at the standard rent-burdened threshold; future hikes will face affordability resistance.
Forward outlook
- Local home prices are declining (-3.0%/yr); year-one equity from $1k of loan paydown is wiped out by about $5k of value loss. Plan a longer hold.
- Madison County population projected at +18% by 2050 — long-run rental-demand tailwind backs the buy-and-hold thesis.
Negotiation context
- It's been on market 51 days — a 3% lower offer ($170k) is reasonable based on typical stale-listing flexibility.
- 2 sale attempts with the ask held roughly flat each time — persistent listings suggest the price (not the market) is what's stuck; bring a comps-based counter.
Risks & watch-outs
- Climate carrying-cost: major flood risk; extreme-heat days projected 7→20/yr by 2055 (HVAC capex compounding) — expect insurance premiums to compound above CPI over the hold.
Questions for the listing agent
- It's been on market 51 days. Have you received any prior offers? Is the seller open to a 10% concession, seller financing, or rate buy-down credit?
- Built in 1979 — when were the roof, HVAC, electrical panel, plumbing, and water heater last replaced?
- Is there a deadline driving the sale (1031 exchange, divorce, estate, relocation)? That informs how much negotiation room exists.
- Crime grade is F in this area — have there been break-ins, vandalism, or insurance claims at this property in the last 3 years? What carrier currently insures it and at what premium?
- What's the average days-on-market for RENTAL listings here right now (not sales)? A rising rental-DOM trend means longer vacancies and softer asking-rent achievability than the comps imply.
- What's the recent tenant-quality profile in this submarket — average credit score on applications, eviction rate, late-payment / NSF rate, and stable-employment percentage? A property-management company in the area should have these aggregated.
- How much new for-sale + rental construction is in the pipeline within 1–3 miles? Heavy new supply typically softens prices + rents 12–24 months out; constrained supply supports both.
Investment metrics
- 1% rule
- 0.90% ✗
- Cap rate
- 7.04%
- Cash-on-cash
- 2.67%
- DSCR
- 1.12
- GRM
- 9.3
CMA / ARV
- ARV (median comp)
- $202,140
- List price
- $174,900
- Delta
- -13.48%
- Verdict
- UNDERPRICED
- Comps
- 20 within 1.0 mi
Show comp detail 12 sales within ~0.75 mi
| Address | Dist | Beds/Ba | Sqft | Sold | Price | $/sf | Match |
|---|---|---|---|---|---|---|---|
| 3009 Winchester Rd | 0.27mi | 4/2.0 | 1,608 (-1%) | 1mo | $259,900 | $162 | 84 |
| 3003 Melrose Pl | 0.28mi | 3/2.0 (-1) | 1,600 (-1%) | 6mo | $70,000 | $44 | 74 |
| 2817 Coosa Cir | 0.55mi | 4/2.0 | 1,608 (-1%) | 1mo | $249,900 | $155 | 71 |
| 3707 Jaguar Way NW | 0.46mi | 3/2.0 (-1) | 1,620 (+0%) | 1mo | $289,900 | $179 | 70 |
| 2657 Ajs Arbor Dr | 0.45mi | 3/2.0 (-1) | 1,620 (+0%) | 3mo | $275,000 | $170 | 69 |
| 6207 Achievement Cir | 0.47mi | 3/2.0 (-1) | 1,620 (+0%) | 4mo | $275,000 | $170 | 68 |
| 4023 NW Knollbrook Dr | 0.23mi | 3/1.5 (-1) | 1,462 (-10%) | 6mo | $172,375 | $118 | 63 |
| 5009 Lumary Dr NW | 0.30mi | 3/2.0 (-1) | 1,480 (-8%) | 4mo | $227,500 | $154 | 62 |
| 6014 Pulaski Pike NW | 0.59mi | 3/1.5 (-1) | 1,700 (+5%) | 2mo | $180,000 | $106 | 58 |
| 4805 Drews Dogwood Ln | 0.43mi | 3/2.0 (-1) | 1,484 (-8%) | 3mo | $266,184 | $179 | 57 |
| 6215 Achievement Cir NW | 0.47mi | 3/2.0 (-1) | 1,484 (-8%) | 1mo | $269,900 | $182 | 57 |
| 3912 Neptune Dr | 0.57mi | 3/1.5 (-1) | 1,528 (-6%) | 4mo | $189,900 | $124 | 56 |
Match score weights: distance 35% · size 25% · config 20% · recency 20%. Top-matched comps best support the ARV.
Projected returns pro-forma
-3.0% appreciation · 0.0% rent growth · sell at horizon
- IRR
- -15.3%
- Equity multiple
- 0.47×
- Total profit
- $-26,028
- Equity at exit
- $26,078
- IRR
- -12.6%
- Equity multiple
- 0.35×
- Total profit
- $-31,622
- Equity at exit
- $15,122
Cash invested: $48,972 (down + closing). Projections, not guarantees.
Landlord ↔ Tenant lean methodology
- Overall (STATE)
- 90 Strongly Landlord-Friendly
- State Alabama
- 90 Strongly Landlord-Friendly · R+15
- County
- — inherits STATE
- City
- — inherits STATE
ZIP-level market 35810
- Home prices YoY
- -23.5%
- Rents YoY
- -0.1%
- Active inventory
- 340
- Price-to-rent
- 9.3×
Monthly cashflow live
- Estimated rent
- $1,572 high interval (Pro) →
- Mortgage (P&I)
- −$917
- Tax from tax record
- −$143 /mo · $1,714/yr
- Insurance
- −$73
- HOA
- −$0
- Vacancy / Maint / Mgmt
- −$330
- Net cashflow
- $109
Break-even live
Sensitivity live
| Price | -10% $208 | -5% $159 | +0% $109 | +5% $60 | +10% $10 |
|---|---|---|---|---|---|
| Rent | -10% $-15 | -5% $47 | +0% $109 | +5% $171 | +10% $233 |
| Rate | -1.0pp $197 | -0.5pp $154 | base $109 | +0.5pp $64 | +1.0pp $18 |
UW: 25.0% down · 7.5% · 30yr · 1.5% tax · 5.0% vac · 8.0% maint · 8.0% mgmt
Financing live
Cash to close
- Down payment
- $43,725
- Closing costs
- $5,247
- Reserves months
- —
- Total cash needed
- —
Loan-product check · same deal, 3 products live
Conventional
25% down · 7.5% · 30yr
- Down + closing
- —
- Monthly P&I
- —
- Monthly cashflow
- —
- DSCR
- —
- Eligible?
- —
Personal DTI + credit; lowest rate.
DSCR
20% down · 8.5% · 30yr
- Down + closing
- —
- Monthly P&I
- —
- Monthly cashflow
- —
- DSCR
- —
- Eligible?
- —
No personal income docs; deal must DSCR.
Hard money
10% down · 12.0% · 12mo
- Down + closing
- —
- Monthly P&I
- —
- Monthly cashflow
- —
- DSCR
- —
- Eligible?
- —
Short-term bridge; refi at stabilization.
Rent comps 28 comps
| Address | Beds | Baths | Sqft | Rent | $/sqft | DOM | Units | Dist |
|---|---|---|---|---|---|---|---|---|
| 3202 Deerfield Rd NW Huntsville, AL | 3.0 | 2.0 | 1234 | $1,425 | $1.15 | 45d | 1 | 0.27mi |
| 6000 Cherokee Hills Dr NW Huntsville, AL | 3.0 | 2.0 | 1086 | $1,600 | $1.47 | 25d | 1 | 0.29mi |
| 5025 Blue Spring Rd NW Huntsville, AL | 3.0 | 2.5 | 1273 | $1,195 | $0.94 | 15d | 2 | 0.33mi |
| 3103 Sonya Dr NW Huntsville, AL | 3.0 | 1.0 | 1101 | $1,399 | $1.27 | 25d | 1 | 0.47mi |
| 3314 Deerfield Rd NW Huntsville, AL | 3.0 | 2.0 | 1207 | $1,350 | $1.12 | 45d | 1 | 0.55mi |
| 3729 Millbrae Dr NW Huntsville, AL | 3.0 | 1.0 | 1050 | $1,458 | $1.39 | 15d | 1 | 0.56mi |
| 6309 Matic Rd NW Huntsville, AL | 4.0 | 2.0 | 1334 | $1,800 | $1.35 | 45d | 1 | 0.65mi |
| 3813 Millbrae Dr NW Huntsville, AL | 4.0 | 2.0 | 1500 | $1,895 | $1.26 | 45d | 1 | 0.67mi |
| 3814 Timwood Dr NW Huntsville, AL | 3.0 | 2.0 | 1157 | $1,195 | $1.03 | 45d | 1 | 0.68mi |
| 2506 Jeri St NW Huntsville, AL | 3.0 | 1.5 | 1274 | $1,400 | $1.10 | 25d | 1 | 0.69mi |
| 2415 Vining Ave NW Huntsville, AL | 3.0 | 1.0 | 1079 | $1,250 | $1.16 | 15d | 1 | 0.74mi |
| 5003 Stag Run Cir NW Huntsville, AL | 3.0 | 2.0 | 1410 | $1,450 | $1.03 | 15d | 1 | 0.79mi |
| 6207 Belgrade Dr NW Huntsville, AL | 3.0 | 1.5 | 1050 | $1,395 | $1.33 | 46d | 1 | 0.96mi |
| 3708 Valleydale Rd NW Huntsville, AL | 3.0 | 1.5 | 1136 | $1,350 | $1.19 | 45d | 1 | 0.98mi |
| 6214 Belgrade Dr NW Huntsville, AL | 3.0 | 1.5 | 1350 | $1,095 | $0.81 | 45d | 1 | 1.01mi |
| 3904 Battlefield Dr NW Huntsville, AL | 4.0 | 2.0 | 1890 | $1,600 | $0.85 | 45d | 1 | 1.01mi |
| 4114 Blue Spring Rd NW Huntsville, AL | 3.0 | 2.0 | 1100 | $1,500 | $1.36 | 25d | 1 | 1.07mi |
| 2200 Norwood Dr NW Huntsville, AL | 3.0 | 1.0 | 1060 | $1,150 | $1.08 | 25d | 1 | 1.12mi |
| 2602 Gibson St NW Huntsville, AL | 4.0 | 2.0 | 1795 | $1,625 | $0.91 | 45d | 1 | 1.13mi |
| 2212 Ricky Rd NW Huntsville, AL | 3.0 | 2.0 | 1539 | $1,400 | $0.91 | 25d | 1 | 1.14mi |
| 4408 Kenwood Dr NW Huntsville, AL | 3.0 | 1.5 | 1520 | $1,195 | $0.79 | 45d | 1 | 1.23mi |
| 2117 Atkins Dr NW Huntsville, AL | 3.0 | 2.0 | 1250 | $1,699 | $1.36 | 25d | 1 | 1.30mi |
| 2206 Harris Rd NW Huntsville, AL | 3.0 | 1.0 | 1354 | $1,400 | $1.03 | 45d | 1 | 1.32mi |
| 2113 Norris Rd NW Huntsville, AL | 3.0 | 1.0 | 1372 | $1,550 | $1.13 | 45d | 1 | 1.33mi |
| 3811 Lakeview Dr NW Huntsville, AL | 3.0 | 2.0 | 1707 | $1,350 | $0.79 | 45d | 1 | 1.34mi |
| 2519 Birchfield St NW Huntsville, AL | 3.0 | 1.5 | 1125 | $1,195 | $1.06 | 45d | 1 | 1.41mi |
| 2032 Ricky Rd NW Huntsville, AL | 4.0 | 2.0 | 1181 | $1,523 | $1.29 | 22d | 1 | 1.43mi |
| 2106 Sullivan Rd NW Huntsville, AL | 3.0 | 1.5 | 1690 | $1,195 | $0.71 | 46d | 1 | 1.44mi |
Listing history 19 events
-
2026-06-22days on market $174,900 Active 51 DOM
-
2026-06-18days on market $174,900 Active 48 DOM
-
2026-06-17days on market $174,900 Active 47 DOM
-
2026-06-16days on market $174,900 Active 46 DOM
-
2026-06-15days on market $174,900 Active 45 DOM
-
2026-06-14pricedays on market $174,900 Active 43 DOM
-
2026-06-10days on market $179,900 Active 40 DOM
-
2026-06-09days on market $179,900 Active 39 DOM
-
2026-06-08days on market $179,900 Active 38 DOM
-
2026-06-07statusdays on market $179,900 Active 37 DOM
-
2026-06-03days on market $179,900 Contingent 33 DOM
-
2026-06-02days on market $179,900 Contingent 32 DOM
-
2026-06-01days on market $179,900 Contingent 31 DOM
-
2026-05-31days on market $179,900 Contingent 30 DOM
-
2026-05-30days on market $179,900 Contingent 29 DOM
-
2026-05-01$179,900 Active 676-char remark
-
2024-03-14soldstatus $4,528,000
-
2018-10-11soldstatus $110,000
-
2018-07-02soldstatus $82,000
ⓘ Source: listings_history table (triggers on properties + properties_extension) + one-shot
backfill from property_details.listing_events for pre-trigger history.
Tax reassessment forecast AL · Resets to sale price
- Current annual tax
- $1,714 · $143/mo
- Projected year-2 tax
- $1,714 · $143/mo
- Expected delta
- $0/yr ($0/mo · 0.0%)
ⓘ Screening estimate from a state-policy table — verify with the county assessor before closing.
Climate risk First Street
- Flood 6/10 Major FEMA zone X (unshaded) · 71% chance over 30 yrs
- Wildfire 3/10 Moderate
- Heat 6/10 Major 7 d/yr ≥105°F today · 20 d/yr by 30 yrs out
- Wind 4/10 Moderate 17% chance of damaging wind over 30 yrs
- Air quality 2/10 Low 1 unhealthy d/yr today · 1 by 30 yrs out
Nearby sold comps map
Loading sold comps map…
Walkable amenities ~0.75 mi
Loading nearby amenities…
Taxation est. · year 1
- Rental income
- $18,865
- − Mortgage interest
- −$9,797
- − Property taxes
- −$1,714
- − Insurance
- −$874
- − Repairs & maintenance
- −$1,509
- − Management
- −$1,509
- − Depreciation
- −$5,088
- Taxable loss
- −$1,627
- Est. tax savings @ 24.0%
- +$391
- After-tax cash flow
- $1,699/yr
For passive investors: Depreciation is non-cash, so a rental often shows a tax loss while cash-flowing — sheltering income. Rental losses are passive: they offset passive income freely, and up to $25,000/yr can offset ordinary (W-2) income if you actively participate and your MAGI is under $100k (phasing out to $0 by $150k); unused losses carry forward. On sale, claimed depreciation is recaptured at up to 25%, and gains may owe capital-gains tax (a 1031 exchange can defer both). Figures are a year-1 estimate at your 24.0% rate — not tax advice; consult a CPA.
Schools (NCES district)
- District
- Huntsville City
- NCES district ID
- 0101800
- Math proficiency
- 21% ▼ -23.00%
- Reading proficiency
- 46% ▬ 0.00%
- Median HH income
- $48,264
- Composite
- 28.84/100
- National rank
- #6647
- State rank
- #48 of 129 in AL
Livability — Huntsville
- Score
- 82/100
- State rank
- #3
- US rank
- #1082
Category grades
Schools grade is shown separately in the Schools card above.
Census & demographics
- Census place
- Huntsville, AL
- County
- Madison County · 380,832 people
- City population
- 220,435
- Metro
- Huntsville, AL
- Population (ZIP)
- 32,843
- Household income
- $51,233
- Rent vs Own
- Severe rent burden
- 1223.0
Population outlook (Madison County) Hauer SSP2
- Today (2025)
- 392,086 people
- By 2030
- 409,788 · +4.5%
- By 2040
- 440,557 · +12.4%
- By 2050
- 460,990 · +17.6%
- By 2075
- 502,872 · +28.3%
- By 2100
- 513,623 · +31.0%
Race, ethnicity, and origin ACS 2023
- Neighborhood character
- Predominantly Black (69%)
- Race & ethnicity
- Black 69% White 18% Hispanic / Latino 9% Two or more races 5%
- Hispanic origin (detail)
- Mexican 3% Puerto Rican 2% Dominican 2%
- Common ancestry
- Italian 2% Lithuanian 0%
- Foreign-born
- 6% · Canada
- Languages at home
- 92% English-only · Spanish 7%
Political lean MEDSL · Madison
- 2024 margin
- Lean R (+9.0) · D 44.7% · R 53.7% · Other 1.6%
- 2008→2024 swing
- +6.0pp toward D · 2008: -14.9pp · 2024: -9.0pp
- All cycles
- 2024: R+9.0 2020: R+8.0 2016: R+16.8 2012: R+18.7 2008: R+14.9
Not yet ingested
- Civics
- —
Market trends
- HPI YoY
- ▼ -61.00%
- Current HPI
- 198.9629
- Rent YoY
- ▬ -0.05%
- Metro
- Huntsville, AL
- State GDP YoY
- ▲ 2.94%
- F500 in state
- 4
Industry mix (Fortune 500 HQ in AL)
| Industry | F500 HQs | Revenue |
|---|---|---|
| Financial Services | 1 | $8B |
|
||
| Healthcare | 1 | $5B |
|
||
Price history
+113.3% since first listed7 events — show timeline
- 2026-06-11 Price Changed $174,900 VMLS
- 2026-06-05 Relisted — VMLS
- 2026-05-19 Contingent — VMLS
- 2026-05-01 Listed $179,900 VMLS
- 2024-03-14 Sold (Public Records) $4,528,000 Public Records
- 2018-10-11 Sold (Public Records) $110,000 Public Records
- 2018-07-02 Sold (Public Records) $82,000 Public Records
Property tax history
+13.1%/yrLatest (2024): $1,714 · +2.4% YoY. Source: county tax records.
Cash-flow waterfall
monthlySold comps — $/sqft
last 12 mo · ≤1 miLoading sold comps…