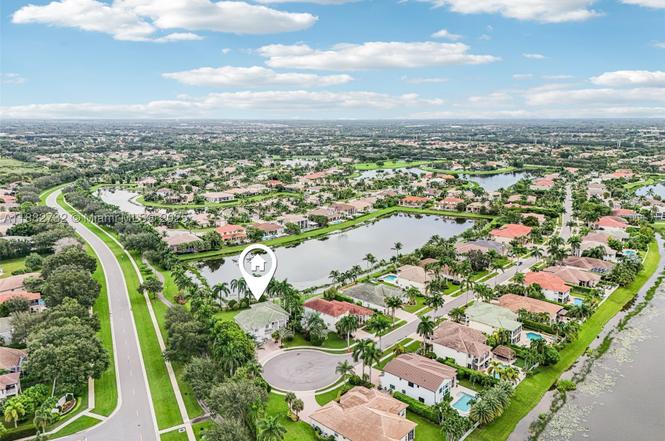
 🌊 Lakefront
11759 Paradise Cove Ln · Wellington, FL
Flood risk 1/10 · Minimal
- FEMA flood zone
- X (unshaded)
- Chance of flooding over 30 yrs
- 0.0%
- Est. flood insurance / yr
- $507 – $1,088
Fire risk 1/10 · Minimal
- Est. fire insurance / yr
- $947 – $1,759
Heat risk 9/10 · Severe
- Hot days now (above 107°F)
- 7 days/yr
- Hot days in 30 yrs
- 25 days/yr
Wind risk 10/10 · Severe
- Chance of severe wind over 30 yrs
- 99.0%
Air-quality risk 2/10 · Minimal
- Unhealthy air days now
- 0 days/yr
- Unhealthy air days in 30 yrs
- 2 days/yr
Risk factors via First Street. Map © Google.
Why this score? — see what drove the D+ grade
The composite is a weighted blend of 9 inputs, each scored 0–100. Each bar is that input's sub-score; the figure is the points it added to the 100-point composite (weight × sub-score).
- Cash flow +17.7/30.0
- DSCR +5.5/10.0
- Appreciation +4.7/10.0
- 1% rule +4.4/10.0
- Schools +4.3/10.0
- Livability +3.7/5.0
- Rent growth +2.5/5.0
- Condition / age +2.5/5.0
- ARV discount +0.0/15.0
$1,289,000
🖨 Deal sheet (PDF) 📄 Offer letter ✓ Due diligence
Listing remarks
Welcome to 11759 Paradise Cove Lane—a private lakefront home in the gated community of Isles at Wellington. Set on an oversized cul-de-sac lot with only one neighboring home, this residence offers exceptional privacy, lush tropical landscaping, and an incredible water view. Inside, you’ll find a bright, open layout with soaring ceilings, abundant natural light, and spacious living areas ideal for entertaining. Recent improvements include two newer A/C systems, fresh interior paint, updated lighting, newer upstairs carpeting, and a new refrigerator. A garage conversion adds a flexible 7th bedroom—perfect for a guest suite, home office, gym, or multigenerational living. Step
Key facts
- In-law suite
- Landscaped grounds
- Custom landscaping
Tags
Property features AI
Finance
- Other: Lakefront property with approximately 60' frontage; Lot is roughly a quarter to half acre; Community amenities include pickleball and tennis courts
- Financial info: Pets allowed with restrictions
- HOA & community: Homeowners association with monthly fee; Association fee includes common area maintenance and security; Community features: clubhouse, fitness center, game room, gated community, maintained community, park, pickleball, on-site property manager, pool, sidewalks, street lights, tennis courts
Exterior
- Parking: Attached garage with 3 spaces; Circular driveway; Driveway parking; Garage door opener; Guest parking
- Security: Gated community; Security guard; Smoke detectors
- Utilities: Public water; Public sewer; Cable available
- Home design: Two-story home; Resale (existing construction); South-facing
- Construction: Block construction; Spanish tile roof; Builder model: St. Thomas
- Exterior features: Balcony; Open patio and porch; Room for pool; Storm/security shutters; Community pool and spa
Interior
- Kitchen: Built-in oven; Electric range; Dishwasher; Microwave; Refrigerator; Disposal; Kitchen island; Pantry; Breakfast bar
- Bedrooms: Bedroom on main level; In-law suite; Upper-level primary
- Flooring: Carpet; Tile
- Bathrooms: Four full bathrooms; Dual sinks; Jetted tub; Separate shower
- Heating & cooling: Central air conditioning; Ceiling fans; Electric heating
- Interior features: Arched windows with blinds; Breakfast bar; Dining area and separate formal dining room; First-floor entry; High ceilings; Jetted tub; Kitchen island; Pantry; Separate shower; Upper-level primary suite; Walk-in closets
- Laundry & utility: Washer and dryer included; Laundry tub; Water softener (owned)
Neighborhood map
What this means for you Summary
Snapshot
- This is a 6-bed/3.5-bath single-family listed at $1.29M.
Deal economics
- At list price, monthly cash flow is $1k ($12k/yr) — positive.
- The deal already cash-flows at list — no discount required.
- To meet the 1% rule (rent ≥ 1% of price), the offer needs to be $1.21M (5.9% below list).
- Recommended offer: $1.13M (12.0% below list) — sets the bar for market timing.
- Cap rate 7.3% vs local median 3.4% in Wellington — top-decile yield for the area; either an underpriced asset or a hidden risk that comps aren't pricing in. Stress-test before assuming the spread holds.
Location & tenants
- Location reads 73/100 on livability (#294 in FL, #4,986 nationally) — a middle-class / working-renter tenant base. Strengths: schools A+, crime A+, employment A+; Watch: amenities F, commute F, cost of living F.
- Palm Beach (suburban): math 46% / reading 53% proficiency, ranked #34 of 73 in FL (top 47%) — families likely to look elsewhere, expect single-tenant / working-renter base with shorter leases.
- Market conditions: 168 active listings in the ZIP; 16 comparable units currently listed for rent nearby; rentals at typical pace (median 25d on market — plan ~3-4 weeks tenant-placement turnaround); 3,974 units permitted in Palm Beach County in 2024 (1,012 in 5+ unit buildings).
Forward outlook
- In year one you build about $213 of equity ($9k loan paydown + $-9k appreciation (-0.7% local appreciation)).
- Palm Beach County population projected at +30% by 2050 — long-run rental-demand tailwind backs the buy-and-hold thesis.
Negotiation context
- It's been on market 269 days — a 12% lower offer ($1.13M) is reasonable based on typical stale-listing flexibility.
Risks & watch-outs
- Climate carrying-cost: severe wind risk, 99% chance of damaging wind over 30y; extreme-heat days projected 7→25/yr by 2055 (HVAC capex compounding) — expect insurance premiums to compound above CPI over the hold.
Questions for the listing agent
- It's been on market 269 days. Have you received any prior offers? Is the seller open to a 12% concession, seller financing, or rate buy-down credit?
- What does the HOA fee cover, when was the last increase, and are there any pending special assessments or reserve-fund shortfalls?
- Why hasn't it sold? Are there any deal-killer items the seller is aware of (foundation, flood, title, zoning, code violations)?
- Is there a deadline driving the sale (1031 exchange, divorce, estate, relocation)? That informs how much negotiation room exists.
- Schools are A-rated — typically a magnet for longer-tenancy family renters. What's the average tenant stay here, and is there a school-zone premium baked into asking?
- The area grade is low — what's the realistic commute time and amenity access for the typical tenant pool here? Any planned neighborhood developments (good or bad) we should know about?
- This sits on a lake — are riparian / water-frontage rights deeded with the parcel? Any dock permits, shoreline easements, or HOA water-use restrictions?
- What's the documented flood / surge / shoreline-erosion history here (FEMA AND non-FEMA — e.g., storm surge, creek backup, septic-field saturation)?
- Any water-quality or seasonal algae-bloom issues that affect tenant satisfaction or short-term-rental demand?
- What's the average days-on-market for RENTAL listings here right now (not sales)? A rising rental-DOM trend means longer vacancies and softer asking-rent achievability than the comps imply.
- What's the recent tenant-quality profile in this submarket — average credit score on applications, eviction rate, late-payment / NSF rate, and stable-employment percentage? A property-management company in the area should have these aggregated.
- How much new for-sale + rental construction is in the pipeline within 1–3 miles? Heavy new supply typically softens prices + rents 12–24 months out; constrained supply supports both.
Investment metrics
- 1% rule
- 0.94% ✗
- Cap rate
- 7.25%
- Cash-on-cash
- 3.42%
- DSCR
- 1.15
- GRM
- 8.9
CMA / ARV
- ARV (on-the-fly)
- $956,533
- Comps found
- 1
Show comp detail 1 sale within ~0.75 mi
| Address | Dist | Beds/Ba | Sqft | Sold | Price | $/sf | Match |
|---|---|---|---|---|---|---|---|
| 11552 Paradise Cove Ln | 0.26mi | 5/4.0 (-1) | 3,668 (-12%) | 9mo | $840,000 | $229 | 53 |
Match score weights: distance 35% · size 25% · config 20% · recency 20%. Top-matched comps best support the ARV.
Projected returns pro-forma
-0.67% appreciation · 3.0% rent growth · sell at horizon
- IRR
- -0.8%
- Equity multiple
- 0.97×
- Total profit
- $-12,601
- Equity at exit
- $331,372
- IRR
- 5.5%
- Equity multiple
- 1.55×
- Total profit
- $198,094
- Equity at exit
- $365,510
Cash invested: $360,920 (down + closing). Projections, not guarantees.
Landlord ↔ Tenant lean methodology
- Overall (STATE)
- 87 Strongly Landlord-Friendly
- State Florida
- 87 Strongly Landlord-Friendly · R+3
- County
- — inherits STATE
- City
- — inherits STATE
ZIP-level market 33449
- Home prices YoY
- -0.2%
- Active inventory
- 168
- Price-to-rent
- 8.9×
Monthly cashflow live
- Estimated rent
- $12,126 high interval (Pro) →
- Mortgage (P&I)
- −$6,760
- Tax from tax record
- −$845 /mo · $10,141/yr
- Insurance
- −$537
- HOA
- −$410
- Vacancy / Maint / Mgmt
- −$2,547
- Net cashflow
- $1,028
Break-even live
Sensitivity live
| Price | -10% $1,758 | -5% $1,393 | +0% $1,028 | +5% $663 | +10% $298 |
|---|---|---|---|---|---|
| Rent | -10% $70 | -5% $549 | +0% $1,028 | +5% $1,507 | +10% $1,986 |
| Rate | -1.0pp $1,677 | -0.5pp $1,356 | base $1,028 | +0.5pp $694 | +1.0pp $354 |
UW: 25.0% down · 7.5% · 30yr · 1.5% tax · 5.0% vac · 8.0% maint · 8.0% mgmt
Financing live
Cash to close
- Down payment
- $322,250
- Closing costs
- $38,670
- Reserves months
- —
- Total cash needed
- —
Loan-product check · same deal, 3 products live
Conventional
25% down · 7.5% · 30yr
- Down + closing
- —
- Monthly P&I
- —
- Monthly cashflow
- —
- DSCR
- —
- Eligible?
- —
Personal DTI + credit; lowest rate.
DSCR
20% down · 8.5% · 30yr
- Down + closing
- —
- Monthly P&I
- —
- Monthly cashflow
- —
- DSCR
- —
- Eligible?
- —
No personal income docs; deal must DSCR.
Hard money
10% down · 12.0% · 12mo
- Down + closing
- —
- Monthly P&I
- —
- Monthly cashflow
- —
- DSCR
- —
- Eligible?
- —
Short-term bridge; refi at stabilization.
Rent comps 16 comps
| Address | Beds | Baths | Sqft | Rent | $/sqft | DOM | Units | Dist |
|---|---|---|---|---|---|---|---|---|
| 11695 Sunrise View Ln Wellington, FL | 5.0 | 4.5 | 4616 | $12,000 | $2.60 | 19d | 1 | 0.13mi |
| 11910 Osprey Point Cir Wellington, FL | 5.0 | 4.0 | 4450 | $17,000 | $3.82 | 12d | 1 | 0.16mi |
| 11910 Osprey Point Cir Wellington, FL | 5.0 | 4.0 | 4450 | $17,000 | $3.82 | 24d | 1 | 0.16mi |
| 11615 Paradise Cove Ln Wellington, FL | 5.0 | 4.0 | 4177 | $12,000 | $2.87 | 22d | 1 | 0.17mi |
| 11750 Osprey Point Cir Wellington, FL | 5.0 | 3.0 | 3324 | $6,800 | $2.05 | 24d | 1 | 0.20mi |
| 4693 Sugar Beach Way Wellington, FL | 5.0 | 3.0 | 3280 | $8,500 | $2.59 | 24d | 1 | 0.26mi |
| 11836 Osprey Point Cir Wellington, FL | 5.0 | 4.0 | 4293 | $15,999 | $3.73 | 5d | 1 | 0.26mi |
| 4673 Island Reef Dr Wellington, FL | 5.0 | 4.0 | 4177 | $8,500 | $2.03 | 24d | 1 | 0.36mi |
| 4600 Mariners Cove Dr Wellington, FL | 5.0 | 3.0 | 3375 | $6,500 | $1.93 | 24d | 1 | 0.51mi |
| 11246 Maritime Ct Wellington, FL | 5.0 | 3.0 | 3375 | $6,000 | $1.78 | 24d | 1 | 0.52mi |
| 11206 Maritime Ct Wellington, FL | 5.0 | 3.0 | 3375 | $5,250 | $1.56 | 24d | 1 | 0.57mi |
| 4209 Wellington Shores Dr Wellington, FL | 5.0 | 3.0 | 3245 | $5,500 | $1.69 | 24d | 1 | 0.66mi |
| 12442 Equine Ln Wellington, FL | 6.0 | 4.5 | 4146 | $20,000 | $4.82 | 24d | 1 | 0.90mi |
| 3738 Old Lighthouse Cir Wellington, FL | 5.0 | 3.5 | 2933 | $8,500 | $2.90 | 24d | 1 | 0.98mi |
| 12465 World Cup Ln Wellington, FL | 5.0 | 4.5 | 3740 | $10,000 | $2.67 | 24d | 1 | 0.99mi |
| 10780 Anderson Ln Lake Worth, FL | 7.0 | 4.5 | 4626 | $20,000 | $4.32 | 24d | 1 | 1.33mi |
HOA detail
- Monthly dues
- $410 · $4,920/yr
- Likely covers
- waterlandscapinggymsecurity
Listing history 16 events
-
2026-06-18days on market $1,289,000 Active 269 DOM
-
2026-06-17days on market $1,289,000 Active 268 DOM
-
2026-06-16days on market $1,289,000 Active 267 DOM
-
2026-06-15days on market $1,289,000 Active 266 DOM
-
2026-06-13days on market $1,289,000 Active 264 DOM
-
2026-06-09days on market $1,289,000 Active 260 DOM
-
2026-06-07days on market $1,289,000 Active 258 DOM
-
2026-06-04days on market $1,289,000 Active 255 DOM
-
2026-06-03days on market $1,289,000 Active 254 DOM
-
2026-06-01days on market $1,289,000 Active 252 DOM
-
2026-05-31days on market $1,289,000 Active 251 DOM
-
2026-03-06price $1,289,000
-
2025-11-13price $1,320,000
-
2025-10-13price $1,340,000
-
2025-09-22$1,360,000 Active
-
2002-05-28soldstatus $2,071,000
ⓘ Source: listings_history table (triggers on properties + properties_extension) + one-shot
backfill from property_details.listing_events for pre-trigger history.
Tax reassessment forecast FL · Resets to sale price
- Current annual tax
- $10,141 · $845/mo
- Projected year-2 tax
- $10,699 · $892/mo
- Expected delta
- +$558/yr (+$47/mo · 5.5%)
ⓘ Screening estimate from a state-policy table — verify with the county assessor before closing.
Climate risk First Street
- Flood 1/10 Low FEMA zone X (unshaded) · 0% chance over 30 yrs
- Wildfire 1/10 Low
- Heat 9/10 Extreme 7 d/yr ≥107°F today · 25 d/yr by 30 yrs out
- Wind 10/10 Extreme 99% chance of damaging wind over 30 yrs
- Air quality 2/10 Low 0 unhealthy d/yr today · 2 by 30 yrs out
Nearby sold comps map
Loading sold comps map…
Walkable amenities ~0.75 mi
Loading nearby amenities…
Taxation est. · year 1
- Rental income
- $145,518
- − Mortgage interest
- −$72,204
- − Property taxes
- −$10,141
- − Insurance
- −$6,445
- − Repairs & maintenance
- −$11,641
- − Management
- −$11,641
- − HOA
- −$4,920
- − Depreciation
- −$37,498
- Taxable loss
- −$8,973
- Est. tax savings @ 24.0%
- +$2,154
- After-tax cash flow
- $14,491/yr
For passive investors: Depreciation is non-cash, so a rental often shows a tax loss while cash-flowing — sheltering income. Rental losses are passive: they offset passive income freely, and up to $25,000/yr can offset ordinary (W-2) income if you actively participate and your MAGI is under $100k (phasing out to $0 by $150k); unused losses carry forward. On sale, claimed depreciation is recaptured at up to 25%, and gains may owe capital-gains tax (a 1031 exchange can defer both). Figures are a year-1 estimate at your 24.0% rate — not tax advice; consult a CPA.
Schools (NCES district)
- District
- Palm Beach
- NCES district ID
- 1201500
- Math proficiency
- 46% ▼ -16.00%
- Reading proficiency
- 53% ▼ -4.00%
- Median HH income
- $53,943
- Composite
- 42.72/100
- National rank
- #3160
- State rank
- #34 of 73 in FL
Livability — Wellington
- Score
- 73/100
- State rank
- #294
- US rank
- #4986
Category grades
Schools grade is shown separately in the Schools card above.
Census & demographics
- Census place
- Wellington, FL
- City population
- 60,184
- Population (ZIP)
- 9,131
Population outlook (Palm Beach County) Hauer SSP2
- Today (2025)
- 1,637,487 people
- By 2030
- 1,743,255 · +6.5%
- By 2040
- 1,948,712 · +19.0%
- By 2050
- 2,132,979 · +30.3%
- By 2075
- 2,530,027 · +54.5%
- By 2100
- 2,706,979 · +65.3%
Race, ethnicity, and origin ACS 2023
- Neighborhood character
- Majority White (65%)
- Race & ethnicity
- White 65% Hispanic / Latino 16% Black 14% Two or more races 7% Asian 4%
- Hispanic origin (detail)
- Mexican 3% Puerto Rican 3% Cuban 3% Salvadoran 2%
- Common ancestry
- Scotch-Irish 5% Romanian 4% Hispanic 3%
- Foreign-born
- 21% · Canada, Jamaica, Vietnam
- Languages at home
- 75% English-only · Spanish 12% French/Haitian/Cajun 4% Other Indo-European 3%
Political lean MEDSL · Palm Beach
- 2024 margin
- Toss-up / Even · D 50.0% · R 49.2%
- 2008→2024 swing
- -22.1pp toward R · 2008: 22.9pp · 2024: 0.8pp
- All cycles
- 2024: D+0.8 2020: D+12.8 2016: D+15.3 2012: D+17.0 2008: D+22.9
Not yet ingested
- Civics
- —
Market trends
- HPI YoY
- ▼ -0.67%
- Current HPI
- 271.0184
- Rent YoY
- —
- Metro
- —
- State GDP YoY
- ▲ 3.28%
- F500 in state
- 36
Industry mix (Fortune 500 HQ in FL)
| Industry | F500 HQs | Revenue |
|---|---|---|
| Industrial Technology | 2 | $29B |
|
||
| Insurance | 2 | $17B |
|
||
| Retail | 1 | $60B |
|
||
| Technology Distribution | 1 | $58B |
|
||
| Homebuilding | 1 | $35B |
|
||
| Technology Manufacturing | 1 | $35B |
|
||
Price history
-37.8% since first listed5 events — show timeline
- 2026-03-06 Price Changed $1,289,000 MARMLS
- 2025-11-13 Price Changed $1,320,000 MARMLS
- 2025-10-13 Price Changed $1,340,000 MARMLS
- 2025-09-22 Listed $1,360,000 MARMLS
- 2002-05-28 Sold (Public Records) $2,071,000 Public Records
Property tax history
+0.9%/yrLatest (2025): $10,141 · +3.2% YoY. Source: county tax records.
Cash-flow waterfall
monthlySold comps — $/sqft
last 12 mo · ≤1 miLoading sold comps…