613 Hilltop Dr · Tool, TX
Flood risk 1/10 · Minimal
- FEMA flood zone
- X (unshaded)
- Chance of flooding over 30 yrs
- 0.0%
- Est. flood insurance / yr
- $507 – $1,088
Fire risk 4/10 · Minor
- Est. fire insurance / yr
- $1,222 – $2,270
Heat risk 7/10 · Major
- Hot days now (above 109°F)
- 7 days/yr
- Hot days in 30 yrs
- 26 days/yr
Wind risk 6/10 · Moderate
- Chance of severe wind over 30 yrs
- 60.0%
Air-quality risk 2/10 · Minimal
- Unhealthy air days now
- 0 days/yr
- Unhealthy air days in 30 yrs
- 1 days/yr
Risk factors via First Street. Map © Google.
Why this score? — see what drove the B grade
The composite is a weighted blend of 9 inputs, each scored 0–100. Each bar is that input's sub-score; the figure is the points it added to the 100-point composite (weight × sub-score).
- Cash flow +29.9/30.0
- ARV discount +15.0/15.0
- DSCR +10.0/10.0
- 1% rule +7.4/10.0
- Schools +4.3/10.0
- Livability +3.3/5.0
- Rent growth +2.5/5.0
- Condition / age +2.5/5.0
- Appreciation +0.0/10.0
$99,500
🖨 Deal sheet 📄 Offer letter ✓ Due diligence
Listing remarks
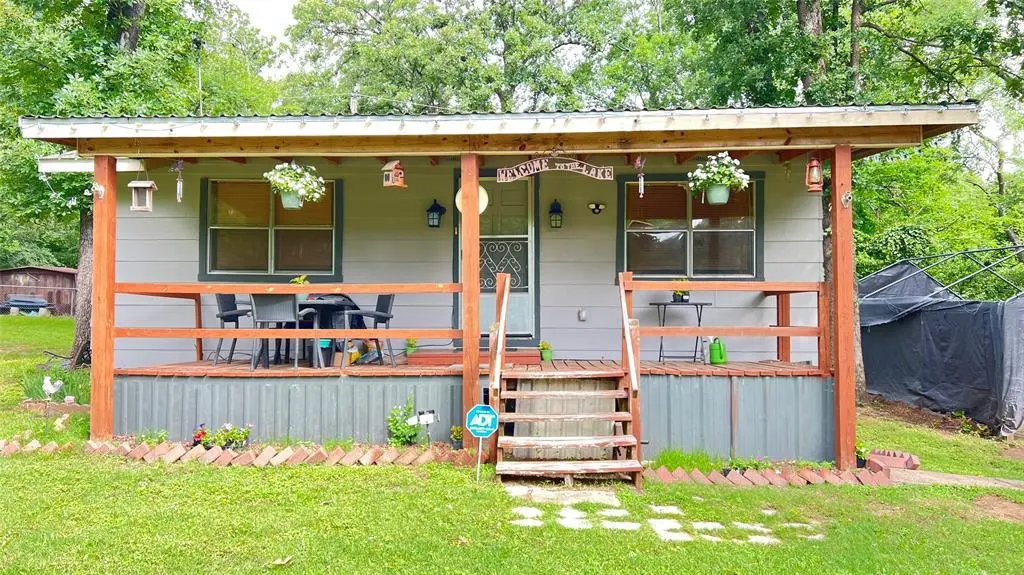
AFFORDABLE OPPORTUNITY in the laid-back waterfront community of Cedar Crest Shores on beautiful Cedar Creek Lake! This 2 BEDROOM 1 BATHROOM cabin built in 1971 sits on 2 LOTS totaling approximately 0.23 ACRES and offers tons of potential for a weekend getaway, rental investment, or full-time lake retreat. Features include a spacious covered front porch perfect for relaxing and enjoying the peaceful setting beneath mature shade trees. Home is ready for your personal updates and vision. Located in a desirable lake neighborhood with access to a community boat launch, fishing pier, and picnic area for enjoying the lake lifestyle. Conveniently located near restaurants, shopping, and entertainmen
Key facts
- Covered front porch
- Picnic area
- Fishing pier
Tags
Property features AI
Finance
- Other: Municipal Utility District serves the property; Deed restrictions apply
- Financial info: Listing accepts Cash, Conventional, or Owner Will Carry
- HOA & community: Mandatory association; Annual association fee of $120; Association provides full use of facilities; Community amenities include boat ramp, fishing, lake access, and park
Exterior
- Parking: 1 covered/carport space; Unpaved parking
- Utilities: Co-op electric available; Electricity connected; Individual water meter; MUD water; Septic system; Water heater listed as a green energy-efficient feature
- Home design: Single-family residence; One story; Deed-restricted subdivision
- Construction: Built in 1971; Composition roof; Pillar/post/pier foundation
- Exterior features: Covered porch; Covered patio/porch; Storage structure on the property; Few trees; Interior lot in a subdivision
Interior
- Kitchen: Electric range
- Bedrooms: 2 bedrooms (both on the main level)
- Flooring: Wood flooring
- Bathrooms: 1 full bathroom (on the main level)
- Heating & cooling: Ceiling fan(s); Window unit(s) for cooling; Other heating
- Interior features: Eat-in kitchen; High-speed internet available; Window coverings; One living area; One dining area; Total of 4 rooms
- Laundry & utility: Full-size washer/dryer area
Neighborhood map
What this means for you Summary
Snapshot
- This is a 2-bed/1.0-bath single-family listed at $100k.
Deal economics
- At list price, monthly cash flow is $367 ($4k/yr) — positive.
- The deal already cash-flows at list — no discount required.
- Meets the 1% rule at list price ($1k rent vs $100k).
- Recommended offer: $97k (3.0% below list) — sets the bar for market timing.
- Cap rate 10.7% vs local median 2.8% in Tool — top-decile yield for the area; either an underpriced asset or a hidden risk that comps aren't pricing in. Stress-test before assuming the spread holds.
Location & tenants
- Location reads 66/100 on livability (#651 in TX) — a middle-class / working-renter tenant base. Strengths: crime A+, cost of living A+, housing A+; Watch: employment D, amenities F, commute F.
- Malakoff ISD (town): math 48% / reading 54% proficiency, ranked #187 of 826 in TX (top 23%) — acceptable for families but not a draw, mixed tenant base, ~2y average lease; 61% free/reduced lunch — lower-income household profile, screen leases tightly.
- Zoned schools: Tool El (math 32% / reading 62%, grade D-, #1,006 of 4,322 statewide, top 25%, 267 students, 80% FRL) — zoned schools average 80% FRL vs 61% district-wide (19 pts higher); higher-poverty schools than district average — tighter screening recommended.
- Market conditions: 440 active listings in the ZIP; 4 comparable units currently listed for rent nearby; rentals at typical pace (median 24d on market — plan ~3-4 weeks tenant-placement turnaround); 263 units permitted in Henderson County in 2024 (0 in 5+ unit buildings).
Forward outlook
- Local home prices are declining (-3.0%/yr); year-one equity from $688 of loan paydown is wiped out by about $3k of value loss. Plan a longer hold.
- At projected returns (-3.0% appreciation + 3.0% rent growth), your $28k cash investment doubles in ~8 years — after that, you're playing with house money.
Negotiation context
- It's been on market 39 days — a 3% lower offer ($97k) is reasonable based on typical stale-listing flexibility.
- Current owner paid $25k; list at $100k implies a 298% gain — meaningful room to come down on a strong offer.
Risks & watch-outs
- Climate carrying-cost: major wind risk, 60% chance of damaging wind over 30y; extreme-heat days projected 7→26/yr by 2055 (HVAC capex compounding) — expect insurance premiums to compound above CPI over the hold.
Questions for the listing agent
- It's been on market 39 days. Have you received any prior offers? Is the seller open to a 3% concession, seller financing, or rate buy-down credit?
- Built in 1971 — when were the roof, HVAC, electrical panel, plumbing, and water heater last replaced?
- What does the HOA fee cover, when was the last increase, and are there any pending special assessments or reserve-fund shortfalls?
- Is there a deadline driving the sale (1031 exchange, divorce, estate, relocation)? That informs how much negotiation room exists.
- What's the average days-on-market for RENTAL listings here right now (not sales)? A rising rental-DOM trend means longer vacancies and softer asking-rent achievability than the comps imply.
- What's the recent tenant-quality profile in this submarket — average credit score on applications, eviction rate, late-payment / NSF rate, and stable-employment percentage? A property-management company in the area should have these aggregated.
- How much new for-sale + rental construction is in the pipeline within 1–3 miles? Heavy new supply typically softens prices + rents 12–24 months out; constrained supply supports both.
Investment metrics
- 1% rule
- 1.24% ✓
- Cap rate
- 10.72%
- Cash-on-cash
- 15.82%
- DSCR
- 1.70
- GRM
- 6.7
CMA / ARV
- ARV (median comp)
- $149,900
- List price
- $99,500
- Delta
- -33.62%
- Verdict
- UNDERPRICED
- Comps
- 13 within 1.0 mi
Show comp detail 5 sales within ~0.75 mi
| Address | Dist | Beds/Ba | Sqft | Sold | Price | $/sf | Match |
|---|---|---|---|---|---|---|---|
| 617 Westwind Rd | 0.06mi | 2/1.0 | 792 (+5%) | 1mo | $45,000 | $57 | 87 |
| 709 Westwind | 0.05mi | 2/1.0 | 768 (+2%) | 14mo | $219,500 | $286 | 83 |
| 601 Hilltop Dr | 0.03mi | 2/1.0 | 780 (+4%) | 21mo | $169,000 | $217 | 75 |
| 9460 County Road 2403 | 0.73mi | 1/1.0 (-1) | 720 (-4%) | 3mo | $125,000 | $174 | 51 |
| 518 Buffalo Ln | 0.46mi | 1/1.0 (-1) | 648 (-14%) | 3mo | $149,900 | $231 | 48 |
Match score weights: distance 35% · size 25% · config 20% · recency 20%. Top-matched comps best support the ARV.
Projected returns pro-forma
-3.0% appreciation · 3.0% rent growth · sell at horizon
- IRR
- 6.7%
- Equity multiple
- 1.26×
- Total profit
- $7,244
- Equity at exit
- $14,836
- IRR
- 16.0%
- Equity multiple
- 2.30×
- Total profit
- $36,317
- Equity at exit
- $8,603
Cash invested: $27,860 (down + closing). Projections, not guarantees.
Landlord ↔ Tenant lean methodology
- Overall (STATE)
- 87 Strongly Landlord-Friendly
- State Texas
- 87 Strongly Landlord-Friendly · R+5
- County
- — inherits STATE
- City
- — inherits STATE
ZIP-level market 75143
- Home prices YoY
- -11.4%
- Active inventory
- 440
- Price-to-rent
- 6.7×
Monthly cashflow live
- Estimated rent
- $1,237 medium interval (Pro) →
- Mortgage (P&I)
- −$522
- Tax from tax record
- −$37 /mo · $442/yr
- Insurance
- −$41
- HOA
- −$10
- Vacancy / Maint / Mgmt
- −$260
- Net cashflow
- $367
Break-even live
UW: 25.0% down · 7.5% · 30yr · 1.5% tax · 5.0% vac · 8.0% maint · 8.0% mgmt
Financing live
Cash to close
- Down payment
- $24,875
- Closing costs
- $2,985
- Reserves months
- —
- Total cash needed
- —
Loan-product check · same deal, 3 products live
Conventional
25% down · 7.5% · 30yr
- Down + closing
- —
- Monthly P&I
- —
- Monthly cashflow
- —
- DSCR
- —
- Eligible?
- —
Personal DTI + credit; lowest rate.
DSCR
20% down · 8.5% · 30yr
- Down + closing
- —
- Monthly P&I
- —
- Monthly cashflow
- —
- DSCR
- —
- Eligible?
- —
No personal income docs; deal must DSCR.
Hard money
10% down · 12.0% · 12mo
- Down + closing
- —
- Monthly P&I
- —
- Monthly cashflow
- —
- DSCR
- —
- Eligible?
- —
Short-term bridge; refi at stabilization.
Rent comps 4 comps
| Address | Beds | Baths | Sqft | Rent | $/sqft | DOM | Units | Dist |
|---|---|---|---|---|---|---|---|---|
| 1012 Whispering Springs Dr Tool, TX | 2.0 | 2.0 | 904 | $1,290 | $1.43 | 43d | 1 | 0.43mi |
| 1305 N Tool Dr Unit 14 Tool, TX | 1.0 | 1.0 | 580 | $1,300 | $2.24 | 24d | 1 | 0.47mi |
| 1305 N Tool Dr Unit 1 Tool, TX | 1.0 | 1.0 | 580 | $1,175 | $2.03 | 24d | 1 | 0.47mi |
| 1305 N Tool Dr Unit 8 Tool, TX | 1.0 | 1.0 | 580 | $1,175 | $2.03 | 11d | 1 | 0.47mi |
HOA detail
- Monthly dues
- $10 · $120/yr
- Likely covers
- water
Listing history 19 events
-
2026-06-19days on market $99,500 Active 39 DOM
-
2026-06-18days on market $99,500 Active 38 DOM
-
2026-06-17days on market $99,500 Active 37 DOM
-
2026-06-16days on market $99,500 Active 36 DOM
-
2026-06-15days on market $99,500 Active 35 DOM
-
2026-06-14days on market $99,500 Active 33 DOM
-
2026-06-12days on market $99,500 Active 32 DOM
-
2026-06-09days on market $99,500 Active 29 DOM
-
2026-06-08days on market $99,500 Active 28 DOM
-
2026-06-07days on market $99,500 Active 27 DOM
-
2026-06-02days on market $99,500 Active 22 DOM
-
2026-06-01days on market $99,500 Active 21 DOM
-
2026-05-31days on market $99,500 Active 20 DOM
-
2026-05-30days on market $99,500 Active 19 DOM
-
2026-05-10$99,500 Active 909-char remark
-
2025-10-27soldstatus
-
2019-01-22soldstatus
-
1995-12-20soldstatus $25,000
-
1995-12-01soldstatus
ⓘ Source: listings_history table (triggers on properties + properties_extension) + one-shot
backfill from property_details.listing_events for pre-trigger history.
Tax reassessment forecast TX · Resets to sale price
- Current annual tax
- $442 · $37/mo
- Projected year-2 tax
- $1,821 · $152/mo
- Expected delta
- +$1,378/yr (+$115/mo · 311.6%)
ⓘ Screening estimate from a state-policy table — verify with the county assessor before closing.
Climate risk First Street
- Flood 1/10 Low FEMA zone X (unshaded) · 0% chance over 30 yrs
- Wildfire 4/10 Moderate
- Heat 7/10 Severe 7 d/yr ≥109°F today · 26 d/yr by 30 yrs out
- Wind 6/10 Major 60% chance of damaging wind over 30 yrs
- Air quality 2/10 Low 0 unhealthy d/yr today · 1 by 30 yrs out
Nearby sold comps map
Loading sold comps map…
Walkable amenities ~0.75 mi
Loading nearby amenities…
Taxation est. · year 1
- Rental income
- $14,847
- − Mortgage interest
- −$5,574
- − Property taxes
- −$442
- − Insurance
- −$498
- − Repairs & maintenance
- −$1,188
- − Management
- −$1,188
- − HOA
- −$120
- − Depreciation
- −$2,895
- Taxable income
- $2,944
- Est. tax owed @ 24.0%
- −$707
- After-tax cash flow
- $3,702/yr
For passive investors: Depreciation is non-cash, so a rental often shows a tax loss while cash-flowing — sheltering income. Rental losses are passive: they offset passive income freely, and up to $25,000/yr can offset ordinary (W-2) income if you actively participate and your MAGI is under $100k (phasing out to $0 by $150k); unused losses carry forward. On sale, claimed depreciation is recaptured at up to 25%, and gains may owe capital-gains tax (a 1031 exchange can defer both). Figures are a year-1 estimate at your 24.0% rate — not tax advice; consult a CPA.
Schools (NCES district)
- District
- Malakoff ISD
- NCES district ID
- 4828780
- Math proficiency
- 48% ▼ -14.00%
- Reading proficiency
- 54% ▼ -5.00%
- Median HH income
- $38,970
- Composite
- 42.54/100
- National rank
- #3200
- State rank
- #187 of 826 in TX
Livability — Tool
- Score
- 66/100
- State rank
- #651
- US rank
- #12292
Category grades
Schools grade is shown separately in the Schools card above.
Census & demographics
- Census place
- Tool, TX
- Population (ZIP)
- 14,676
Population outlook (Henderson County) Hauer SSP2
- Today (2025)
- 80,471 people
- By 2030
- 80,608 · +0.2%
- By 2040
- 80,087 · -0.5%
- By 2050
- 78,208 · -2.8%
- By 2075
- 72,423 · -10.0%
- By 2100
- 61,012 · -24.2%
Race, ethnicity, and origin ACS 2023
- Neighborhood character
- Predominantly White (80%)
- Race & ethnicity
- White 80% Hispanic / Latino 13% Two or more races 8% Black 2%
- Hispanic origin (detail)
- Mexican 13%
- Common ancestry
- Italian 2% Iranian 2% Lithuanian 1%
- Foreign-born
- 4% · Canada, China
- Languages at home
- 90% English-only · Spanish 9%
Political lean MEDSL · Henderson
- 2024 margin
- Solid R (+63.5) · D 18.0% · R 81.4%
- 2008→2024 swing
- -18.8pp toward R · 2008: -44.6pp · 2024: -63.5pp
- All cycles
- 2024: R+63.5 2020: R+60.2 2016: R+60.0 2012: R+54.8 2008: R+44.6
Not yet ingested
- Civics
- —
Market trends
- HPI YoY
- ▼ -42.99%
- Current HPI
- 332.57
- Rent YoY
- —
- Metro
- —
- State GDP YoY
- ▲ 3.95%
- F500 in state
- 110
Industry mix (Fortune 500 HQ in TX)
| Industry | F500 HQs | Revenue |
|---|---|---|
| Energy | 16 | $1,198B |
|
||
| Technology | 5 | $198B |
|
||
| Engineering / Construction | 4 | $72B |
|
||
| Energy Services | 3 | $60B |
|
||
| Utilities | 3 | $41B |
|
||
| Healthcare | 2 | $330B |
|
||
Price history
+298.0% since first listed5 events — show timeline
- 2026-05-10 Listed $99,500 NTREIS
- 2025-10-27 Sold (Public Records) — Public Records
- 2019-01-22 Sold (Public Records) — Public Records
- 1995-12-20 Sold (Public Records) $25,000 Public Records
- 1995-12-01 Sold (Public Records) — Public Records
Property tax history
-4.8%/yrLatest (2025): $442 · +13.3% YoY. Source: county tax records.
Cash-flow waterfall
monthlySold comps — $/sqft
last 12 mo · ≤1 miLoading sold comps…