 🏷️ Likely Rental
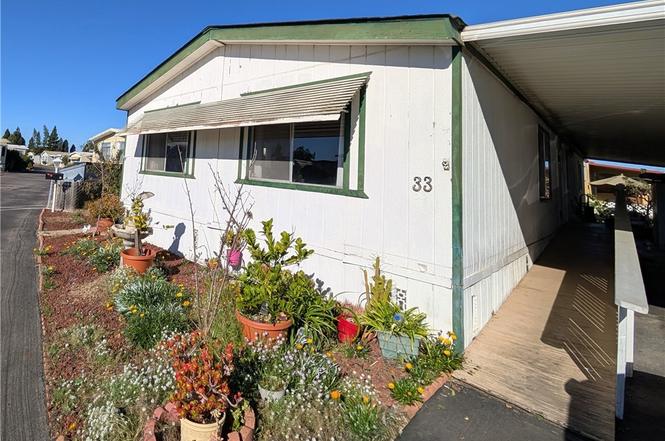
1701 S Thornburg #33 · Santa Maria, CA
Flood risk 1/10 · Minimal
- FEMA flood zone
- X (unshaded)
- Chance of flooding over 30 yrs
- 0.0%
- Est. flood insurance / yr
- $507 – $1,088
Fire risk 1/10 · Minimal
- Est. fire insurance / yr
- $659 – $1,223
Heat risk 3/10 · Minor
- Hot days now (above 84°F)
- 7 days/yr
- Hot days in 30 yrs
- 16 days/yr
Wind risk 1/10 · Minimal
- Chance of severe wind over 30 yrs
- —
Air-quality risk 6/10 · Moderate
- Unhealthy air days now
- 8 days/yr
- Unhealthy air days in 30 yrs
- 10 days/yr
Risk factors via First Street. Map © Google.
Why this score? — see what drove the B+ grade
The composite is a weighted blend of 9 inputs, each scored 0–100. Each bar is that input's sub-score; the figure is the points it added to the 100-point composite (weight × sub-score).
- Cash flow +30.0/30.0
- ARV discount +15.0/15.0
- 1% rule +10.0/10.0
- DSCR +10.0/10.0
- Livability +3.6/5.0
- Rent growth +3.1/5.0
- Schools +2.9/10.0
- Condition / age +2.5/5.0
- Appreciation +0.0/10.0
$99,000
🖨 Deal sheet (PDF) 📄 Offer letter ✓ Due diligence
Listing remarks MLS
Well-maintained 1982 Fleetwood manufactured home, trade name Stone Ridge, offering approximately 1,344 square feet of comfortable living space. This two-bedroom, two-bath home features a functional floor plan with generous room sizes and excellent natural flow. The home includes high-quality carpeting with thick padding that has been recently professionally cleaned, creating a soft and comfortable feel throughout. A small private yard and two storage sheds provide additional outdoor utility. Included appliances are dishwasher, stove, and refrigerator. Washer and dryer are excluded. Community is age-restricted: one full-time resident must be 55 years of age or older, and all additional occupants must be at least 35 years of age. Dogs are permitted up to 35 pounds; no aggressive breeds--buyer to verify pet restrictions with park management. Space rent to new owner is $1,269.63 per month and includes water, trash, and sewer, per park management. Buyer to confirm space rent, park rules, age requirements, and all information with park management to their satisfaction.
Key facts
- 1,347 sq ft lot
- 2 parking spots
- Community pool
Property features AI
Finance
- Other: Rent includes sewer, trash and water
- Financial info: Monthly land lease payable to the park
- HOA & community: Located in La Maria Mobile Home Park; Senior community; Park amenities include pool, clubhouse, multipurpose room; Pet rules and permitted with breed restrictions and weight limit; Biking-friendly community; Manager approval required
Exterior
- Parking: Attached carport; 2 parking spaces (2 carport spaces)
- Utilities: Electricity on property / connected; Natural gas available; Public sewer / sewer connected; District/public water / water connected; Telephone available in street
- Home design: Mobile home (Stoneridge model); Double wide; One story; Entry level: 1; Mobile home remains on site
- Construction: Pillar/post/pier foundation
- Exterior features: Composition roof; Awning; Front porch; Porch; Patio; Community pool; Two sheds / storage buildings
Interior
- Kitchen: Dishwasher; Electric oven; Refrigerator
- Bedrooms: All bedrooms on the main floor; Den
- Flooring: Carpet
- Bathrooms: 2 full bathrooms; Bathtub and separate shower; Shower-in-tub configuration
- Heating & cooling: Forced air heating
- Interior features: Beamed ceilings; Storage space; Unfurnished; Single-level home; Front entry via carport
- Laundry & utility: Washer hookup; Gas and electric dryer hookups; Washer and dryer excluded from sale
Neighborhood map
What this means for you Summary
Snapshot
- This is a 2-bed/2.0-bath manufactured listed at $99k.
Deal economics
- At list price, monthly cash flow is $924 ($11k/yr) — positive.
- The deal already cash-flows at list — no discount required.
- Meets the 1% rule at list price ($2k rent vs $99k).
- Recommended offer: $87k (12.0% below list) — sets the bar for market timing.
- Cap rate 17.5% vs local median 3.5% in Santa Maria — top-decile yield for the area; either an underpriced asset or a hidden risk that comps aren't pricing in. Stress-test before assuming the spread holds.
Location & tenants
- Location reads 71/100 on livability (#202 in CA) — a middle-class / working-renter tenant base. Strengths: amenities A+, commute A+, health & safety A; Watch: crime F, cost of living F.
- Santa Maria-Bonita (urban): math 26% / reading 34% proficiency, ranked #1,023 of 1,400 in CA (top 73%) — families likely to look elsewhere, expect single-tenant / working-renter base with shorter leases; 72% free/reduced lunch — lower-income household profile, screen leases tightly.
- Zoned schools: Jimenez Roberto And Dr. Francisco Elementary (938 students, 58% FRL); Arellanes Junior High (596 students, 81% FRL); Santa Maria High (3,196 students, 77% FRL) — zoned schools at 72% FRL track the district average.
- Market conditions: Rents rising (+2.3%/yr); 56 active listings in the ZIP; 11 comparable units currently listed for rent nearby; rentals at typical pace (median 16d on market — plan ~3-4 weeks tenant-placement turnaround); solid renter incomes; 719 units permitted in Santa Barbara County in 2024 (217 in 5+ unit buildings).
- This rent runs 31% of the median local income ($75k/yr) — at the standard rent-burdened threshold; future hikes will face affordability resistance.
Forward outlook
- Local home prices are declining (-3.0%/yr); year-one equity from $684 of loan paydown is wiped out by about $3k of value loss. Plan a longer hold.
- Santa Barbara County population projected at +20% by 2050 — long-run rental-demand tailwind backs the buy-and-hold thesis.
- At projected returns (-3.0% appreciation + 2.3% rent growth), your $28k cash investment doubles in ~3 years — after that, you're playing with house money.
Negotiation context
- It's been on market 163 days — a 12% lower offer ($87k) is reasonable based on typical stale-listing flexibility.
- 6 sale attempts since 25y ago with the ask held roughly flat each time — persistent listings suggest the price (not the market) is what's stuck; bring a comps-based counter.
- Current owner paid $46k; list at $99k implies a 113% gain — meaningful room to come down on a strong offer.
Questions for the listing agent
- It's been on market 163 days. Have you received any prior offers? Is the seller open to a 12% concession, seller financing, or rate buy-down credit?
- Why hasn't it sold? Are there any deal-killer items the seller is aware of (foundation, flood, title, zoning, code violations)?
- Is there a deadline driving the sale (1031 exchange, divorce, estate, relocation)? That informs how much negotiation room exists.
- Schools are F-rated, which usually means shorter tenancies and higher turnover. Who's the typical renter profile here, and what's been the actual vacancy rate?
- Crime grade is F in this area — have there been break-ins, vandalism, or insurance claims at this property in the last 3 years? What carrier currently insures it and at what premium?
- What's the average days-on-market for RENTAL listings here right now (not sales)? A rising rental-DOM trend means longer vacancies and softer asking-rent achievability than the comps imply.
- What's the recent tenant-quality profile in this submarket — average credit score on applications, eviction rate, late-payment / NSF rate, and stable-employment percentage? A property-management company in the area should have these aggregated.
- How much new for-sale + rental construction is in the pipeline within 1–3 miles? Heavy new supply typically softens prices + rents 12–24 months out; constrained supply supports both.
Investment metrics
- 1% rule
- 1.95% ✓
- Cap rate
- 17.49%
- Cash-on-cash
- 40.00%
- DSCR
- 2.78
- GRM
- 4.3
CMA / ARV
- ARV (on-the-fly)
- $131,712
- Comps found
- 6
Show comp detail 6 sales within ~0.75 mi
| Address | Dist | Beds/Ba | Sqft | Sold | Price | $/sf | Match |
|---|---|---|---|---|---|---|---|
| 1701 S Thornburg St #28 | 0.02mi | 2/2.0 | 1,248 (-7%) | 9mo | $90,000 | $72 | 80 |
| 1701 S Thornburg St #139 | 0.11mi | 2/2.0 | 1,368 (+2%) | 21mo | $135,000 | $99 | 75 |
| 1701 S Thornburg St #61 | 0.06mi | 2/2.0 | 1,200 (-11%) | 6mo | $84,500 | $70 | 74 |
| 1701 S Thornburg #156 | 0.08mi | 3/2.0 (+1) | 1,434 (+7%) | 9mo | $235,000 | $164 | 72 |
| 1701 S Thornburg St #108 | 0.13mi | 3/2.0 (+1) | 1,200 (-11%) | 4mo | $108,000 | $90 | 68 |
| 1701 S Thornburg St #73 | 0.06mi | 2/2.0 | 1,536 (+14%) | 10mo | $150,000 | $98 | 65 |
Match score weights: distance 35% · size 25% · config 20% · recency 20%. Top-matched comps best support the ARV.
Projected returns pro-forma
-3.0% appreciation · 2.31% rent growth · sell at horizon
- IRR
- 35.6%
- Equity multiple
- 2.50×
- Total profit
- $41,448
- Equity at exit
- $14,761
- IRR
- 42.0%
- Equity multiple
- 4.84×
- Total profit
- $106,387
- Equity at exit
- $8,560
Cash invested: $27,720 (down + closing). Projections, not guarantees.
Landlord ↔ Tenant lean methodology
- Overall (STATE)
- 18 Strongly Tenant-Friendly
- State California
- 18 Strongly Tenant-Friendly · D+13
- County
- — inherits STATE
- City
- — inherits STATE
ZIP-level market 93458
- Rents YoY
- 2.3%
- Active inventory
- 56
- Price-to-rent
- 4.3×
Monthly cashflow live
- Estimated rent
- $1,931 high interval (Pro) →
- Mortgage (P&I)
- −$519
- Tax from tax record
- −$41 /mo · $496/yr
- Insurance
- −$41
- HOA
- −$0
- Lot rent leased land?
- −$0
- Vacancy / Maint / Mgmt
- −$406
- Net cashflow
- $924
Break-even live
Sensitivity live
| Price | -10% $980 | -5% $952 | +0% $924 | +5% $896 | +10% $868 |
|---|---|---|---|---|---|
| Rent | -10% $771 | -5% $848 | +0% $924 | +5% $1,000 | +10% $1,076 |
| Rate | -1.0pp $974 | -0.5pp $949 | base $924 | +0.5pp $898 | +1.0pp $872 |
UW: 25.0% down · 7.5% · 30yr · 1.5% tax · 5.0% vac · 8.0% maint · 8.0% mgmt
Financing live
Cash to close
- Down payment
- $24,750
- Closing costs
- $2,970
- Reserves months
- —
- Total cash needed
- —
Loan-product check · same deal, 3 products live
Conventional
25% down · 7.5% · 30yr
- Down + closing
- —
- Monthly P&I
- —
- Monthly cashflow
- —
- DSCR
- —
- Eligible?
- —
Personal DTI + credit; lowest rate.
DSCR
20% down · 8.5% · 30yr
- Down + closing
- —
- Monthly P&I
- —
- Monthly cashflow
- —
- DSCR
- —
- Eligible?
- —
No personal income docs; deal must DSCR.
Hard money
10% down · 12.0% · 12mo
- Down + closing
- —
- Monthly P&I
- —
- Monthly cashflow
- —
- DSCR
- —
- Eligible?
- —
Short-term bridge; refi at stabilization.
Rent comps 11 comps
| Address | Beds | Baths | Sqft | Rent | $/sqft | DOM | Units | Dist |
|---|---|---|---|---|---|---|---|---|
| 1720 S Depot St Santa Maria, CA | 1.0–4.0 | 1.0–2.0 | 1308 | $2,197 | $1.68 | 16d | 5 | 0.18mi |
| 800 W Battles Rd Santa Maria, CA | 2.0–3.0 | 2.0 | 1104 | $2,403 | $2.18 | 16d | 6 | 0.37mi |
| 983 Dan Blough Dr Santa Maria, CA | 1.0–3.0 | 1.0–3.0 | 1017 | $3,073 | $3.02 | 16d | 45 | 0.52mi |
| 333 E Enos Dr Santa Maria, CA | 1.0–2.0 | 1.0–2.0 | 735 | $2,499 | $3.40 | 16d | 12 | 0.64mi |
| 1735 Biscayne St Santa Maria, CA | 3.0 | 2.0 | 1257 | $3,081 | $2.45 | 16d | 9 | 0.67mi |
| 1708 Rio Vista Ln Unit 1 Santa Maria, CA | 2.0 | 2.0 | 1075 | $3,000 | $2.79 | 16d | 1 | 0.75mi |
| 2299 Carrasco Way Santa Maria, CA | 3.0 | 2.5–3.5 | 1419 | $3,500 | $2.47 | 16d | 2 | 0.82mi |
| 310 E McCoy Ln Santa Maria, CA | 2.0–3.0 | 2.0 | 1130 | $2,200 | $1.95 | 16d | 2 | 1.00mi |
| 310 W McCoy Ln Santa Maria, CA | 3.0 | 2.0 | 1130 | $2,600 | $2.30 | 16d | 1 | 1.01mi |
| 703 Meehan St Santa Maria, CA | 3.0 | 1.0–2.0 | 700 | $2,917 | $4.16 | 16d | 14 | 1.01mi |
| 620 W Park Ave Santa Maria, CA | 2.0 | 2.0 | 1450 | $2,850 | $1.97 | 16d | 1 | 1.07mi |
Listing history 28 events
-
2026-06-21days on market $99,000 Active 163 DOM
-
2026-06-18days on market $99,000 Active 160 DOM
-
2026-06-17days on market $99,000 Active 159 DOM
-
2026-06-16days on market $99,000 Active 158 DOM
-
2026-06-15days on market $99,000 Active 157 DOM
-
2026-06-14days on market $99,000 Active 155 DOM
-
2026-06-13days on market $99,000 Active 154 DOM
-
2026-06-10days on market $99,000 Active 152 DOM
-
2026-06-09days on market $99,000 Active 151 DOM
-
2026-06-08days on market $99,000 Active 150 DOM
-
2026-06-07days on market $99,000 Active 149 DOM
-
2026-06-05days on market $99,000 Active 146 DOM
-
2026-06-03days on market $99,000 Active 145 DOM
-
2026-06-02days on market $99,000 Active 144 DOM
-
2026-06-01days on market $99,000 Active 143 DOM
-
2026-05-31days on market $99,000 Active 142 DOM
-
2026-05-30days on market $99,000 Active 141 DOM
-
2026-01-09$99,000 Active
-
2026-01-08historical $99,000
-
2026-01-03$99,000 Active 1079-char remark
Show marketing remark (1079 chars)
Well-maintained 1982 Fleetwood manufactured home, trade name Stone Ridge, offering approximately 1,344 square feet of comfortable living space. This two-bedroom, two-bath home features a functional floor plan with generous room sizes and excellent natural flow. The home includes high-quality carpeting with thick padding that has been recently professionally cleaned, creating a soft and comfortable feel throughout. A small private yard and two storage sheds provide additional outdoor utility. Included appliances are dishwasher, stove, and refrigerator. Washer and dryer are excluded. Community is age-restricted: one full-time resident must be 55 years of age or older, and all additional occupants must be at least 35 years of age. Dogs are permitted up to 35 pounds; no aggressive breeds--buyer to verify pet restrictions with park management. Space rent to new owner is $1,269.63 per month and includes water, trash, and sewer, per park management. Buyer to confirm space rent, park rules, age requirements, and all information with park management to their satisfaction.
-
2017-04-06historical
-
2017-04-06historical
-
2005-02-01$65,000
-
2005-02-01$69,900
-
2003-03-07soldstatus $46,500
-
2002-11-26$47,990
-
2001-02-23soldstatus $28,500
-
2001-01-26$27,000
ⓘ Source: listings_history table (triggers on properties + properties_extension) + one-shot
backfill from property_details.listing_events for pre-trigger history.
Tax reassessment forecast CA · Resets to sale price
- Current annual tax
- $496 · $41/mo
- Projected year-2 tax
- $752 · $63/mo
- Expected delta
- +$256/yr (+$21/mo · 51.6%)
ⓘ Screening estimate from a state-policy table — verify with the county assessor before closing.
Climate risk First Street
- Flood 1/10 Low FEMA zone X (unshaded) · 0% chance over 30 yrs
- Wildfire 1/10 Low
- Heat 3/10 Moderate 7 d/yr ≥84°F today · 16 d/yr by 30 yrs out
- Wind 1/10 Low
- Air quality 6/10 Major 8 unhealthy d/yr today · 10 by 30 yrs out
Nearby sold comps map
Loading sold comps map…
Walkable amenities ~0.75 mi
Loading nearby amenities…
Taxation est. · year 1
- Rental income
- $23,175
- − Mortgage interest
- −$5,546
- − Property taxes
- −$496
- − Insurance
- −$495
- − Repairs & maintenance
- −$1,854
- − Management
- −$1,854
- − Depreciation
- −$2,880
- Taxable income
- $10,050
- Est. tax owed @ 24.0%
- −$2,412
- After-tax cash flow
- $8,675/yr
For passive investors: Depreciation is non-cash, so a rental often shows a tax loss while cash-flowing — sheltering income. Rental losses are passive: they offset passive income freely, and up to $25,000/yr can offset ordinary (W-2) income if you actively participate and your MAGI is under $100k (phasing out to $0 by $150k); unused losses carry forward. On sale, claimed depreciation is recaptured at up to 25%, and gains may owe capital-gains tax (a 1031 exchange can defer both). Figures are a year-1 estimate at your 24.0% rate — not tax advice; consult a CPA.
Schools (NCES district)
- District
- Santa Maria-Bonita
- NCES district ID
- 0605580
- Math proficiency
- 26% ▲ 3.00%
- Reading proficiency
- 34% ▲ 3.00%
- Median HH income
- $50,959
- Composite
- 29.11/100
- National rank
- #11891
- State rank
- #1023 of 1400 in CA
Livability — Santa Maria
- Score
- 71/100
- State rank
- #202
- US rank
- #6519
Category grades
Schools grade is shown separately in the Schools card above.
Census & demographics
- Census place
- Santa Maria, CA
- County
- Santa Barbara County · 410,380 people
- City population
- 145,655
- Metro
- Santa Maria-Santa Barbara, CA
- Population (ZIP)
- 59,148
- Household income
- $75,257
- Rent vs Own
- Severe rent burden
- 2583.0
Population outlook (Santa Barbara County) Hauer SSP2
- Today (2025)
- 484,679 people
- By 2030
- 505,323 · +4.3%
- By 2040
- 545,783 · +12.6%
- By 2050
- 584,263 · +20.5%
- By 2075
- 682,586 · +40.8%
- By 2100
- 723,188 · +49.2%
Race, ethnicity, and origin ACS 2023
- Neighborhood character
- Predominantly Hispanic (87%)
- Race & ethnicity
- Hispanic / Latino 87% Two or more races 41% White 8% Asian 4% Native American 4%
- Hispanic origin (detail)
- Mexican 83%
- Common ancestry
- Lithuanian 1%
- Foreign-born
- 40% · Canada, Jamaica
- Languages at home
- 21% English-only · Spanish 72% Tagalog/Filipino 2% Other Asian/Pacific 1%
Political lean MEDSL · Santa Barbara
- 2024 margin
- Strong D (+26.7) · D 61.8% · R 35.1% · Other 3.1%
- 2008→2024 swing
- +3.8pp toward D · 2008: 22.9pp · 2024: 26.7pp
- All cycles
- 2024: D+26.7 2020: D+32.1 2016: D+28.2 2012: D+17.1 2008: D+22.9
Not yet ingested
- Civics
- —
Market trends
- HPI YoY
- ▼ -422.91%
- Current HPI
- 347.9281
- Rent YoY
- ▲ 2.31%
- Metro
- Santa Maria-Santa Barbara, CA
- State GDP YoY
- ▲ 3.21%
- F500 in state
- 116
Industry mix (Fortune 500 HQ in CA)
| Industry | F500 HQs | Revenue |
|---|---|---|
| Technology | 27 | $1,492B |
|
||
| Financial Services | 3 | $174B |
|
||
| Retail | 3 | $44B |
|
||
| Insurance | 3 | $26B |
|
||
| Media / Entertainment | 2 | $115B |
|
||
| Pharmaceuticals / Biotech | 2 | $62B |
|
||
Price history
+266.7% since first listed11 events — show timeline
- 2026-01-09 Listed $99,000 CRMLS
- 2026-01-08 Coming Soon $99,000 CRMLS
- 2026-01-03 Listed $99,000 NSBCRMLS
- 2017-04-06 Listing Removed — NSBCRMLS
- 2017-04-06 Listing Removed — NSBCRMLS
- 2005-02-01 Listed $69,900 NSBCRMLS
- 2005-02-01 Listed $65,000 NSBCRMLS
- 2003-03-07 Sold (MLS) $46,500 NSBCRMLS
- 2002-11-26 Listed $47,990 NSBCRMLS
- 2001-02-23 Sold (MLS) $28,500 NSBCRMLS
- 2001-01-26 Listed $27,000 NSBCRMLS
Property tax history
+1.9%/yrLatest (2025): $496 · +4.5% YoY. Source: county tax records.
Cash-flow waterfall
monthlySold comps — $/sqft
last 12 mo · ≤1 miLoading sold comps…