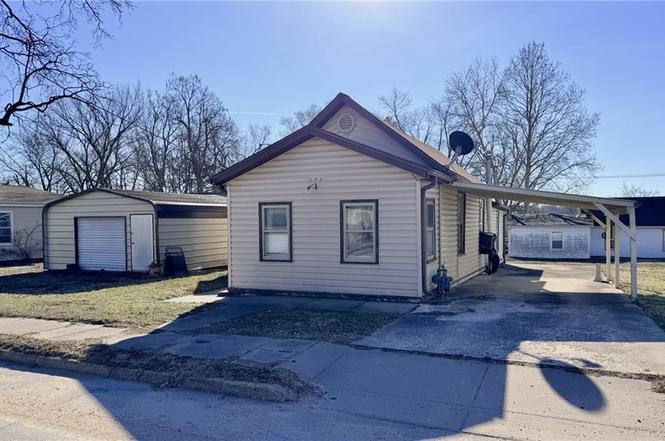
504 E 17th St · Trenton, MO
Flood risk 1/10 · Minimal
- FEMA flood zone
- X (unshaded)
- Chance of flooding over 30 yrs
- 0.0%
- Est. flood insurance / yr
- $507 – $1,088
Fire risk 1/10 · Minimal
- Est. fire insurance / yr
- $1,054 – $1,958
Heat risk 4/10 · Minor
- Hot days now (above 106°F)
- 7 days/yr
- Hot days in 30 yrs
- 15 days/yr
Wind risk 2/10 · Minimal
- Chance of severe wind over 30 yrs
- —
Air-quality risk 2/10 · Minimal
- Unhealthy air days now
- 0 days/yr
- Unhealthy air days in 30 yrs
- 2 days/yr
Risk factors via First Street. Map © Google.
Why this score? — see what drove the B+ grade
The composite is a weighted blend of 9 inputs, each scored 0–100. Each bar is that input's sub-score; the figure is the points it added to the 100-point composite (weight × sub-score).
- Cash flow +30.0/30.0
- ARV discount +15.0/15.0
- 1% rule +10.0/10.0
- DSCR +10.0/10.0
- Livability +3.8/5.0
- Schools +3.0/10.0
- Rent growth +2.5/5.0
- Condition / age +2.5/5.0
- Appreciation +0.0/10.0
$45,000
🖨 Deal sheet 📄 Offer letter ✓ Due diligence
Listing remarks
Charming 1910 ranch home offering 990 square feet of living space with 2 bedrooms and 1 bathroom. This property features a comfortable living room, kitchen, and enclosed front porch—perfect for enjoying your morning coffee. Heating is provided by a wall-mounted natural gas heater, with window AC for cooling. Exterior highlights include low-maintenance vinyl siding, a good-sized yard, concrete patio area, carport, detached garage with concrete floor, and additional storage shed. Conveniently located close to the college, this home has great potential as a starter home or rental investment. Needs TLC and updating, but priced to sell—an excellent opportunity. Bring your vision and
Key facts
- Good-sized yard
- Concrete patio area
- Enclosed front porch
Tags
Neighborhood map
What this means for you Summary
Snapshot
- This is a 2-bed/1.0-bath single-family listed at $45k.
Deal economics
- At list price, monthly cash flow is $399 ($5k/yr) — positive.
- The deal already cash-flows at list — no discount required.
- Meets the 1% rule at list price ($874 rent vs $45k).
- Recommended offer: $44k (3.0% below list) — sets the bar for market timing.
- Cap rate 16.9% vs local median 6.2% in Trenton — top-decile yield for the area; either an underpriced asset or a hidden risk that comps aren't pricing in. Stress-test before assuming the spread holds.
Location & tenants
- Location reads 76/100 on livability (#49 in MO, #3,686 nationally) — a middle-class / working-renter tenant base. Strengths: cost of living A+, housing A+, health & safety A+; Watch: schools C-, employment C-, amenities F.
- Trenton R-IX (town): math 28% / reading 43% proficiency, ranked #223 of 324 in MO (top 69%) — families likely to look elsewhere, expect single-tenant / working-renter base with shorter leases.
- Market conditions: 50 active listings in the ZIP; 2 units permitted in Grundy County in 2024 (0 in 5+ unit buildings).
Forward outlook
- Local home prices are declining (-3.0%/yr); year-one equity from $311 of loan paydown is wiped out by about $1k of value loss. Plan a longer hold.
- Grundy County population projected at -14% by 2050 — secular population decline; favor cash flow + early exit over multi-decade hold.
- At projected returns (-3.0% appreciation + 3.0% rent growth), your $13k cash investment doubles in ~4 years — after that, you're playing with house money.
Negotiation context
- It's been on market 42 days — a 3% lower offer ($44k) is reasonable based on typical stale-listing flexibility.
- 2 sale attempts; this cycle's ask has dropped $5k (10%) from the opening price — seller is motivated, your offer sets the floor, not the list.
Risks & watch-outs
- Watch-outs: built in 1910 — expect roof / HVAC / electrical / plumbing capex.
Questions for the listing agent
- It's been on market 42 days. Have you received any prior offers? Is the seller open to a 3% concession, seller financing, or rate buy-down credit?
- Built in 1910 — when were the roof, HVAC, electrical panel, plumbing, and water heater last replaced?
- Is there a deadline driving the sale (1031 exchange, divorce, estate, relocation)? That informs how much negotiation room exists.
- What's the average days-on-market for RENTAL listings here right now (not sales)? A rising rental-DOM trend means longer vacancies and softer asking-rent achievability than the comps imply.
- What's the recent tenant-quality profile in this submarket — average credit score on applications, eviction rate, late-payment / NSF rate, and stable-employment percentage? A property-management company in the area should have these aggregated.
- How much new for-sale + rental construction is in the pipeline within 1–3 miles? Heavy new supply typically softens prices + rents 12–24 months out; constrained supply supports both.
Investment metrics
- 1% rule
- 1.94% ✓
- Cap rate
- 16.95%
- Cash-on-cash
- 38.04%
- DSCR
- 2.69
- GRM
- 4.3
CMA / ARV
- ARV (on-the-fly)
- $73,786
- Comps found
- 12
Show comp detail 12 sales within ~0.75 mi
| Address | Dist | Beds/Ba | Sqft | Sold | Price | $/sf | Match |
|---|---|---|---|---|---|---|---|
| 504 E 17th St | 0.00mi | 2/1.0 | 990 (+6%) | 1mo | $45,000 | $45 | 89 |
| 1606 A Pleasant Plain N/A | 0.05mi | 2/1.0 | 864 (-8%) | 4mo | $69,900 | $81 | 82 |
| 207 E 21st St | 0.27mi | 2/1.0 | 1,014 (+9%) | 8mo | $69,900 | $69 | 66 |
| 1809 N Main St | 0.24mi | 2/1.0 | 1,008 (+8%) | 13mo | $79,900 | $79 | 65 |
| 1414 Cedar St | 0.32mi | 2/1.0 | 816 (-13%) | 4mo | $53,000 | $65 | 61 |
| 430 W 13th St | 0.52mi | 2/1.0 | 864 (-8%) | 4mo | $89,900 | $104 | 60 |
| 410 E 10th St | 0.47mi | 2/1.0 | 898 (-4%) | 16mo | $49,900 | $56 | 59 |
| 1611 Bolser St | 0.46mi | 3/2.0 (+1) | 1,056 (+13%) | 8mo | $89,900 | $85 | 41 |
| 707 E 8th St | 0.63mi | 2/1.0 | 1,067 (+14%) | 10mo | $59,900 | $56 | 39 |
| 140 E 7th St | 0.68mi | 2/1.5 | 1,056 (+13%) | 9mo | $65,000 | $62 | 37 |
| 169 E 7th St | 0.68mi | 2/1.0 | 1,068 (+14%) | 12mo | $124,900 | $117 | 35 |
| 802 W Crowder Rd | 0.67mi | 3/1.0 (+1) | 1,050 (+12%) | 10mo | $84,900 | $81 | 34 |
Match score weights: distance 35% · size 25% · config 20% · recency 20%. Top-matched comps best support the ARV.
Projected returns pro-forma
-3.0% appreciation · 3.0% rent growth · sell at horizon
- IRR
- 34.1%
- Equity multiple
- 2.44×
- Total profit
- $18,151
- Equity at exit
- $6,710
- IRR
- 41.0%
- Equity multiple
- 4.85×
- Total profit
- $48,569
- Equity at exit
- $3,891
Cash invested: $12,600 (down + closing). Projections, not guarantees.
Landlord ↔ Tenant lean methodology
- Overall (STATE)
- 81 Strongly Landlord-Friendly
- State Missouri
- 81 Strongly Landlord-Friendly · R+10
- County
- — inherits STATE
- City
- — inherits STATE
ZIP-level market 64683
- Home prices YoY
- -14.6%
- Active inventory
- 50
- Price-to-rent
- 4.3×
Monthly cashflow live
- Estimated rent
- $874 medium interval (Pro) →
- Mortgage (P&I)
- −$236
- Tax from tax record
- −$36 /mo · $435/yr
- Insurance
- −$19
- HOA
- −$0
- Vacancy / Maint / Mgmt
- −$184
- Net cashflow
- $399
Break-even live
UW: 25.0% down · 7.5% · 30yr · 1.5% tax · 5.0% vac · 8.0% maint · 8.0% mgmt
Financing live
Cash to close
- Down payment
- $11,250
- Closing costs
- $1,350
- Reserves months
- —
- Total cash needed
- —
Loan-product check · same deal, 3 products live
Conventional
25% down · 7.5% · 30yr
- Down + closing
- —
- Monthly P&I
- —
- Monthly cashflow
- —
- DSCR
- —
- Eligible?
- —
Personal DTI + credit; lowest rate.
DSCR
20% down · 8.5% · 30yr
- Down + closing
- —
- Monthly P&I
- —
- Monthly cashflow
- —
- DSCR
- —
- Eligible?
- —
No personal income docs; deal must DSCR.
Hard money
10% down · 12.0% · 12mo
- Down + closing
- —
- Monthly P&I
- —
- Monthly cashflow
- —
- DSCR
- —
- Eligible?
- —
Short-term bridge; refi at stabilization.
Listing history 5 events
-
2026-04-08status Pending
-
2026-04-02status Active
-
2026-04-02price $45,000
-
2026-02-26status Pending
-
2026-01-21$49,900 Active
ⓘ Source: listings_history table (triggers on properties + properties_extension) + one-shot
backfill from property_details.listing_events for pre-trigger history.
Tax reassessment forecast MO · Resets to sale price
- Current annual tax
- $435 · $36/mo
- Projected year-2 tax
- $436 · $36/mo
- Expected delta
- +$1/yr ($0/mo · 0.3%)
ⓘ Screening estimate from a state-policy table — verify with the county assessor before closing.
Climate risk First Street
- Flood 1/10 Low FEMA zone X (unshaded) · 0% chance over 30 yrs
- Wildfire 1/10 Low
- Heat 4/10 Moderate 7 d/yr ≥106°F today · 15 d/yr by 30 yrs out
- Wind 2/10 Low
- Air quality 2/10 Low 0 unhealthy d/yr today · 2 by 30 yrs out
Nearby sold comps map
Loading sold comps map…
Walkable amenities ~0.75 mi
Loading nearby amenities…
Taxation est. · year 1
- Rental income
- $10,488
- − Mortgage interest
- −$2,521
- − Property taxes
- −$435
- − Insurance
- −$225
- − Repairs & maintenance
- −$839
- − Management
- −$839
- − Depreciation
- −$1,309
- Taxable income
- $4,320
- Est. tax owed @ 24.0%
- −$1,037
- After-tax cash flow
- $3,757/yr
For passive investors: Depreciation is non-cash, so a rental often shows a tax loss while cash-flowing — sheltering income. Rental losses are passive: they offset passive income freely, and up to $25,000/yr can offset ordinary (W-2) income if you actively participate and your MAGI is under $100k (phasing out to $0 by $150k); unused losses carry forward. On sale, claimed depreciation is recaptured at up to 25%, and gains may owe capital-gains tax (a 1031 exchange can defer both). Figures are a year-1 estimate at your 24.0% rate — not tax advice; consult a CPA.
Schools (NCES district)
- District
- Trenton R-IX
- NCES district ID
- 2930360
- Math proficiency
- 28% ▼ -7.00%
- Reading proficiency
- 43% ▼ -4.00%
- Median HH income
- $37,586
- Composite
- 29.52/100
- National rank
- #6499
- State rank
- #223 of 324 in MO
Livability — Trenton
- Score
- 76/100
- State rank
- #49
- US rank
- #3686
Category grades
Schools grade is shown separately in the Schools card above.
Census & demographics
- Census place
- Trenton, MO
- City population
- 7,648
- Population (ZIP)
- 7,648
Population outlook (Grundy County) Hauer SSP2
- Today (2025)
- 9,586 people
- By 2030
- 9,298 · -3.0%
- By 2040
- 8,783 · -8.4%
- By 2050
- 8,262 · -13.8%
- By 2075
- 7,011 · -26.9%
- By 2100
- 5,650 · -41.1%
Race, ethnicity, and origin ACS 2023
- Neighborhood character
- Predominantly White (91%)
- Race & ethnicity
- White 91% Two or more races 5% Hispanic / Latino 3% Asian 1%
- Common ancestry
- Serbian 2% Portuguese 1% Slovak 1%
- Foreign-born
- 1% · China
- Languages at home
- 98% English-only · German/W. Germanic 1% Chinese 1% Spanish 1%
Political lean MEDSL · Grundy
- 2024 margin
- Solid R (+63.6) · D 17.8% · R 81.4%
- 2008→2024 swing
- -33.5pp toward R · 2008: -30.1pp · 2024: -63.6pp
- All cycles
- 2024: R+63.6 2020: R+62.8 2016: R+60.8 2012: R+41.6 2008: R+30.1
Not yet ingested
- Civics
- —
Market trends
- HPI YoY
- ▼ -32.24%
- Current HPI
- 188.2901
- Rent YoY
- —
- Metro
- —
- State GDP YoY
- ▲ 1.84%
- F500 in state
- 20
Industry mix (Fortune 500 HQ in MO)
| Industry | F500 HQs | Revenue |
|---|---|---|
| Healthcare | 1 | $163B |
|
||
| Insurance | 1 | $21B |
|
||
| Industrial Technology | 1 | $17B |
|
||
| Retail | 1 | $16B |
|
||
| Industrial Distribution | 1 | $10B |
|
||
| Utilities | 1 | $9B |
|
||
Price history
-9.8% since first listed5 events — show timeline
- 2026-04-08 Pending — Heartland MLS as Distributed by MLS Grid
- 2026-04-02 Relisted — Heartland MLS as Distributed by MLS Grid
- 2026-04-02 Price Changed $45,000 Heartland MLS as Distributed by MLS Grid
- 2026-02-26 Pending — Heartland MLS as Distributed by MLS Grid
- 2026-01-21 Listed $49,900 Heartland MLS as Distributed by MLS Grid
Property tax history
+6.2%/yrLatest (2025): $435 · +15.7% YoY. Source: county tax records.
Cash-flow waterfall
monthlySold comps — $/sqft
last 12 mo · ≤1 miLoading sold comps…