604 Lincoln St · Mansfield, LA
Flood risk 1/10 · Minimal
- FEMA flood zone
- X (unshaded)
- Chance of flooding over 30 yrs
- 0.0%
- Est. flood insurance / yr
- $507 – $1,088
Fire risk 4/10 · Minor
- Est. fire insurance / yr
- $1,269 – $2,357
Heat risk 7/10 · Major
- Hot days now (above 111°F)
- 7 days/yr
- Hot days in 30 yrs
- 20 days/yr
Wind risk 8/10 · Major
- Chance of severe wind over 30 yrs
- 80.0%
Air-quality risk 1/10 · Minimal
- Unhealthy air days now
- 0 days/yr
- Unhealthy air days in 30 yrs
- 0 days/yr
Risk factors via First Street. Map © Google.
Why this score? — see what drove the F grade
The composite is a weighted blend of 9 inputs, each scored 0–100. Each bar is that input's sub-score; the figure is the points it added to the 100-point composite (weight × sub-score).
- Appreciation +10.0/10.0
- Cash flow +8.8/30.0
- Schools +3.5/10.0
- Livability +3.2/5.0
- Rent growth +2.5/5.0
- Condition / age +2.5/5.0
- DSCR +2.4/10.0
- 1% rule +1.6/10.0
- ARV discount +0.0/15.0
$165,000
🖨 Deal sheet (PDF) 📄 Offer letter ✓ Due diligence
Listing remarks
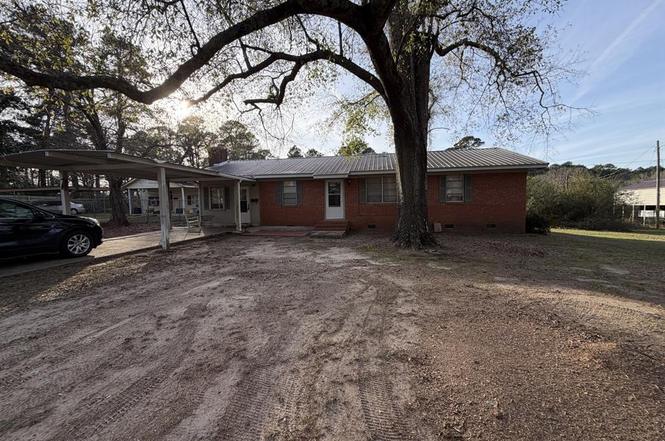
Cottage style home on large 2 acre lot. .. .the back yard lots are grown up. Home has some new carpet. .. .and has appliances. Great for the first time home buyer. All city utilities and is close to churches, shopping, and schools. Appointments are necessary with this home. Seller is reserving mineral rights. Home has a metal roof.
Key facts
- Metal roof
- New carpet
- Appliances
Tags
Neighborhood map
What this means for you Summary
Snapshot
- This is a 3-bed/1.5-bath single-family listed at $165k.
Deal economics
- At list price, monthly cash flow is $-135 ($-2k/yr) — negative.
- To cash-flow at today's rent, offer at most $141k (14.5% below list).
- To meet the 1% rule (rent ≥ 1% of price), the offer needs to be $109k (33.9% below list).
- Recommended offer: $109k (33.9% below list) — sets the bar for 1% rule.
Location & tenants
- Location reads 65/100 on livability (#148 in LA) — a middle-class / working-renter tenant base. Strengths: cost of living A+, housing A-, health & safety A-; Watch: crime F, amenities F, commute F.
- Desoto Parish (rural): math 35% / reading 48% proficiency, ranked #21 of 98 in LA (top 21%) — families likely to look elsewhere, expect single-tenant / working-renter base with shorter leases.
- Zoned schools: Mansfield Elementary School (math 22% / reading 37%, grade F, #333 of 646 statewide, top 54%, 570 students, 78% FRL); Mansfield Middle School (math 12% / reading 34%, grade F, #145 of 218 statewide, top 69%, 382 students, 82% FRL); Mansfield High School (math 22% / reading 32%, grade F, #136 of 265 statewide, top 55%, 376 students, 79% FRL) — zoned schools average 80% FRL vs 59% district-wide (21 pts higher); higher-poverty schools than district average — tighter screening recommended.
- Zoned-school proficiency averages 26% at this address vs 42% district-wide (-15 pts) — the specific schools serving this property underperform the Desoto Parish average; the district grade overstates school quality for this exact location.
- Market conditions: 29 active listings in the ZIP; 113 units permitted in De Soto Parish in 2024 (0 in 5+ unit buildings).
Forward outlook
- In year one you build about $18k of equity ($1k loan paydown + $16k appreciation (10.0% local appreciation)).
- De Soto County population projected at +8% by 2050 — modest demand growth; plan on rents tracking national, not racing it.
- By year 3, paydown + projected appreciation supports a ~$45k cash-out refi (75% LTV) — recoverable capital for the next deal without selling this one.
Negotiation context
- It's been on market 66 days — a 6% lower offer ($155k) is reasonable based on typical stale-listing flexibility.
Risks & watch-outs
- Climate carrying-cost: severe wind risk, 80% chance of damaging wind over 30y; extreme-heat days projected 7→20/yr by 2055 (HVAC capex compounding) — expect insurance premiums to compound above CPI over the hold.
Questions for the listing agent
- What do current leases actually rent for vs. the listed asking? Can we see a recent rent roll and the last 12 months of T-12 income?
- It's been on market 66 days. Have you received any prior offers? Is the seller open to a 34% concession, seller financing, or rate buy-down credit?
- Built in 1962 — when were the roof, HVAC, electrical panel, plumbing, and water heater last replaced?
- Why hasn't it sold? Are there any deal-killer items the seller is aware of (foundation, flood, title, zoning, code violations)?
- Is there a deadline driving the sale (1031 exchange, divorce, estate, relocation)? That informs how much negotiation room exists.
- Crime grade is F in this area — have there been break-ins, vandalism, or insurance claims at this property in the last 3 years? What carrier currently insures it and at what premium?
- The area grade is low — what's the realistic commute time and amenity access for the typical tenant pool here? Any planned neighborhood developments (good or bad) we should know about?
- What's the average days-on-market for RENTAL listings here right now (not sales)? A rising rental-DOM trend means longer vacancies and softer asking-rent achievability than the comps imply.
- What's the recent tenant-quality profile in this submarket — average credit score on applications, eviction rate, late-payment / NSF rate, and stable-employment percentage? A property-management company in the area should have these aggregated.
- How much new for-sale + rental construction is in the pipeline within 1–3 miles? Heavy new supply typically softens prices + rents 12–24 months out; constrained supply supports both.
Investment metrics
- 1% rule
- 0.66% ✗
- Cap rate
- 5.31%
- Cash-on-cash
- -3.51%
- DSCR
- 0.84
- GRM
- 12.6
CMA / ARV
- ARV (on-the-fly)
- $129,600
- Comps found
- 4
Show comp detail 4 sales within ~0.75 mi
| Address | Dist | Beds/Ba | Sqft | Sold | Price | $/sf | Match |
|---|---|---|---|---|---|---|---|
| 604 Lincoln St | 0.00mi | 3/1.5 | 1,350 (0%) | 0mo | $165,000 | $122 | 100 |
| 163 Richardson Ln | 0.34mi | 3/2.0 | 1,400 (+4%) | 12mo | $19,900 | $14 | 66 |
| 195 Railroad Ave | 0.47mi | 3/1.0 | 1,200 (-11%) | 15mo | $115,000 | $96 | 45 |
| 313 Martha Ave | 0.64mi | 2/2.0 (-1) | 1,265 (-6%) | 22mo | $63,000 | $50 | 35 |
Match score weights: distance 35% · size 25% · config 20% · recency 20%. Top-matched comps best support the ARV.
Projected returns pro-forma
10.0% appreciation · 3.0% rent growth · sell at horizon
- IRR
- 21.8%
- Equity multiple
- 2.76×
- Total profit
- $81,181
- Equity at exit
- $148,645
- IRR
- 19.6%
- Equity multiple
- 6.32×
- Total profit
- $245,695
- Equity at exit
- $320,559
Cash invested: $46,200 (down + closing). Projections, not guarantees.
Landlord ↔ Tenant lean methodology
- Overall (STATE)
- 90 Strongly Landlord-Friendly
- State Louisiana
- 90 Strongly Landlord-Friendly · R+12
- County
- — inherits STATE
- City
- — inherits STATE
ZIP-level market 71052
- Active inventory
- 29
- Price-to-rent
- 12.6×
Monthly cashflow live
- Estimated rent
- $1,091 medium interval (Pro) →
- Mortgage (P&I)
- −$865
- Tax from tax record
- −$63 /mo · $755/yr
- Insurance
- −$69
- HOA
- −$0
- Vacancy / Maint / Mgmt
- −$229
- Net cashflow
- $-135
Break-even live
Sensitivity live
| Price | -10% $-42 | -5% $-88 | +0% $-135 | +5% $-182 | +10% $-229 |
|---|---|---|---|---|---|
| Rent | -10% $-221 | -5% $-178 | +0% $-135 | +5% $-92 | +10% $-49 |
| Rate | -1.0pp $-52 | -0.5pp $-93 | base $-135 | +0.5pp $-178 | +1.0pp $-221 |
UW: 25.0% down · 7.5% · 30yr · 1.5% tax · 5.0% vac · 8.0% maint · 8.0% mgmt
Financing live
Cash to close
- Down payment
- $41,250
- Closing costs
- $4,950
- Reserves months
- —
- Total cash needed
- —
Loan-product check · same deal, 3 products live
Conventional
25% down · 7.5% · 30yr
- Down + closing
- —
- Monthly P&I
- —
- Monthly cashflow
- —
- DSCR
- —
- Eligible?
- —
Personal DTI + credit; lowest rate.
DSCR
20% down · 8.5% · 30yr
- Down + closing
- —
- Monthly P&I
- —
- Monthly cashflow
- —
- DSCR
- —
- Eligible?
- —
No personal income docs; deal must DSCR.
Hard money
10% down · 12.0% · 12mo
- Down + closing
- —
- Monthly P&I
- —
- Monthly cashflow
- —
- DSCR
- —
- Eligible?
- —
Short-term bridge; refi at stabilization.
Listing history 2 events
-
2026-04-17status Pending
-
2026-02-10$165,000 Active
ⓘ Source: listings_history table (triggers on properties + properties_extension) + one-shot
backfill from property_details.listing_events for pre-trigger history.
Tax reassessment forecast LA · Resets to sale price
- Current annual tax
- $755 · $63/mo
- Projected year-2 tax
- $908 · $76/mo
- Expected delta
- +$153/yr (+$13/mo · 20.2%)
ⓘ Screening estimate from a state-policy table — verify with the county assessor before closing.
Climate risk First Street
- Flood 1/10 Low FEMA zone X (unshaded) · 0% chance over 30 yrs
- Wildfire 4/10 Moderate
- Heat 7/10 Severe 7 d/yr ≥111°F today · 20 d/yr by 30 yrs out
- Wind 8/10 Severe 80% chance of damaging wind over 30 yrs
- Air quality 1/10 Low 0 unhealthy d/yr today · 0 by 30 yrs out
Nearby sold comps map
Loading sold comps map…
Walkable amenities ~0.75 mi
Loading nearby amenities…
Taxation est. · year 1
- Rental income
- $13,090
- − Mortgage interest
- −$9,243
- − Property taxes
- −$755
- − Insurance
- −$825
- − Repairs & maintenance
- −$1,047
- − Management
- −$1,047
- − Depreciation
- −$4,800
- Taxable loss
- −$4,627
- Est. tax savings @ 24.0%
- +$1,110
- After-tax cash flow
- $-512/yr
For passive investors: Depreciation is non-cash, so a rental often shows a tax loss while cash-flowing — sheltering income. Rental losses are passive: they offset passive income freely, and up to $25,000/yr can offset ordinary (W-2) income if you actively participate and your MAGI is under $100k (phasing out to $0 by $150k); unused losses carry forward. On sale, claimed depreciation is recaptured at up to 25%, and gains may owe capital-gains tax (a 1031 exchange can defer both). Figures are a year-1 estimate at your 24.0% rate — not tax advice; consult a CPA.
Schools (NCES district)
- District
- Desoto Parish
- NCES district ID
- 2200510
- Math proficiency
- 35% ▼ -37.00%
- Reading proficiency
- 48% ▼ -31.00%
- Median HH income
- $40,201
- Composite
- 34.75/100
- National rank
- #5130
- State rank
- #21 of 98 in LA
Livability — Mansfield
- Score
- 65/100
- State rank
- #148
- US rank
- #12840
Category grades
Schools grade is shown separately in the Schools card above.
Census & demographics
- Census place
- Mansfield, LA
- Population (ZIP)
- 8,827
Population outlook (De Soto County) Hauer SSP2
- Today (2025)
- 28,142 people
- By 2030
- 28,546 · +1.4%
- By 2040
- 29,357 · +4.3%
- By 2050
- 30,239 · +7.5%
- By 2075
- 33,412 · +18.7%
- By 2100
- 35,428 · +25.9%
Race, ethnicity, and origin ACS 2023
- Neighborhood character
- Predominantly Black (70%)
- Race & ethnicity
- Black 70% White 26% Two or more races 3%
- Common ancestry
- Romanian 1% Hispanic 1% Serbian 0%
- Foreign-born
- 1% · Vietnam
- Languages at home
- 99% English-only · Vietnamese 1%
Political lean MEDSL · De Soto
- 2024 margin
- Solid R (+35.5) · D 31.8% · R 67.3%
- 2008→2024 swing
- -22.1pp toward R · 2008: -13.4pp · 2024: -35.5pp
- All cycles
- 2024: R+35.5 2020: R+24.8 2016: R+21.5 2012: R+13.8 2008: R+13.4
Not yet ingested
- Civics
- —
Market trends
- HPI YoY
- ▲ 63.44%
- Current HPI
- 241.27
- Rent YoY
- —
- Metro
- —
- State GDP YoY
- ▲ 3.29%
- F500 in state
- 10
Industry mix (Fortune 500 HQ in LA)
| Industry | F500 HQs | Revenue |
|---|---|---|
| Telecommunications | 2 | $23B |
|
||
| Utilities | 1 | $12B |
|
||
| Wholesale / Distribution | 1 | $5B |
|
||
| Advertising | 1 | $2B |
|
||
Price history
2 events — show timeline
- 2026-04-17 Pending — NTREIS
- 2026-02-10 Listed $165,000 NTREIS
Property tax history
+3.2%/yrLatest (2025): $755 · -0.8% YoY. Source: county tax records.
Cash-flow waterfall
monthlySold comps — $/sqft
last 12 mo · ≤1 miLoading sold comps…