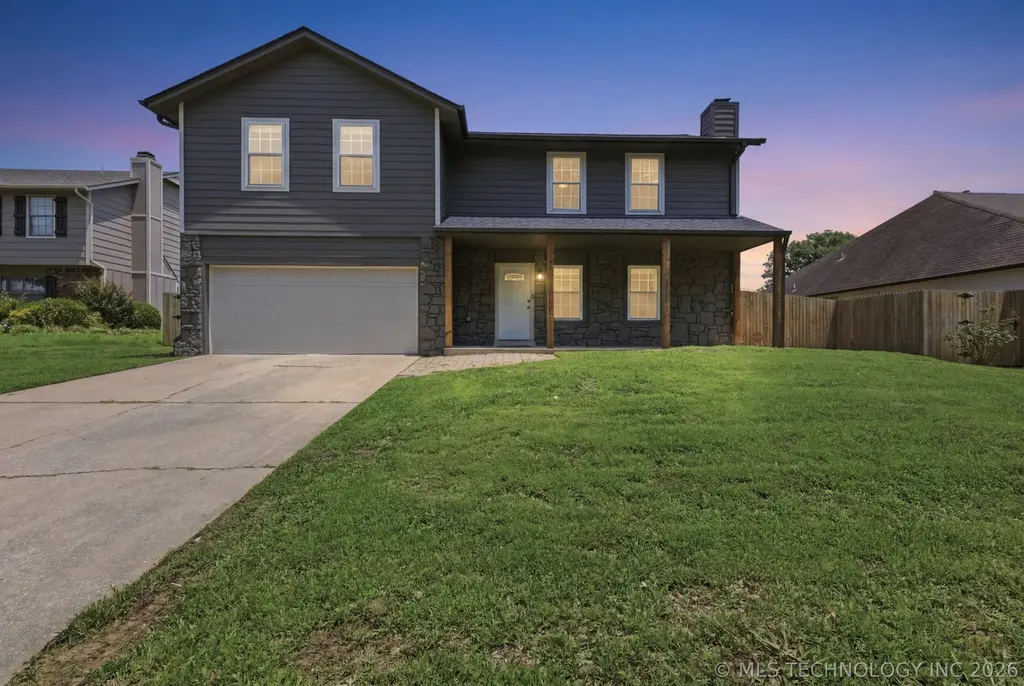
4901 S Narcissus Ave · Broken Arrow, OK
Flood risk 1/10 · Minimal
- FEMA flood zone
- X (unshaded)
- Chance of flooding over 30 yrs
- 0.0%
- Est. flood insurance / yr
- $473 – $860
Fire risk 4/10 · Minor
- Est. fire insurance / yr
- $2,463 – $4,575
Heat risk 7/10 · Major
- Hot days now (above 111°F)
- 7 days/yr
- Hot days in 30 yrs
- 18 days/yr
Wind risk 3/10 · Minor
- Chance of severe wind over 30 yrs
- 4.0%
Air-quality risk 2/10 · Minimal
- Unhealthy air days now
- 1 days/yr
- Unhealthy air days in 30 yrs
- 1 days/yr
Risk factors via First Street. Map © Google.
Why this score? — see what drove the D+ grade
The composite is a weighted blend of 9 inputs, each scored 0–100. Each bar is that input's sub-score; the figure is the points it added to the 100-point composite (weight × sub-score).
- Cash flow +19.1/30.0
- ARV discount +6.1/15.0
- DSCR +6.0/10.0
- 1% rule +4.5/10.0
- Livability +3.9/5.0
- Rent growth +3.5/5.0
- Condition / age +2.5/5.0
- Schools +2.4/10.0
- Appreciation +0.0/10.0
$315,000
🖨 Deal sheet 📄 Offer letter ✓ Due diligence
Listing remarks MLS
Ready to move in updated throughout. New Kitchen Cabinets with Granite counters, slate tile floor. Master bath has whirlpool & separate shower. New AC 08, Roof 2011, windows 2012, and much more. Office can be formal Dining; 4th BR can be large game room.
Key facts
- Pantry
- Newer appliances
- Double ovens
Tags
Property features AI
Exterior
- Parking: Attached garage with 2 parking spaces
- Security: No safety shelter
- Utilities: Electricity available; Natural gas available; Public water; Public sewer
- Home design: Two-story home; Slab foundation
- Construction: Built per public records; Masonite, stone, and wood frame construction; Asphalt/fiberglass roof
- Exterior features: Covered patio and porch; Porch; Shed(s); Full privacy fencing; Mature trees on the lot; Faces west
Interior
- Kitchen: Cooktop; Double oven; Oven; Range; Microwave; Dishwasher; Disposal; Refrigerator; Plumbed for ice maker; Granite counters
- Bedrooms: Primary bedroom with private bath and walk-in closet (second level); Additional bedroom with walk-in closet (second level); Two more bedrooms (second level); Bedrooms located on the second level
- Flooring: Carpet; Tile; Wood
- Bathrooms: Primary bathroom with separate shower, bathtub, double sink and whirlpool (second level); Hall full bathroom (second level); Half bathroom
- Heating & cooling: Central heating (gas); Central air conditioning
- Interior features: Attic; Granite counters; Ceiling fan(s); Gas range connection; Vinyl window frames
- Laundry & utility: Washer hookup; Dryer; Utility room located on the first level; Gas water heater
Neighborhood map
What this means for you Summary
Snapshot
- This is a 4-bed/2.5-bath single-family listed at $315k.
Deal economics
- At list price, monthly cash flow is $334 ($4k/yr) — positive.
- The deal already cash-flows at list — no discount required.
- To meet the 1% rule (rent ≥ 1% of price), the offer needs to be $299k (5.0% below list).
- Recommended offer: $299k (5.0% below list) — sets the bar for 1% rule.
- Cap rate 7.6% vs local median 4.0% in Broken Arrow — top-decile yield for the area; either an underpriced asset or a hidden risk that comps aren't pricing in. Stress-test before assuming the spread holds.
Location & tenants
- Location reads 78/100 on livability (#7 in OK, #2,691 nationally) — a middle-class / working-renter tenant base. Strengths: commute A+, cost of living A+, housing A+; Watch: schools D+, amenities F.
- Broken Arrow (suburban): math 23% / reading 28% proficiency, ranked #79 of 270 in OK (top 29%) — low school quality limits family demand, transient renter base, plan for 1-2y turnover.
- Market conditions: Rents rising fast (+4.1%/yr); 381 active listings in the ZIP; 3 comparable units currently listed for rent nearby; rentals at typical pace (median 19d on market — plan ~3-4 weeks tenant-placement turnaround); solid renter incomes; 2,818 units permitted in Tulsa County in 2024 (518 in 5+ unit buildings).
- This rent runs 36% of the median local income ($99k/yr) — at the standard rent-burdened threshold; future hikes will face affordability resistance.
Forward outlook
- Local home prices are declining (-3.0%/yr); year-one equity from $2k of loan paydown is wiped out by about $9k of value loss. Plan a longer hold.
- Tulsa County population projected at +30% by 2050 — long-run rental-demand tailwind backs the buy-and-hold thesis.
Negotiation context
- Only 14 days on market — expect competitive offers; lowballing is unlikely to land.
- 6 sale attempts since 36y ago with the ask held roughly flat each time — persistent listings suggest the price (not the market) is what's stuck; bring a comps-based counter.
Risks & watch-outs
- Climate carrying-cost: extreme-heat days projected 7→18/yr by 2055 (HVAC capex compounding) — expect insurance premiums to compound above CPI over the hold.
Questions for the listing agent
- Is there a deadline driving the sale (1031 exchange, divorce, estate, relocation)? That informs how much negotiation room exists.
- Schools are D-rated, which usually means shorter tenancies and higher turnover. Who's the typical renter profile here, and what's been the actual vacancy rate?
- The area grade is low — what's the realistic commute time and amenity access for the typical tenant pool here? Any planned neighborhood developments (good or bad) we should know about?
- What's the average days-on-market for RENTAL listings here right now (not sales)? A rising rental-DOM trend means longer vacancies and softer asking-rent achievability than the comps imply.
- What's the recent tenant-quality profile in this submarket — average credit score on applications, eviction rate, late-payment / NSF rate, and stable-employment percentage? A property-management company in the area should have these aggregated.
- How much new for-sale + rental construction is in the pipeline within 1–3 miles? Heavy new supply typically softens prices + rents 12–24 months out; constrained supply supports both.
Investment metrics
- 1% rule
- 0.95% ✗
- Cap rate
- 7.57%
- Cash-on-cash
- 4.55%
- DSCR
- 1.20
- GRM
- 8.8
CMA / ARV
- ARV (on-the-fly)
- $305,240
- Comps found
- 12
Show comp detail 12 sales within ~0.75 mi
| Address | Dist | Beds/Ba | Sqft | Sold | Price | $/sf | Match |
|---|---|---|---|---|---|---|---|
| 1817 W Inglewood St | 0.26mi | 3/2.5 (-1) | 2,370 (+1%) | 2mo | $279,900 | $118 | 80 |
| 1808 W Inglewood St W | 0.22mi | 4/2.5 | 2,497 (+6%) | 0mo | $300,000 | $120 | 79 |
| 1701 W Inglewood St | 0.21mi | 4/2.5 | 2,190 (-7%) | 1mo | $229,000 | $105 | 78 |
| 5309 S Maple Pl | 0.35mi | 5/2.5 (+1) | 2,471 (+5%) | 4mo | $290,000 | $117 | 67 |
| 5400 S Poplar Ave | 0.41mi | 5/2.5 (+1) | 2,453 (+4%) | 2mo | $325,000 | $132 | 67 |
| 4632 S Chestnut Ave | 0.66mi | 4/3.0 | 2,280 (-3%) | 1mo | $338,000 | $148 | 62 |
| 4009 S Maple Ave | 0.73mi | 4/2.5 | 2,300 (-2%) | 2mo | $270,000 | $117 | 61 |
| 4120 S Maple Ave E | 0.60mi | 4/2.5 | 2,201 (-6%) | 5mo | $300,000 | $136 | 58 |
| 825 W Waco St | 0.56mi | 4/2.0 | 2,146 (-9%) | 1mo | $279,000 | $130 | 56 |
| 4212 S Oak Ave | 0.62mi | 4/2.0 | 2,120 (-10%) | 3mo | $319,000 | $150 | 51 |
| 2410 W Charleston St | 0.66mi | 4/2.5 | 2,582 (+10%) | 6mo | $420,000 | $163 | 48 |
| 4008 S Lions Ave | 0.73mi | 4/3.0 | 2,598 (+11%) | 6mo | $275,000 | $106 | 41 |
Match score weights: distance 35% · size 25% · config 20% · recency 20%. Top-matched comps best support the ARV.
Projected returns pro-forma
-3.0% appreciation · 4.09% rent growth · sell at horizon
- IRR
- -8.1%
- Equity multiple
- 0.70×
- Total profit
- $-26,472
- Equity at exit
- $46,968
- IRR
- 2.7%
- Equity multiple
- 1.21×
- Total profit
- $18,110
- Equity at exit
- $27,235
Cash invested: $88,200 (down + closing). Projections, not guarantees.
Landlord ↔ Tenant lean methodology
- Overall (STATE)
- 83 Strongly Landlord-Friendly
- State Oklahoma
- 83 Strongly Landlord-Friendly · R+20
- County
- — inherits STATE
- City
- — inherits STATE
ZIP-level market 74011
- Rents YoY
- 4.1%
- Active inventory
- 381
- Price-to-rent
- 8.8×
Monthly cashflow live
- Estimated rent
- $2,993 medium interval (Pro) →
- Mortgage (P&I)
- −$1,652
- Tax from tax record
- −$247 /mo · $2,961/yr
- Insurance
- −$131
- HOA
- −$0
- Vacancy / Maint / Mgmt
- −$628
- Net cashflow
- $334
Break-even live
UW: 25.0% down · 7.5% · 30yr · 1.5% tax · 5.0% vac · 8.0% maint · 8.0% mgmt
Financing live
Cash to close
- Down payment
- $78,750
- Closing costs
- $9,450
- Reserves months
- —
- Total cash needed
- —
Loan-product check · same deal, 3 products live
Conventional
25% down · 7.5% · 30yr
- Down + closing
- —
- Monthly P&I
- —
- Monthly cashflow
- —
- DSCR
- —
- Eligible?
- —
Personal DTI + credit; lowest rate.
DSCR
20% down · 8.5% · 30yr
- Down + closing
- —
- Monthly P&I
- —
- Monthly cashflow
- —
- DSCR
- —
- Eligible?
- —
No personal income docs; deal must DSCR.
Hard money
10% down · 12.0% · 12mo
- Down + closing
- —
- Monthly P&I
- —
- Monthly cashflow
- —
- DSCR
- —
- Eligible?
- —
Short-term bridge; refi at stabilization.
Rent comps 3 comps
| Address | Beds | Baths | Sqft | Rent | $/sqft | DOM | Units | Dist |
|---|---|---|---|---|---|---|---|---|
| 4623 S Chestnut Ave Broken Arrow, OK | 4.0 | 3.0 | 2023 | $3,800 | $1.88 | 19d | 1 | 0.61mi |
| 4308 S Walnut Ave Broken Arrow, OK | 3.0 | 2.5 | 2659 | $2,400 | $0.90 | 23d | 1 | 0.65mi |
| 6308 S 1st Pl Broken Arrow, OK | 3.0 | 2.0 | 1600 | $3,400 | $2.12 | 15d | 1 | 1.30mi |
Listing history 11 events
-
2026-06-18days on market $315,000 Active 14 DOM
-
2026-06-17days on market $315,000 Active 13 DOM
-
2026-06-16days on market $315,000 Active 12 DOM
-
2026-06-15days on market $315,000 Active 11 DOM
-
2026-06-13days on market $315,000 Active 9 DOM
-
2026-06-10days on market $315,000 Active 6 DOM
-
2026-06-09days on market $315,000 Active 5 DOM
-
2026-06-08days on market $315,000 Active 4 DOM
-
2026-06-07days on market $315,000 Active 3 DOM
-
2026-06-05remarks 577-char remark
-
2026-06-05$315,000 Active 1 DOM
ⓘ Source: listings_history table (triggers on properties + properties_extension) + one-shot
backfill from property_details.listing_events for pre-trigger history.
Tax reassessment forecast OK · Resets to sale price
- Current annual tax
- $2,961 · $247/mo
- Projected year-2 tax
- $2,961 · $247/mo
- Expected delta
- $0/yr ($0/mo · 0.0%)
ⓘ Screening estimate from a state-policy table — verify with the county assessor before closing.
Climate risk First Street
- Flood 1/10 Low FEMA zone X (unshaded) · 0% chance over 30 yrs
- Wildfire 4/10 Moderate
- Heat 7/10 Severe 7 d/yr ≥111°F today · 18 d/yr by 30 yrs out
- Wind 3/10 Moderate 4% chance of damaging wind over 30 yrs
- Air quality 2/10 Low 1 unhealthy d/yr today · 1 by 30 yrs out
Nearby sold comps map
Loading sold comps map…
Walkable amenities ~0.75 mi
Loading nearby amenities…
Taxation est. · year 1
- Rental income
- $35,913
- − Mortgage interest
- −$17,645
- − Property taxes
- −$2,961
- − Insurance
- −$1,575
- − Repairs & maintenance
- −$2,873
- − Management
- −$2,873
- − Depreciation
- −$9,164
- Taxable loss
- −$1,177
- Est. tax savings @ 24.0%
- +$283
- After-tax cash flow
- $4,295/yr
For passive investors: Depreciation is non-cash, so a rental often shows a tax loss while cash-flowing — sheltering income. Rental losses are passive: they offset passive income freely, and up to $25,000/yr can offset ordinary (W-2) income if you actively participate and your MAGI is under $100k (phasing out to $0 by $150k); unused losses carry forward. On sale, claimed depreciation is recaptured at up to 25%, and gains may owe capital-gains tax (a 1031 exchange can defer both). Figures are a year-1 estimate at your 24.0% rate — not tax advice; consult a CPA.
Schools (NCES district)
- District
- Broken Arrow
- NCES district ID
- 4005490
- Math proficiency
- 23% ▼ -9.00%
- Reading proficiency
- 28% ▼ -9.00%
- Median HH income
- $64,646
- Composite
- 23.86/100
- National rank
- #7801
- State rank
- #79 of 270 in OK
Livability — Broken Arrow
- Score
- 78/100
- State rank
- #7
- US rank
- #2691
Category grades
Schools grade is shown separately in the Schools card above.
Census & demographics
- Census place
- Broken Arrow, OK
- County
- Tulsa County · 640,811 people
- City population
- 144,172
- Metro
- Tulsa, OK
- Population (ZIP)
- 33,900
- Household income
- $99,157
- Rent vs Own
- Severe rent burden
- 389.0
Population outlook (Tulsa County) Hauer SSP2
- Today (2025)
- 723,846 people
- By 2030
- 766,033 · +5.8%
- By 2040
- 851,386 · +17.6%
- By 2050
- 938,389 · +29.6%
- By 2075
- 1,166,011 · +61.1%
- By 2100
- 1,350,277 · +86.5%
Race, ethnicity, and origin ACS 2023
- Neighborhood character
- Predominantly White (68%)
- Race & ethnicity
- White 68% Two or more races 15% Hispanic / Latino 10% Native American 4% Black 4% Asian 3%
- Hispanic origin (detail)
- Mexican 7%
- Common ancestry
- Lithuanian 3% Serbian 2% Slovak 2%
- Foreign-born
- 5% · Canada
- Languages at home
- 93% English-only · Spanish 5% Other Asian/Pacific 1%
Political lean MEDSL · Tulsa
- 2024 margin
- R (+15.2) · D 41.3% · R 56.5% · Other 2.2%
- 2008→2024 swing
- +9.2pp toward D · 2008: -24.5pp · 2024: -15.2pp
- All cycles
- 2024: R+15.2 2020: R+15.6 2016: R+22.9 2012: R+27.4 2008: R+24.5
Not yet ingested
- Civics
- —
Market trends
- HPI YoY
- ▼ -180.15%
- Current HPI
- 210.8302
- Rent YoY
- ▲ 4.09%
- Metro
- Tulsa, OK
- State GDP YoY
- ▲ 1.55%
- F500 in state
- 6
Industry mix (Fortune 500 HQ in OK)
| Industry | F500 HQs | Revenue |
|---|---|---|
| Energy | 3 | $48B |
|
||
Price history
+240.5% since first listed20 events — show timeline
- 2026-06-04 Listed $315,000 MLS Technology, Inc.
- 2025-12-29 Sold (Public Records) $315,000 Public Records
- 2017-12-23 Listing Removed — MLS Technology, Inc.
- 2017-11-10 Price Changed $179,500 MLS Technology, Inc.
- 2017-10-27 Price Changed $183,000 MLS Technology, Inc.
- 2017-08-11 Price Changed $184,000 MLS Technology, Inc.
- 2017-06-23 Listed $185,000 MLS Technology, Inc.
- 2014-02-18 Sold (Public Records) $163,000 Public Records
- 2014-02-12 Sold (MLS) $163,000 MLS Technology, Inc.
- 2014-01-07 Listing Removed — MLS Technology, Inc.
- 2013-10-28 Listed $163,000 MLS Technology, Inc.
- 2006-12-13 Sold (Public Records) $118,000 Public Records
- 2006-12-11 Sold (MLS) $118,000 MLS Technology, Inc.
- 2006-11-28 Listing Removed — MLS Technology, Inc.
- 2006-10-23 Listed $119,900 MLS Technology, Inc.
- 2001-10-30 Sold (Public Records) $130,000 Public Records
- 1992-12-20 Listing Removed — MLS Technology, Inc.
- 1992-06-20 Listed $97,000 MLS Technology, Inc.
- 1991-07-01 Sold (Public Records) $90,000 Public Records
- 1990-11-19 Listed $92,500 MLS Technology, Inc.
Property tax history
+5.9%/yrLatest (2025): $2,961 · +4.9% YoY. Source: county tax records.
Cash-flow waterfall
monthlySold comps — $/sqft
last 12 mo · ≤1 miLoading sold comps…