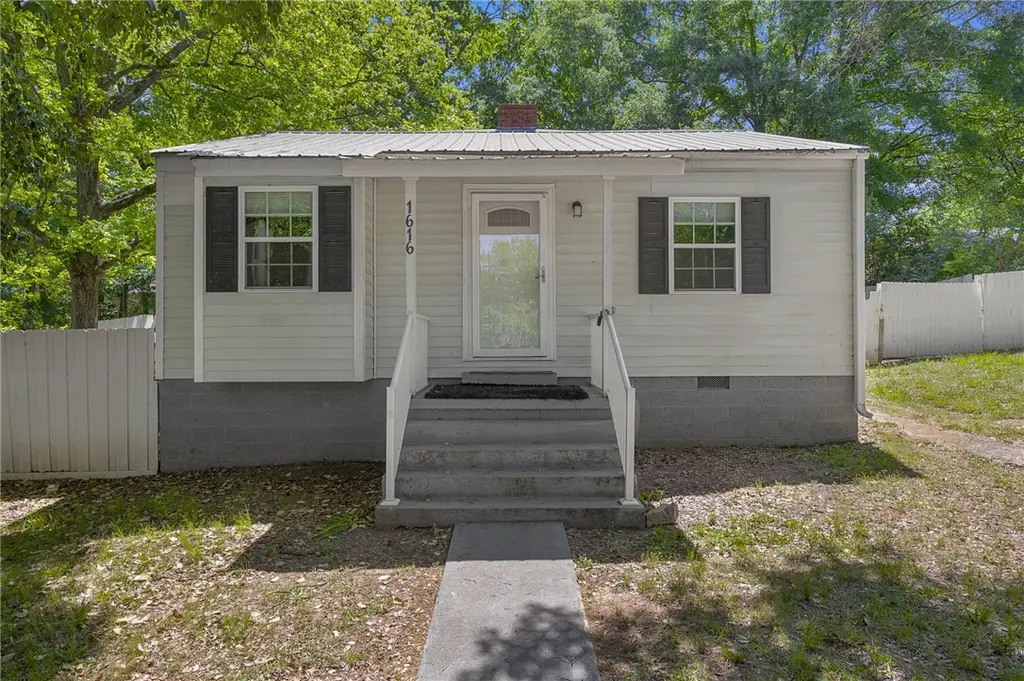
1616 Meadowbrook Cir · Anderson, SC
Flood risk 1/10 · Minimal
- FEMA flood zone
- X (unshaded)
- Chance of flooding over 30 yrs
- 0.0%
- Est. flood insurance / yr
- $507 – $1,088
Fire risk 2/10 · Minimal
- Est. fire insurance / yr
- $783 – $1,453
Heat risk 6/10 · Moderate
- Hot days now (above 105°F)
- 7 days/yr
- Hot days in 30 yrs
- 16 days/yr
Wind risk 3/10 · Minor
- Chance of severe wind over 30 yrs
- 5.0%
Air-quality risk 4/10 · Minor
- Unhealthy air days now
- 3 days/yr
- Unhealthy air days in 30 yrs
- 5 days/yr
Risk factors via First Street. Map © Google.
Why this score? — see what drove the C grade
The composite is a weighted blend of 9 inputs, each scored 0–100. Each bar is that input's sub-score; the figure is the points it added to the 100-point composite (weight × sub-score).
- Cash flow +21.1/30.0
- ARV discount +7.5/15.0
- DSCR +6.7/10.0
- 1% rule +5.6/10.0
- Appreciation +4.0/10.0
- Schools +3.9/10.0
- Livability +3.4/5.0
- Rent growth +2.5/5.0
- Condition / age +2.5/5.0
$124,900
🖨 Deal sheet 📄 Offer letter ✓ Due diligence
Listing remarks
Turnkey and ready to go! This 2-bedroom, 1-bath home at 1616 Meadowbrook Circle is a solid opportunity for a first-time buyer or anyone looking to expand their investment portfolio. Featuring a practical layout and easy upkeep, this property is ideal for low-maintenance living. Conveniently located near shopping, dining, and everyday essentials, it’s a smart choice for both homeowners and investors alike.
Key facts
- Listed 49 days
Property features AI
Finance
- HOA & community: Short-term rentals allowed
Exterior
- Utilities: Public water; Public sewer
- Home design: Single-story; Built over 50 years ago; Metal roof; Vinyl siding; Crawlspace foundation
- Construction: Vinyl siding construction; Metal roof; Crawlspace foundation; Over 50 years old
- Exterior features: Yard fenced; Fence; Trees on lot; Not in a subdivision; Outside city limits
Interior
- Kitchen: Electric oven; Electric range; Kitchen dimensions: 10x16
- Bedrooms: 2 main-level bedrooms; Bedroom dimensions: 11x11, 11x11
- Flooring: Laminate
- Bathrooms: 1 full bathroom (main level)
- Heating & cooling: Electric heating; Zoned cooling
- Interior features: Crawl space basement; Laminate flooring
Neighborhood map
What this means for you Summary
Snapshot
- This is a 2-bed/1.0-bath other listed at $125k.
Deal economics
- At list price, monthly cash flow is $178 ($2k/yr) — positive.
- The deal already cash-flows at list — no discount required.
- Meets the 1% rule at list price ($1k rent vs $125k).
- Recommended offer: $121k (3.0% below list) — sets the bar for market timing.
- Cap rate 8.0% vs local median 3.3% in Anderson — top-decile yield for the area; either an underpriced asset or a hidden risk that comps aren't pricing in. Stress-test before assuming the spread holds.
Location & tenants
- Location reads 67/100 on livability (#98 in SC) — a middle-class / working-renter tenant base. Strengths: cost of living A+, health & safety A+, housing B+; Watch: amenities C-, schools D+, crime F.
- Anderson 05 (suburban): math 44% / reading 49% proficiency, ranked #20 of 80 in SC (top 25%) — families likely to look elsewhere, expect single-tenant / working-renter base with shorter leases.
- Market conditions: 114 active listings in the ZIP; 2 comparable units currently listed for rent nearby; lower-income renter base — watch delinquency; 1,255 units permitted in Anderson County in 2024 (0 in 5+ unit buildings).
- At $1,318/mo this rent would consume 52% of the median local household income ($31k/yr) (locally 843% of renters already pay >50% of income on rent) — very limited rent-growth headroom before tenants either downsize or default.
Forward outlook
- Local home prices are declining (-2.1%/yr); year-one equity from $864 of loan paydown is wiped out by about $3k of value loss. Plan a longer hold.
- Anderson County population projected at +14% by 2050 — modest demand growth; plan on rents tracking national, not racing it.
Negotiation context
- It's been on market 50 days — a 3% lower offer ($121k) is reasonable based on typical stale-listing flexibility.
- Current owner paid $15k; list at $125k implies a 733% gain — meaningful room to come down on a strong offer.
Risks & watch-outs
- Climate carrying-cost: extreme-heat days projected 7→16/yr by 2055 (HVAC capex compounding) — expect insurance premiums to compound above CPI over the hold.
Questions for the listing agent
- It's been on market 50 days. Have you received any prior offers? Is the seller open to a 3% concession, seller financing, or rate buy-down credit?
- Is there a deadline driving the sale (1031 exchange, divorce, estate, relocation)? That informs how much negotiation room exists.
- Schools are D-rated, which usually means shorter tenancies and higher turnover. Who's the typical renter profile here, and what's been the actual vacancy rate?
- Crime grade is F in this area — have there been break-ins, vandalism, or insurance claims at this property in the last 3 years? What carrier currently insures it and at what premium?
- What's the average days-on-market for RENTAL listings here right now (not sales)? A rising rental-DOM trend means longer vacancies and softer asking-rent achievability than the comps imply.
- What's the recent tenant-quality profile in this submarket — average credit score on applications, eviction rate, late-payment / NSF rate, and stable-employment percentage? A property-management company in the area should have these aggregated.
- How much new for-sale + rental construction is in the pipeline within 1–3 miles? Heavy new supply typically softens prices + rents 12–24 months out; constrained supply supports both.
Investment metrics
- 1% rule
- 1.06% ✓
- Cap rate
- 8.00%
- Cash-on-cash
- 6.11%
- DSCR
- 1.27
- GRM
- 7.9
CMA / ARV
No comps found within radius.
Projected returns pro-forma
-2.06% appreciation · 3.0% rent growth · sell at horizon
- IRR
- -2.8%
- Equity multiple
- 0.89×
- Total profit
- $-3,903
- Equity at exit
- $23,916
- IRR
- 5.4%
- Equity multiple
- 1.45×
- Total profit
- $15,708
- Equity at exit
- $20,115
Cash invested: $34,972 (down + closing). Projections, not guarantees.
Landlord ↔ Tenant lean methodology
- Overall (STATE)
- 90 Strongly Landlord-Friendly
- State South Carolina
- 90 Strongly Landlord-Friendly · R+6
- County
- — inherits STATE
- City
- — inherits STATE
ZIP-level market 29624
- Home prices YoY
- -0.5%
- Active inventory
- 114
- Price-to-rent
- 7.9×
Monthly cashflow live
- Estimated rent
- $1,318 medium interval (Pro) →
- Mortgage (P&I)
- −$655
- Tax est. 1.5%
- −$156 /mo · $1,874/yr
- Insurance
- −$52
- HOA
- −$0
- Vacancy / Maint / Mgmt
- −$277
- Net cashflow
- $178
Break-even live
UW: 25.0% down · 7.5% · 30yr · 1.5% tax · 5.0% vac · 8.0% maint · 8.0% mgmt
Financing live
Cash to close
- Down payment
- $31,225
- Closing costs
- $3,747
- Reserves months
- —
- Total cash needed
- —
Loan-product check · same deal, 3 products live
Conventional
25% down · 7.5% · 30yr
- Down + closing
- —
- Monthly P&I
- —
- Monthly cashflow
- —
- DSCR
- —
- Eligible?
- —
Personal DTI + credit; lowest rate.
DSCR
20% down · 8.5% · 30yr
- Down + closing
- —
- Monthly P&I
- —
- Monthly cashflow
- —
- DSCR
- —
- Eligible?
- —
No personal income docs; deal must DSCR.
Hard money
10% down · 12.0% · 12mo
- Down + closing
- —
- Monthly P&I
- —
- Monthly cashflow
- —
- DSCR
- —
- Eligible?
- —
Short-term bridge; refi at stabilization.
Rent comps 2 comps
| Address | Beds | Baths | Sqft | Rent | $/sqft | DOM | Units | Dist |
|---|---|---|---|---|---|---|---|---|
| 402 N Main St Anderson, SC | 2.0 | 1.0–1.5 | 526 | $2,195 | $4.17 | 2d | 5 | 1.23mi |
| 121 E Sharpe St Unit 127 Anderson, SC | 1.0 | 1.0 | 723 | $950 | $1.31 | 23d | 1 | 1.26mi |
Listing history 16 events
-
2026-06-10days on market $124,900 Active 50 DOM
-
2026-06-09days on market $124,900 Active 49 DOM
-
2026-06-08days on market $124,900 Active 48 DOM
-
2026-06-07days on market $124,900 Active 47 DOM
-
2026-06-05days on market $124,900 Active 44 DOM
-
2026-06-03days on market $124,900 Active 43 DOM
-
2026-06-03days on market $124,900 Active 42 DOM
-
2026-06-01days on market $124,900 Active 41 DOM
-
2026-05-31days on market $124,900 Active 40 DOM
-
2026-04-21$124,900 Active
-
2026-03-25price $124,000
-
2026-03-10price $126,000
-
2026-01-29price $130,000
-
2025-11-15price $126,000
-
2024-11-09price $129,900
-
2004-06-02soldstatus $15,000
ⓘ Source: listings_history table (triggers on properties + properties_extension) + one-shot
backfill from property_details.listing_events for pre-trigger history.
Climate risk First Street
- Flood 1/10 Low FEMA zone X (unshaded) · 0% chance over 30 yrs
- Wildfire 2/10 Low
- Heat 6/10 Major 7 d/yr ≥105°F today · 16 d/yr by 30 yrs out
- Wind 3/10 Moderate 5% chance of damaging wind over 30 yrs
- Air quality 4/10 Moderate 3 unhealthy d/yr today · 5 by 30 yrs out
Nearby sold comps map
Loading sold comps map…
Walkable amenities ~0.75 mi
Loading nearby amenities…
Taxation est. · year 1
- Rental income
- $15,816
- − Mortgage interest
- −$6,996
- − Property taxes
- −$1,874
- − Insurance
- −$624
- − Repairs & maintenance
- −$1,265
- − Management
- −$1,265
- − Depreciation
- −$3,633
- Taxable income
- $157
- Est. tax owed @ 24.0%
- −$38
- After-tax cash flow
- $2,099/yr
For passive investors: Depreciation is non-cash, so a rental often shows a tax loss while cash-flowing — sheltering income. Rental losses are passive: they offset passive income freely, and up to $25,000/yr can offset ordinary (W-2) income if you actively participate and your MAGI is under $100k (phasing out to $0 by $150k); unused losses carry forward. On sale, claimed depreciation is recaptured at up to 25%, and gains may owe capital-gains tax (a 1031 exchange can defer both). Figures are a year-1 estimate at your 24.0% rate — not tax advice; consult a CPA.
Schools (NCES district)
- District
- Anderson 05
- NCES district ID
- 4500900
- Math proficiency
- 44% ▼ -4.00%
- Reading proficiency
- 49% ▲ 2.00%
- Median HH income
- $39,718
- Composite
- 38.89/100
- National rank
- #4098
- State rank
- #20 of 80 in SC
Livability — Anderson
- Score
- 67/100
- State rank
- #98
- US rank
- #10772
Category grades
Schools grade is shown separately in the Schools card above.
Census & demographics
- Census place
- Anderson, SC
- County
- Anderson County · 99,076 people
- City population
- 87,992
- Metro
- Greenville-Anderson, SC
- Population (ZIP)
- 13,498
- Household income
- $30,549
- Rent vs Own
- Severe rent burden
- 843.0
Population outlook (Anderson County) Hauer SSP2
- Today (2025)
- 210,546 people
- By 2030
- 217,791 · +3.4%
- By 2040
- 230,643 · +9.5%
- By 2050
- 240,220 · +14.1%
- By 2075
- 259,518 · +23.3%
- By 2100
- 258,696 · +22.9%
Race, ethnicity, and origin ACS 2023
- Neighborhood character
- Diverse neighborhood (Simpson 0.63)
- Race & ethnicity
- White 44% Black 41% Hispanic / Latino 10% Two or more races 7%
- Hispanic origin (detail)
- Mexican 6%
- Common ancestry
- Serbian 1% Lithuanian 1% Italian 1%
- Foreign-born
- 3% · Canada
- Languages at home
- 95% English-only · Spanish 4%
Political lean MEDSL · Anderson
- 2024 margin
- Solid R (+47.4) · D 25.7% · R 73.1% · Other 1.2%
- 2008→2024 swing
- -14.1pp toward R · 2008: -33.3pp · 2024: -47.4pp
- All cycles
- 2024: R+47.4 2020: R+42.0 2016: R+43.7 2012: R+36.4 2008: R+33.3
Not yet ingested
- Civics
- —
Market trends
- HPI YoY
- ▼ -2.06%
- Current HPI
- 406.0533
- Rent YoY
- —
- Metro
- Greenville-Anderson, SC
- State GDP YoY
- ▲ 4.51%
- F500 in state
- 2
Industry mix (Fortune 500 HQ in SC)
| Industry | F500 HQs | Revenue |
|---|---|---|
| Packaging | 1 | $7B |
|
||
Price history
+732.7% since first listed7 events — show timeline
- 2026-04-21 Listed $124,900 WUMLS
- 2026-03-25 Price Changed $124,000 GAOR
- 2026-03-10 Price Changed $126,000 GAOR
- 2026-01-29 Price Changed $130,000 GAOR
- 2025-11-15 Price Changed $126,000 GAOR
- 2024-11-09 Price Changed $129,900 GAOR
- 2004-06-02 Sold (Public Records) $15,000 Public Records
Property tax history
-30.6%/yrLatest (2025): $40 · -91.3% YoY. Source: county tax records.
Cash-flow waterfall
monthlySold comps — $/sqft
last 12 mo · ≤1 miLoading sold comps…