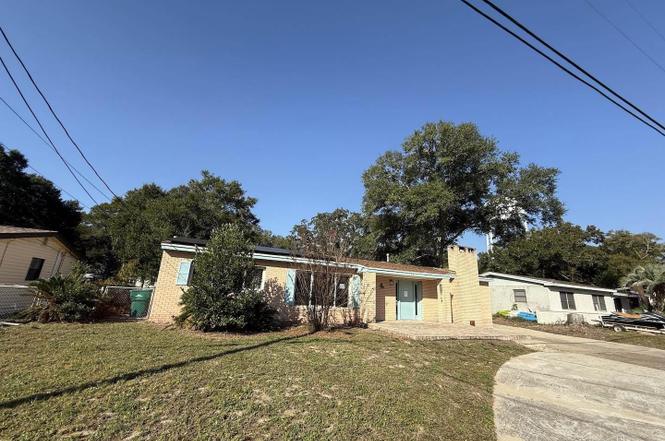
139 Bryn Mawr Blvd · Mary Esther, FL
Flood risk 1/10 · Minimal
- FEMA flood zone
- X (unshaded)
- Chance of flooding over 30 yrs
- 0.0%
- Est. flood insurance / yr
- $507 – $1,088
Fire risk 1/10 · Minimal
- Est. fire insurance / yr
- $947 – $1,759
Heat risk 10/10 · Severe
- Hot days now (above 104°F)
- 7 days/yr
- Hot days in 30 yrs
- 22 days/yr
Wind risk 9/10 · Severe
- Chance of severe wind over 30 yrs
- 99.0%
Air-quality risk 2/10 · Minimal
- Unhealthy air days now
- 1 days/yr
- Unhealthy air days in 30 yrs
- 2 days/yr
Risk factors via First Street. Map © Google.
Why this score? — see what drove the C grade
The composite is a weighted blend of 9 inputs, each scored 0–100. Each bar is that input's sub-score; the figure is the points it added to the 100-point composite (weight × sub-score).
- Cash flow +18.4/30.0
- ARV discount +15.0/15.0
- DSCR +5.8/10.0
- Schools +5.2/10.0
- 1% rule +4.8/10.0
- Livability +4.5/5.0
- Condition / age +2.5/5.0
- Rent growth +2.4/5.0
- Appreciation +0.0/10.0
$289,000
🖨 Deal sheet 📄 Offer letter ✓ Due diligence
Listing remarks MLS
Looking for a home in Mary Esther that is move in ready with still the opportunity to make it your own? Then look no farther! This 4 bedroom/2 bath home has plenty of room for your family and friends. Oh, and did I mention it has a spacious backyard and fire pit? I could go on and on with more details about this home, but this is one you must truly see to believe! Call to schedule your showing today, before this one slips away!
Key facts
- Spacious backyard
- Fire pit
- 0.27 acre lot
Tags
Neighborhood map
What this means for you Summary
Snapshot
- This is a 4-bed/2.0-bath single-family listed at $289k.
Deal economics
- At list price, monthly cash flow is $269 ($3k/yr) — positive.
- The deal already cash-flows at list — no discount required.
- To meet the 1% rule (rent ≥ 1% of price), the offer needs to be $284k (1.7% below list).
- Recommended offer: $254k (12.0% below list) — sets the bar for market timing.
- Cap rate 7.4% vs local median 4.8% in Mary Esther — top-decile yield for the area; either an underpriced asset or a hidden risk that comps aren't pricing in. Stress-test before assuming the spread holds.
Location & tenants
- Location reads 89/100 on livability (#2 in FL, #137 nationally) — a professional / high-income tenant draw. Strengths: crime A+, commute A+, cost of living A+.
- Okaloosa (other): math 60% / reading 60% proficiency, ranked #12 of 73 in FL (top 16%) — acceptable for families but not a draw, mixed tenant base, ~2y average lease.
- Market conditions: Rents soft (-0.5%/yr); 175 active listings in the ZIP; 7 comparable units currently listed for rent nearby; rentals at typical pace (median 21d on market — plan ~3-4 weeks tenant-placement turnaround); solid renter incomes; 1,268 units permitted in Okaloosa County in 2024 (175 in 5+ unit buildings).
- This rent runs 44% of the median local income ($78k/yr) — at the standard rent-burdened threshold; future hikes will face affordability resistance.
Forward outlook
- Local home prices are declining (-3.0%/yr); year-one equity from $2k of loan paydown is wiped out by about $9k of value loss. Plan a longer hold.
- Okaloosa County population projected at +37% by 2050 — long-run rental-demand tailwind backs the buy-and-hold thesis.
Negotiation context
- It's been on market 143 days — a 12% lower offer ($254k) is reasonable based on typical stale-listing flexibility.
- 14 sale attempts since 11y ago; this cycle's ask has dropped $46k (14%) from the opening price — seller is motivated, your offer sets the floor, not the list.
Risks & watch-outs
- Climate carrying-cost: severe wind risk, 99% chance of damaging wind over 30y; extreme-heat days projected 7→22/yr by 2055 (HVAC capex compounding) — expect insurance premiums to compound above CPI over the hold.
Questions for the listing agent
- It's been on market 143 days. Have you received any prior offers? Is the seller open to a 12% concession, seller financing, or rate buy-down credit?
- Built in 1961 — when were the roof, HVAC, electrical panel, plumbing, and water heater last replaced?
- Why hasn't it sold? Are there any deal-killer items the seller is aware of (foundation, flood, title, zoning, code violations)?
- Is there a deadline driving the sale (1031 exchange, divorce, estate, relocation)? That informs how much negotiation room exists.
- Schools are B-rated — typically a magnet for longer-tenancy family renters. What's the average tenant stay here, and is there a school-zone premium baked into asking?
- What's the average days-on-market for RENTAL listings here right now (not sales)? A rising rental-DOM trend means longer vacancies and softer asking-rent achievability than the comps imply.
- What's the recent tenant-quality profile in this submarket — average credit score on applications, eviction rate, late-payment / NSF rate, and stable-employment percentage? A property-management company in the area should have these aggregated.
- How much new for-sale + rental construction is in the pipeline within 1–3 miles? Heavy new supply typically softens prices + rents 12–24 months out; constrained supply supports both.
Investment metrics
- 1% rule
- 0.98% ✗
- Cap rate
- 7.41%
- Cash-on-cash
- 3.98%
- DSCR
- 1.18
- GRM
- 8.5
CMA / ARV
- ARV (median comp)
- $349,811
- List price
- $289,000
- Delta
- -17.38%
- Verdict
- UNDERPRICED
- Comps
- 20 within 1.0 mi
Show comp detail 12 sales within ~0.75 mi
| Address | Dist | Beds/Ba | Sqft | Sold | Price | $/sf | Match |
|---|---|---|---|---|---|---|---|
| 195 Marcia Dr | 0.14mi | 4/2.5 | 1,888 (-5%) | 6mo | $465,000 | $246 | 79 |
| 164 Marcia Dr | 0.21mi | 3/2.0 (-1) | 1,941 (-2%) | 8mo | $345,000 | $178 | 75 |
| 30 Palmetto Dr | 0.12mi | 3/2.0 (-1) | 1,824 (-8%) | 3mo | $373,000 | $204 | 74 |
| 492 Soundview Ct | 0.21mi | 3/2.5 (-1) | 2,030 (+2%) | 12mo | $555,000 | $273 | 69 |
| 8 Islandview Dr | 0.21mi | 3/2.0 (-1) | 2,022 (+2%) | 18mo | $240,000 | $119 | 67 |
| 154 Brewer Cir | 0.29mi | 3/2.0 (-1) | 2,191 (+11%) | 2mo | $400,000 | $183 | 62 |
| 12 W Audrey Dr | 0.30mi | 4/1.5 | 1,751 (-12%) | 4mo | $149,150 | $85 | 61 |
| 102 Point Comfort Rd | 0.38mi | 4/2.0 | 2,118 (+7%) | 12mo | $525,000 | $248 | 60 |
| 11 NW Wright Pkwy | 0.64mi | 4/2.0 | 2,108 (+6%) | 0mo | $520,000 | $247 | 59 |
| 729 Crestwood St | 0.34mi | 3/2.0 (-1) | 1,734 (-12%) | 2mo | $290,000 | $167 | 57 |
| 33 Palmetto Dr | 0.16mi | 3/2.0 (-1) | 1,721 (-13%) | 14mo | $354,900 | $206 | 54 |
| 38 NW Deal Ave | 0.51mi | 4/2.0 | 1,716 (-13%) | 8mo | $429,000 | $250 | 48 |
Match score weights: distance 35% · size 25% · config 20% · recency 20%. Top-matched comps best support the ARV.
Projected returns pro-forma
-3.0% appreciation · 0.0% rent growth · sell at horizon
- IRR
- -13.5%
- Equity multiple
- 0.53×
- Total profit
- $-38,020
- Equity at exit
- $43,091
- IRR
- -10.1%
- Equity multiple
- 0.47×
- Total profit
- $-43,139
- Equity at exit
- $24,987
Cash invested: $80,920 (down + closing). Projections, not guarantees.
Landlord ↔ Tenant lean methodology
- Overall (STATE)
- 87 Strongly Landlord-Friendly
- State Florida
- 87 Strongly Landlord-Friendly · R+3
- County
- — inherits STATE
- City
- — inherits STATE
ZIP-level market 32569
- Home prices YoY
- -26.5%
- Rents YoY
- -0.5%
- Active inventory
- 175
- Price-to-rent
- 8.5×
Monthly cashflow live
- Estimated rent
- $2,842 high interval (Pro) →
- Mortgage (P&I)
- −$1,516
- Tax from tax record
- −$340 /mo · $4,084/yr
- Insurance
- −$120
- HOA
- −$0
- Vacancy / Maint / Mgmt
- −$597
- Net cashflow
- $269
Break-even live
UW: 25.0% down · 7.5% · 30yr · 1.5% tax · 5.0% vac · 8.0% maint · 8.0% mgmt
Financing live
Cash to close
- Down payment
- $72,250
- Closing costs
- $8,670
- Reserves months
- —
- Total cash needed
- —
Loan-product check · same deal, 3 products live
Conventional
25% down · 7.5% · 30yr
- Down + closing
- —
- Monthly P&I
- —
- Monthly cashflow
- —
- DSCR
- —
- Eligible?
- —
Personal DTI + credit; lowest rate.
DSCR
20% down · 8.5% · 30yr
- Down + closing
- —
- Monthly P&I
- —
- Monthly cashflow
- —
- DSCR
- —
- Eligible?
- —
No personal income docs; deal must DSCR.
Hard money
10% down · 12.0% · 12mo
- Down + closing
- —
- Monthly P&I
- —
- Monthly cashflow
- —
- DSCR
- —
- Eligible?
- —
Short-term bridge; refi at stabilization.
Rent comps 7 comps
| Address | Beds | Baths | Sqft | Rent | $/sqft | DOM | Units | Dist |
|---|---|---|---|---|---|---|---|---|
| 490 Soundview Ct Mary Esther, FL | 3.0 | 2.5 | 1678 | $3,200 | $1.91 | 21d | 1 | 0.22mi |
| 17 Cape Dr NW Unit B Fort Walton Beach, FL | 3.0 | 2.0 | 1462 | $1,995 | $1.36 | 14d | 1 | 0.60mi |
| 358 Coral Dr SW Fort Walton Beach, FL | 3.0 | 2.0 | 1350 | $1,800 | $1.33 | 44d | 1 | 0.76mi |
| 200 Page Bacon Rd Mary Esther, FL | 1.0–3.0 | 1.0–2.0 | 1030 | $2,588 | $2.51 | 14d | 18 | 0.76mi |
| 322 Kathleen Pl NW Fort Walton Beach, FL | 4.0 | 2.0 | 1532 | $2,490 | $1.63 | 14d | 1 | 0.91mi |
| 470 Brian Cir Mary Esther, FL | 3.0 | 2.0 | 1875 | $2,800 | $1.49 | 44d | 1 | 1.02mi |
| 305 Leah Miller Dr NW Fort Walton Beach, FL | 3.0 | 1.5 | 1334 | $2,000 | $1.50 | 21d | 1 | 1.30mi |
Listing history 50 events
-
2026-06-19status $289,000 Pending 143 DOM
-
2026-06-18days on market $289,000 Contingent 143 DOM
-
2026-06-17days on market $289,000 Contingent 142 DOM
-
2026-06-16days on market $289,000 Contingent 141 DOM
-
2026-06-15days on market $289,000 Contingent 140 DOM
-
2026-06-14days on market $289,000 Contingent 138 DOM
-
2026-06-13days on market $289,000 Contingent 137 DOM
-
2026-06-10days on market $289,000 Contingent 135 DOM
-
2026-06-09days on market $289,000 Contingent 134 DOM
-
2026-06-08days on market $289,000 Contingent 133 DOM
-
2026-06-07days on market $289,000 Contingent 132 DOM
-
2026-06-05days on market $289,000 Contingent 129 DOM
-
2026-06-02days on market $289,000 Contingent 127 DOM
-
2026-06-01days on market $289,000 Contingent 126 DOM
-
2026-05-31days on market $289,000 Contingent 125 DOM
-
2026-05-30days on market $289,000 Contingent 124 DOM
-
2026-05-19historical Contingent 436-char remark
Show marketing remark (436 chars)
Looking for a home in Mary Esther that is move in ready with still the opportunity to make it your own? Then look no farther! This 4 bedroom/2 bath home has plenty of room for your family and friends. Oh, and did I mention it has a spacious backyard and fire pit? I could go on and on with more details about this home, but this is one you must truly see to believe! Call to schedule your showing today, before this one slips away!
-
2026-05-05price $289,000 436-char remark
Show marketing remark (436 chars)
Looking for a home in Mary Esther that is move in ready with still the opportunity to make it your own? Then look no farther! This 4 bedroom/2 bath home has plenty of room for your family and friends. Oh, and did I mention it has a spacious backyard and fire pit? I could go on and on with more details about this home, but this is one you must truly see to believe! Call to schedule your showing today, before this one slips away!
-
2026-04-06price $303,000 436-char remark
Show marketing remark (436 chars)
Looking for a home in Mary Esther that is move in ready with still the opportunity to make it your own? Then look no farther! This 4 bedroom/2 bath home has plenty of room for your family and friends. Oh, and did I mention it has a spacious backyard and fire pit? I could go on and on with more details about this home, but this is one you must truly see to believe! Call to schedule your showing today, before this one slips away!
-
2026-03-04price $318,000 436-char remark
Show marketing remark (436 chars)
Looking for a home in Mary Esther that is move in ready with still the opportunity to make it your own? Then look no farther! This 4 bedroom/2 bath home has plenty of room for your family and friends. Oh, and did I mention it has a spacious backyard and fire pit? I could go on and on with more details about this home, but this is one you must truly see to believe! Call to schedule your showing today, before this one slips away!
-
2026-01-26$334,500 Active 436-char remark
Show marketing remark (436 chars)
Looking for a home in Mary Esther that is move in ready with still the opportunity to make it your own? Then look no farther! This 4 bedroom/2 bath home has plenty of room for your family and friends. Oh, and did I mention it has a spacious backyard and fire pit? I could go on and on with more details about this home, but this is one you must truly see to believe! Call to schedule your showing today, before this one slips away!
-
2025-01-28price $367,500
-
2024-12-16price $370,000
-
2024-10-01$375,000 Active
-
2023-08-30price $380,000
-
2023-08-16$390,000 Active
-
2022-11-03soldstatus $340,000
-
2022-11-02soldstatus $340,000 Sold
-
2022-11-02soldstatus $340,000 Sold
-
2022-10-03status Pending
-
2022-10-03status Pending
-
2022-09-19price $329,000
-
2022-09-19price $329,000
-
2022-08-02price $340,000
-
2022-08-01price $340,000
-
2022-07-07historical
-
2022-07-06$350,000 Active
-
2022-07-06historical
-
2022-05-02$350,000 Active
-
2022-05-02$350,000 Active
-
2022-04-30historical
-
2022-04-30$350,000 Active
-
2018-09-10soldstatus $235,000
-
2018-09-07soldstatus $235,000
-
2018-09-07soldstatus $235,000
-
2018-04-23$239,900
-
2016-09-19soldstatus $209,714
-
2016-09-16soldstatus $209,800
-
2016-09-16soldstatus $209,800
-
2016-07-12$198,500
ⓘ Source: listings_history table (triggers on properties + properties_extension) + one-shot
backfill from property_details.listing_events for pre-trigger history.
Tax reassessment forecast FL · Resets to sale price
- Current annual tax
- $4,084 · $340/mo
- Projected year-2 tax
- $4,084 · $340/mo
- Expected delta
- $0/yr ($0/mo · 0.0%)
ⓘ Screening estimate from a state-policy table — verify with the county assessor before closing.
Climate risk First Street
- Flood 1/10 Low FEMA zone X (unshaded) · 0% chance over 30 yrs
- Wildfire 1/10 Low
- Heat 10/10 Extreme 7 d/yr ≥104°F today · 22 d/yr by 30 yrs out
- Wind 9/10 Extreme 99% chance of damaging wind over 30 yrs
- Air quality 2/10 Low 1 unhealthy d/yr today · 2 by 30 yrs out
Nearby sold comps map
Loading sold comps map…
Walkable amenities ~0.75 mi
Loading nearby amenities…
Taxation est. · year 1
- Rental income
- $34,100
- − Mortgage interest
- −$16,188
- − Property taxes
- −$4,084
- − Insurance
- −$1,445
- − Repairs & maintenance
- −$2,728
- − Management
- −$2,728
- − Depreciation
- −$8,407
- Taxable loss
- −$1,481
- Est. tax savings @ 24.0%
- +$355
- After-tax cash flow
- $3,579/yr
For passive investors: Depreciation is non-cash, so a rental often shows a tax loss while cash-flowing — sheltering income. Rental losses are passive: they offset passive income freely, and up to $25,000/yr can offset ordinary (W-2) income if you actively participate and your MAGI is under $100k (phasing out to $0 by $150k); unused losses carry forward. On sale, claimed depreciation is recaptured at up to 25%, and gains may owe capital-gains tax (a 1031 exchange can defer both). Figures are a year-1 estimate at your 24.0% rate — not tax advice; consult a CPA.
Schools (NCES district)
- District
- Okaloosa
- NCES district ID
- 1201380
- Math proficiency
- 60% ▼ -12.00%
- Reading proficiency
- 60% ▼ -4.00%
- Median HH income
- $55,601
- Composite
- 51.62/100
- National rank
- #1705
- State rank
- #12 of 73 in FL
Livability — Mary Esther
- Score
- 89/100
- State rank
- #2
- US rank
- #137
Category grades
Schools grade is shown separately in the Schools card above.
Census & demographics
- Census place
- Mary Esther, FL
- County
- Okaloosa County · 194,352 people
- City population
- 12,063
- Metro
- Crestview-Fort Walton Beach-Destin, FL
- Population (ZIP)
- 12,063
- Household income
- $77,718
- Rent vs Own
- Severe rent burden
- 416.0
Population outlook (Okaloosa County) Hauer SSP2
- Today (2025)
- 235,133 people
- By 2030
- 253,483 · +7.8%
- By 2040
- 289,537 · +23.1%
- By 2050
- 322,954 · +37.3%
- By 2075
- 399,624 · +70.0%
- By 2100
- 425,311 · +80.9%
Race, ethnicity, and origin ACS 2023
- Neighborhood character
- Diverse neighborhood (Simpson 0.58)
- Race & ethnicity
- White 63% Two or more races 12% Black 12% Hispanic / Latino 9% Asian 8%
- Hispanic origin (detail)
- Mexican 3% Puerto Rican 2%
- Common ancestry
- Slovak 5% Romanian 2% Lithuanian 2%
- Foreign-born
- 5% · Canada, South Korea, China
- Languages at home
- 89% English-only · Other Indo-European 4% Spanish 3% Tagalog/Filipino 1%
Political lean MEDSL · Okaloosa
- 2024 margin
- Solid R (+42.4) · D 28.2% · R 70.7% · Other 1.1%
- 2008→2024 swing
- +2.5pp toward D · 2008: -44.9pp · 2024: -42.4pp
- All cycles
- 2024: R+42.4 2020: R+39.1 2016: R+47.8 2012: R+49.4 2008: R+44.9
Not yet ingested
- Civics
- —
Market trends
- HPI YoY
- ▼ -97.13%
- Current HPI
- 269.266
- Rent YoY
- ▼ -0.45%
- Metro
- Crestview-Fort Walton Beach-Destin, FL
- State GDP YoY
- ▲ 3.28%
- F500 in state
- 36
Industry mix (Fortune 500 HQ in FL)
| Industry | F500 HQs | Revenue |
|---|---|---|
| Industrial Technology | 2 | $29B |
|
||
| Insurance | 2 | $17B |
|
||
| Retail | 1 | $60B |
|
||
| Technology Distribution | 1 | $58B |
|
||
| Homebuilding | 1 | $35B |
|
||
| Technology Manufacturing | 1 | $35B |
|
||
Price history
+381.7% since first listed45 events — show timeline
- 2026-05-19 Contingent — PARMLS
- 2026-05-05 Price Changed $289,000 PARMLS
- 2026-04-06 Price Changed $303,000 PARMLS
- 2026-03-04 Price Changed $318,000 PARMLS
- 2026-01-26 Listed $334,500 PARMLS
- 2025-01-28 Price Changed $367,500 ECAR
- 2024-12-16 Price Changed $370,000 ECAR
- 2024-10-01 Listed $375,000 ECAR
- 2023-08-30 Price Changed $380,000 ECAR
- 2023-08-16 Listed $390,000 ECAR
- 2022-11-03 Sold (Public Records) $340,000 Public Records
- 2022-11-02 Sold (MLS) $340,000 NAMLS
- 2022-11-02 Sold (MLS) $340,000 ECAR
- 2022-10-03 Pending — ECAR
- 2022-10-03 Pending — NAMLS
- 2022-09-19 Price Changed $329,000 ECAR
- 2022-09-19 Price Changed $329,000 NAMLS
- 2022-08-02 Price Changed $340,000 ECAR
- 2022-08-01 Price Changed $340,000 NAMLS
- 2022-07-07 Delisted — ECAR
- 2022-07-06 Listed $350,000 ECAR
- 2022-07-06 Listing Removed — NAMLS
- 2022-05-02 Listed $350,000 ECAR
- 2022-05-02 Listed $350,000 NAMLS
- 2022-04-30 Coming Soon — NAMLS
- 2022-04-30 Listed $350,000 NAMLS
- 2018-09-10 Sold (Public Records) $235,000 Public Records
- 2018-09-07 Sold (MLS) $235,000 NAMLS
- 2018-09-07 Sold (MLS) $235,000 ECAR
- 2018-04-23 Listed $239,900 NAMLS
- 2016-09-19 Sold (Public Records) $209,714 Public Records
- 2016-09-16 Sold (MLS) $209,800 ECAR
- 2016-09-16 Sold (MLS) $209,800 NAMLS
- 2016-07-12 Listed $198,500 NAMLS
- 2016-07-06 Listing Removed — NAMLS
- 2016-04-01 Listed $209,900 ECAR
- 2016-04-01 Listed $209,900 NAMLS
- 2016-01-05 Sold (Public Records) $95,000 Public Records
- 2015-12-29 Sold (MLS) $95,000 NAMLS
- 2015-12-29 Sold (MLS) $95,000 ECAR
- 2015-12-07 Listed $99,900 NAMLS
- 2015-10-13 Listing Removed — NAMLS
- 2015-06-29 Listed $119,900 ECAR
- 2015-06-29 Listed $119,900 NAMLS
- 1992-03-01 Sold (Public Records) $60,000 Public Records
Property tax history
+8.9%/yrLatest (2025): $4,084 · +5.1% YoY. Source: county tax records.
Cash-flow waterfall
monthlySold comps — $/sqft
last 12 mo · ≤1 miLoading sold comps…