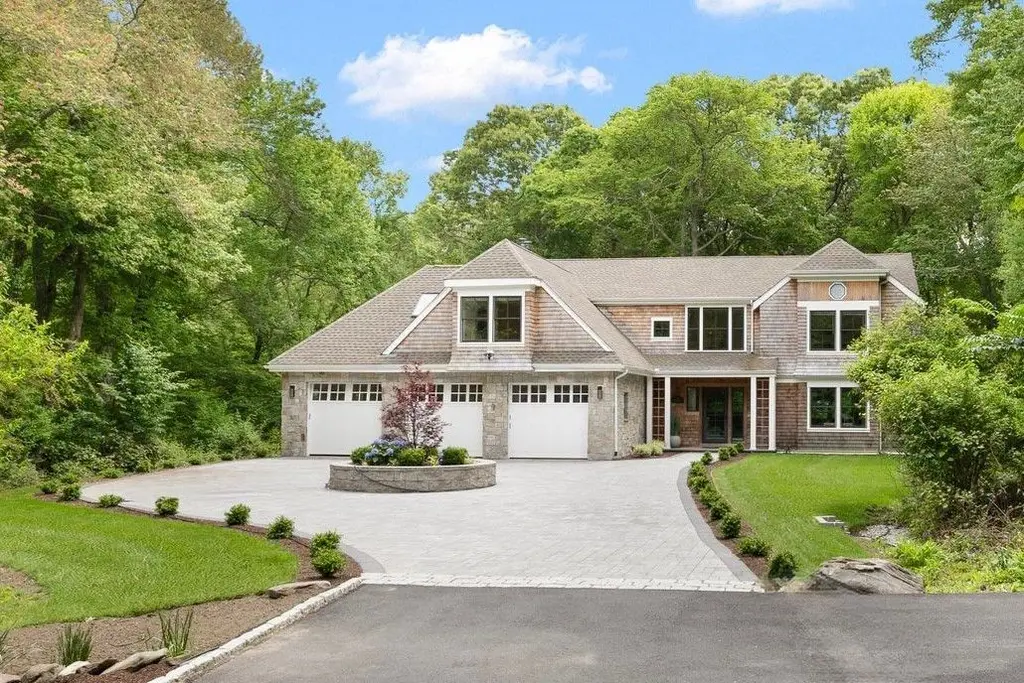
31 Wright Ln · Jamestown, RI
Flood risk No data
- FEMA flood zone
- —
- Chance of flooding over 30 yrs
- —
- Est. flood insurance / yr
- —
Fire risk No data
- Est. fire insurance / yr
- —
Heat risk No data
- Hot days now (above threshold)
- —
- Hot days in 30 yrs
- —
Wind risk No data
- Chance of severe wind over 30 yrs
- —
Air-quality risk No data
- Unhealthy air days now
- —
- Unhealthy air days in 30 yrs
- —
Risk factors via First Street. Map © Google.
Why this score? — see what drove the F grade
The composite is a weighted blend of 9 inputs, each scored 0–100. Each bar is that input's sub-score; the figure is the points it added to the 100-point composite (weight × sub-score).
- ARV discount +7.5/15.0
- Schools +5.4/10.0
- Rent growth +2.5/5.0
- Livability +2.5/5.0
- Condition / age +2.5/5.0
- Cash flow +0.0/30.0
- 1% rule +0.0/10.0
- DSCR +0.0/10.0
- Appreciation +0.0/10.0
$2,895,000
🖨 Deal sheet (PDF) 📄 Offer letter ✓ Due diligence
Listing remarks
Tucked away on 2+ private wooded acres just moments from the water, this completely transformed Jamestown coastal retreat offers the rare combination of luxury, privacy, and seamless connection to nature. Thoughtfully redesigned throughout, the home blends timeless coastal architecture with warm modern finishes and exceptional entertaining spaces. Expansive walls of glass along the rear of the first floor fill the home with natural light and tranquil wooded views. Rich cedar siding, wide-plank oak flooring, designer lighting, and curated finishes create a refined yet relaxed atmosphere throughout. At the heart of the home is an oversized kitchen island designed for cooking and entertaining,
Key facts
- 2.12 acre lot
- 3 garage spots
- Built 1988
Property features AI
Exterior
- Parking: Garage
- Home design: Single-family home; 2 stories
Interior
- Kitchen: Microwave; Dishwasher
- Bedrooms: 4 bedrooms
- Bathrooms: 3.5 bathrooms
- Heating & cooling: Air conditioning
- Interior features: Skylight; 9 total rooms
Neighborhood map
What this means for you Summary
Snapshot
- This is a 3-bed/3.5-bath single-family listed at $2.90M.
Deal economics
- At list price, monthly cash flow is $-16k ($-193k/yr) — negative.
- To cash-flow at today's rent, offer at most $566k (80.4% below list).
- To meet the 1% rule (rent ≥ 1% of price), the offer needs to be $495k (82.9% below list).
- Recommended offer: $495k (82.9% below list) — sets the bar for 1% rule.
Location & tenants
- Location reads: area grade F — affects rentability + tenant quality, not the cash-flow math above.
- Jamestown (suburban): math 51% / reading 68% proficiency, ranked #2 of 39 in RI (top 5%) — acceptable for families but not a draw, mixed tenant base, ~2y average lease; only 8% free/reduced lunch — higher-income household profile.
- Market conditions: 62 active listings in the ZIP; 94 units permitted in Newport County in 2024 (0 in 5+ unit buildings).
Forward outlook
- Local home prices are declining (-3.0%/yr); year-one equity from $20k of loan paydown is wiped out by about $87k of value loss. Plan a longer hold.
- Newport County population projected at -12% by 2050 — secular population decline; favor cash flow + early exit over multi-decade hold.
Negotiation context
- It's been on market 17 days — a 2% lower offer ($2.85M) is reasonable based on typical stale-listing flexibility.
Questions for the listing agent
- What do current leases actually rent for vs. the listed asking? Can we see a recent rent roll and the last 12 months of T-12 income?
- Is there a deadline driving the sale (1031 exchange, divorce, estate, relocation)? That informs how much negotiation room exists.
- The area grade is low — what's the realistic commute time and amenity access for the typical tenant pool here? Any planned neighborhood developments (good or bad) we should know about?
- What's the average days-on-market for RENTAL listings here right now (not sales)? A rising rental-DOM trend means longer vacancies and softer asking-rent achievability than the comps imply.
- What's the recent tenant-quality profile in this submarket — average credit score on applications, eviction rate, late-payment / NSF rate, and stable-employment percentage? A property-management company in the area should have these aggregated.
- How much new for-sale + rental construction is in the pipeline within 1–3 miles? Heavy new supply typically softens prices + rents 12–24 months out; constrained supply supports both.
Investment metrics
- 1% rule
- 0.17% ✗
- Cap rate
- -0.38%
- Cash-on-cash
- -23.83%
- DSCR
- -0.06
- GRM
- 48.7
CMA / ARV
- ARV (on-the-fly)
- $1,661,868
- Comps found
- 4
Show comp detail 4 sales within ~0.75 mi
| Address | Dist | Beds/Ba | Sqft | Sold | Price | $/sf | Match |
|---|---|---|---|---|---|---|---|
| 67 Wright Ln | 0.15mi | 4/4.0 (+1) | 3,523 (+1%) | 17mo | $1,725,000 | $490 | 70 |
| 48 Wright Ln | 0.12mi | 4/2.5 (+1) | 3,712 (+6%) | 8mo | $1,675,000 | $451 | 68 |
| 398 Sampan Ave | 0.60mi | 3/2.0 | 3,216 (-8%) | 6mo | $850,000 | $264 | 48 |
| 50 Intrepid Ln | 0.64mi | 4/2.5 (+1) | 3,279 (-6%) | 10mo | $1,562,500 | $477 | 43 |
Match score weights: distance 35% · size 25% · config 20% · recency 20%. Top-matched comps best support the ARV.
Projected returns pro-forma
-3.0% appreciation · 3.0% rent growth · sell at horizon
- IRR
- -68.8%
- Equity multiple
- -0.84×
- Total profit
- $-1,494,119
- Equity at exit
- $431,654
- IRR
- —
- Equity multiple
- -2.23×
- Total profit
- $-2,620,702
- Equity at exit
- $250,307
Cash invested: $810,600 (down + closing). Projections, not guarantees.
Landlord ↔ Tenant lean methodology
- Overall (STATE)
- 31 Tenant-Leaning
- State Rhode Island
- 31 Tenant-Leaning · D+8
- County
- — inherits STATE
- City
- — inherits STATE
ZIP-level market 02835
- Active inventory
- 62
- Price-to-rent
- 48.7×
Monthly cashflow live
- Estimated rent
- $4,952 medium interval (Pro) →
- Mortgage (P&I)
- −$15,182
- Tax est. 1.5%
- −$3,619 /mo · $43,425/yr
- Insurance
- −$1,206
- HOA
- −$0
- Vacancy / Maint / Mgmt
- −$1,040
- Net cashflow
- $-16,095
Break-even live
Sensitivity live
| Price | -10% $-14,094 | -5% $-15,094 | +0% $-16,095 | +5% $-17,095 | +10% $-18,095 |
|---|---|---|---|---|---|
| Rent | -10% $-16,486 | -5% $-16,290 | +0% $-16,095 | +5% $-15,899 | +10% $-15,703 |
| Rate | -1.0pp $-14,637 | -0.5pp $-15,358 | base $-16,095 | +0.5pp $-16,845 | +1.0pp $-17,608 |
UW: 25.0% down · 7.5% · 30yr · 1.5% tax · 5.0% vac · 8.0% maint · 8.0% mgmt
Financing live
Cash to close
- Down payment
- $723,750
- Closing costs
- $86,850
- Reserves months
- —
- Total cash needed
- —
Loan-product check · same deal, 3 products live
Conventional
25% down · 7.5% · 30yr
- Down + closing
- —
- Monthly P&I
- —
- Monthly cashflow
- —
- DSCR
- —
- Eligible?
- —
Personal DTI + credit; lowest rate.
DSCR
20% down · 8.5% · 30yr
- Down + closing
- —
- Monthly P&I
- —
- Monthly cashflow
- —
- DSCR
- —
- Eligible?
- —
No personal income docs; deal must DSCR.
Hard money
10% down · 12.0% · 12mo
- Down + closing
- —
- Monthly P&I
- —
- Monthly cashflow
- —
- DSCR
- —
- Eligible?
- —
Short-term bridge; refi at stabilization.
Listing history 12 events
-
2026-06-18days on market $2,895,000 Active 17 DOM
-
2026-06-17days on market $2,895,000 Active 16 DOM
-
2026-06-16days on market $2,895,000 Active 15 DOM
-
2026-06-15days on market $2,895,000 Active 14 DOM
-
2026-06-13days on market $2,895,000 Active 12 DOM
-
2026-06-09days on market $2,895,000 Active 8 DOM
-
2026-06-08days on market $2,895,000 Active 7 DOM
-
2026-06-07days on market $2,895,000 Active 6 DOM
-
2026-06-03days on market $2,895,000 Active 2 DOM
-
2026-06-02statusdays on market $2,895,000 Active 1 DOM
-
2026-06-01days on market $2,895,000 Coming Soon 4 DOM
-
2026-05-31days on market $2,895,000 Coming Soon 3 DOM
ⓘ Source: listings_history table (triggers on properties + properties_extension) + one-shot
backfill from property_details.listing_events for pre-trigger history.
Nearby sold comps map
Loading sold comps map…
Walkable amenities ~0.75 mi
Loading nearby amenities…
Taxation est. · year 1
- Rental income
- $59,423
- − Mortgage interest
- −$162,165
- − Property taxes
- −$43,425
- − Insurance
- −$14,475
- − Repairs & maintenance
- −$4,754
- − Management
- −$4,754
- − Depreciation
- −$84,218
- Taxable loss
- −$254,368
- Est. tax savings @ 24.0%
- +$61,048
- After-tax cash flow
- $-132,088/yr
For passive investors: Depreciation is non-cash, so a rental often shows a tax loss while cash-flowing — sheltering income. Rental losses are passive: they offset passive income freely, and up to $25,000/yr can offset ordinary (W-2) income if you actively participate and your MAGI is under $100k (phasing out to $0 by $150k); unused losses carry forward. On sale, claimed depreciation is recaptured at up to 25%, and gains may owe capital-gains tax (a 1031 exchange can defer both). Figures are a year-1 estimate at your 24.0% rate — not tax advice; consult a CPA.
Schools (NCES district)
- District
- Jamestown
- NCES district ID
- 4400510
- Math proficiency
- 51% ▼ -8.00%
- Reading proficiency
- 68% ▲ 5.00%
- Median HH income
- $88,929
- Composite
- 54.32/100
- National rank
- #1368
- State rank
- #2 of 39 in RI
Livability — Jamestown
No livability data for this city. (Only ~50 U.S. cities are tracked.)
Census & demographics
- Population (ZIP)
- 5,545
Population outlook (Newport County) Hauer SSP2
- Today (2025)
- 81,198 people
- By 2030
- 79,518 · -2.1%
- By 2040
- 75,581 · -6.9%
- By 2050
- 71,801 · -11.6%
- By 2075
- 64,618 · -20.4%
- By 2100
- 56,724 · -30.1%
Race, ethnicity, and origin ACS 2023
- Neighborhood character
- Predominantly White (93%)
- Race & ethnicity
- White 93% Two or more races 5%
- Common ancestry
- Russian 4% Romanian 3% Lithuanian 3%
- Foreign-born
- 2%
- Languages at home
- 96% English-only · German/W. Germanic 1% Spanish 1% Other Indo-European 1%
Political lean MEDSL · Newport
- 2024 margin
- Strong D (+25.5) · D 61.6% · R 36.1% · Other 2.2%
- 2008→2024 swing
- +2.2pp toward D · 2008: 23.3pp · 2024: 25.5pp
- All cycles
- 2024: D+25.5 2020: D+29.8 2016: D+19.4 2012: D+17.7 2008: D+23.3
Not yet ingested
- Civics
- —
Market trends
- HPI YoY
- ▼ -265.83%
- Current HPI
- 388.7836
- Rent YoY
- —
- Metro
- —
- State GDP YoY
- ▲ 2.25%
- F500 in state
- 10
Industry mix (Fortune 500 HQ in RI)
| Industry | F500 HQs | Revenue |
|---|---|---|
| Healthcare | 1 | $373B |
|
||
| Food Distribution | 1 | $31B |
|
||
| Aerospace / Defense | 1 | $14B |
|
||
| Financial Services | 1 | $8B |
|
||
| Consumer Goods | 1 | $4B |
|
||
Cash-flow waterfall
monthlySold comps — $/sqft
last 12 mo · ≤1 miLoading sold comps…