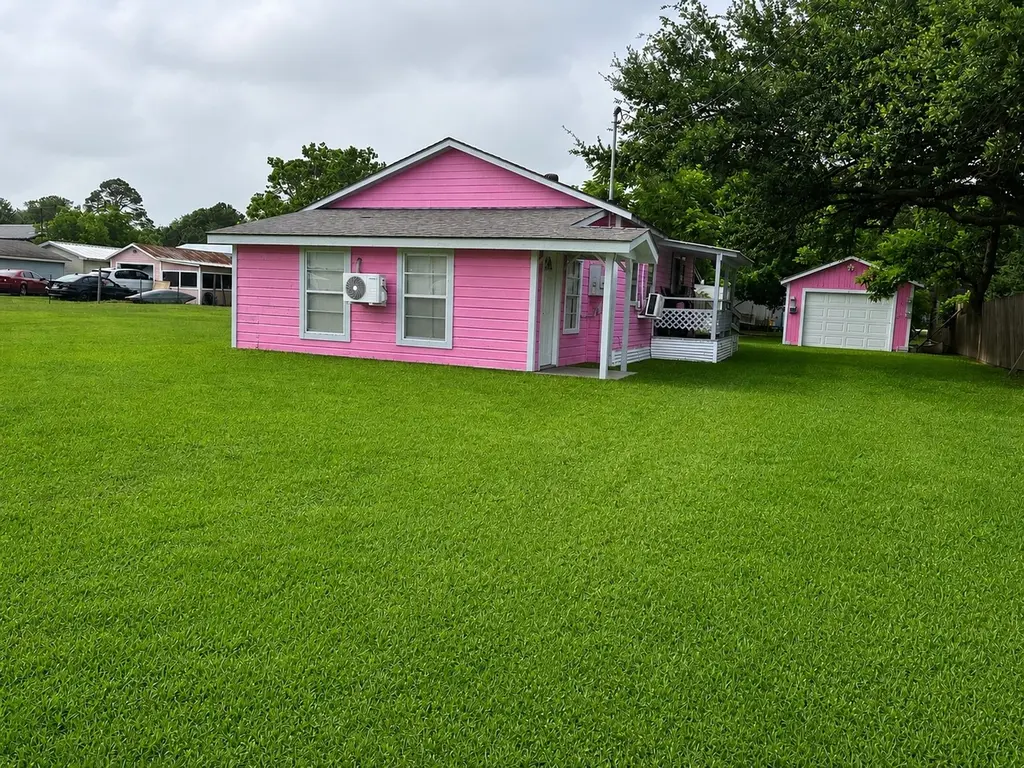
203 Mcneir St · Texas City, TX
Flood risk 9/10 · Severe
- FEMA flood zone
- X (shaded)
- Chance of flooding over 30 yrs
- 0.99%
- Est. flood insurance / yr
- $507 – $1,088
Fire risk 4/10 · Minor
- Est. fire insurance / yr
- $1,222 – $2,270
Heat risk 10/10 · Severe
- Hot days now (above 108°F)
- 7 days/yr
- Hot days in 30 yrs
- 27 days/yr
Wind risk 10/10 · Severe
- Chance of severe wind over 30 yrs
- 99.0%
Air-quality risk 2/10 · Minimal
- Unhealthy air days now
- 1 days/yr
- Unhealthy air days in 30 yrs
- 1 days/yr
Risk factors via First Street. Map © Google.
Why this score? — see what drove the C grade
The composite is a weighted blend of 9 inputs, each scored 0–100. Each bar is that input's sub-score; the figure is the points it added to the 100-point composite (weight × sub-score).
- Cash flow +26.5/30.0
- DSCR +9.1/10.0
- 1% rule +7.5/10.0
- ARV discount +3.6/15.0
- Schools +3.5/10.0
- Livability +3.1/5.0
- Rent growth +2.5/5.0
- Condition / age +2.5/5.0
- Appreciation +0.0/10.0
$165,000
🖨 Deal sheet (PDF) 📄 Offer letter ✓ Due diligence
Listing remarks
Cozy, furnished 3-bedroom, 1-bath home in Smiths Point, TX, just off Galveston Bay. Located across from waterfront properties, it offers partial water views and is sold with the adjoining lot for added space and potential. An RV currently on the property will also convey. Recent updates include new mini-split systems for efficient heating and cooling. Additional features include a detached garage and storage shed. Enjoy nearby amenities like a public boat ramp, community park at the end of the block, and a bird lookout just minutes away. Ideal for a weekend getaway, investment, or full-time coastal living.
Key facts
- 0.34 acre lot
- 2 garage spots
- Listed 27 days
Neighborhood map
What this means for you Summary
Snapshot
- This is a 3-bed/1.0-bath single-family listed at $165k.
Deal economics
- At list price, monthly cash flow is $371 ($4k/yr) — positive.
- The deal already cash-flows at list — no discount required.
- Meets the 1% rule at list price ($2k rent vs $165k).
- Recommended offer: $163k (1.5% below list) — sets the bar for market timing.
- Cap rate 9.5% vs local median 4.3% in Texas City — top-decile yield for the area; either an underpriced asset or a hidden risk that comps aren't pricing in. Stress-test before assuming the spread holds.
Location & tenants
- Location reads 62/100 on livability (#907 in TX) — a middle-class / working-renter tenant base. Strengths: cost of living A+, housing A+; Watch: crime D+, amenities F, commute F.
- Anahuac ISD (rural): math 41% / reading 41% proficiency, ranked #373 of 826 in TX (top 45%) — families likely to look elsewhere, expect single-tenant / working-renter base with shorter leases.
- Zoned schools: Anahuac Middle (math 52% / reading 46%, grade C-, #378 of 1,662 statewide, top 23%, 326 students, 61% FRL); Anahuac H S (math 37% / reading 62%, grade D, #509 of 1,632 statewide, top 34%, 454 students, 58% FRL).
- Market conditions: 145 active listings in the ZIP; 629 units permitted in Chambers County in 2024 (0 in 5+ unit buildings).
Forward outlook
- Local home prices are declining (-3.0%/yr); year-one equity from $1k of loan paydown is wiped out by about $5k of value loss. Plan a longer hold.
- Chambers County population projected at +46% by 2050 — long-run rental-demand tailwind backs the buy-and-hold thesis.
Negotiation context
- It's been on market 28 days — a 2% lower offer ($163k) is reasonable based on typical stale-listing flexibility.
- 3 sale attempts since 5y ago; this cycle's ask has dropped $30k (15%) from the opening price — seller is motivated, your offer sets the floor, not the list.
Risks & watch-outs
- Watch-outs: flood insurance adds $66/mo; built in 1900 — expect roof / HVAC / electrical / plumbing capex.
- Climate carrying-cost: severe flood risk; severe wind risk, 99% chance of damaging wind over 30y; extreme-heat days projected 7→27/yr by 2055 (HVAC capex compounding) — expect insurance premiums to compound above CPI over the hold.
Questions for the listing agent
- Built in 1900 — when were the roof, HVAC, electrical panel, plumbing, and water heater last replaced?
- What's the actual annual flood-insurance premium (NFIP or private), and is the property in a SFHA with mandatory coverage?
- Is there a deadline driving the sale (1031 exchange, divorce, estate, relocation)? That informs how much negotiation room exists.
- Schools are F-rated, which usually means shorter tenancies and higher turnover. Who's the typical renter profile here, and what's been the actual vacancy rate?
- Crime grade is D in this area — have there been break-ins, vandalism, or insurance claims at this property in the last 3 years? What carrier currently insures it and at what premium?
- What's the average days-on-market for RENTAL listings here right now (not sales)? A rising rental-DOM trend means longer vacancies and softer asking-rent achievability than the comps imply.
- What's the recent tenant-quality profile in this submarket — average credit score on applications, eviction rate, late-payment / NSF rate, and stable-employment percentage? A property-management company in the area should have these aggregated.
- How much new for-sale + rental construction is in the pipeline within 1–3 miles? Heavy new supply typically softens prices + rents 12–24 months out; constrained supply supports both.
Investment metrics
- 1% rule
- 1.25% ✓
- Cap rate
- 9.48%
- Cash-on-cash
- 11.37%
- DSCR
- 1.51
- GRM
- 6.7
CMA / ARV
- ARV (on-the-fly)
- $151,840
- Comps found
- 2
Show comp detail 2 sales within ~0.75 mi
| Address | Dist | Beds/Ba | Sqft | Sold | Price | $/sf | Match |
|---|---|---|---|---|---|---|---|
| 219 Watie Rd | 0.12mi | 2/2.0 (-1) | 1,224 (+5%) | 13mo | $159,000 | $130 | 66 |
| 231 Bayshore Rd | 0.08mi | 2/1.5 (-1) | 1,024 (-12%) | 10mo | $79,900 | $78 | 60 |
Match score weights: distance 35% · size 25% · config 20% · recency 20%. Top-matched comps best support the ARV.
Projected returns pro-forma
-3.0% appreciation · 3.0% rent growth · sell at horizon
- IRR
- -1.7%
- Equity multiple
- 0.94×
- Total profit
- $-2,981
- Equity at exit
- $24,602
- IRR
- 8.0%
- Equity multiple
- 1.61×
- Total profit
- $28,285
- Equity at exit
- $14,266
Cash invested: $46,200 (down + closing). Projections, not guarantees.
Landlord ↔ Tenant lean methodology
- Overall (STATE)
- 87 Strongly Landlord-Friendly
- State Texas
- 87 Strongly Landlord-Friendly · R+5
- County
- — inherits STATE
- City
- — inherits STATE
ZIP-level market 77514
- Home prices YoY
- -23.3%
- Active inventory
- 145
- Price-to-rent
- 6.7×
Monthly cashflow live
- Estimated rent
- $2,065 medium interval (Pro) →
- Mortgage (P&I)
- −$865
- Tax from tax record
- −$259 /mo · $3,114/yr
- Insurance
- −$69
- Flood insurance flood zone
- −$66 /mo · $798/yr
- HOA
- −$0
- Vacancy / Maint / Mgmt
- −$434
- Net cashflow
- $371
Break-even live
Sensitivity live
| Price | -10% $465 | -5% $418 | +0% $371 | +5% $325 | +10% $278 |
|---|---|---|---|---|---|
| Rent | -10% $208 | -5% $290 | +0% $371 | +5% $453 | +10% $534 |
| Rate | -1.0pp $454 | -0.5pp $413 | base $371 | +0.5pp $329 | +1.0pp $285 |
UW: 25.0% down · 7.5% · 30yr · 1.5% tax · 5.0% vac · 8.0% maint · 8.0% mgmt
Financing live
Cash to close
- Down payment
- $41,250
- Closing costs
- $4,950
- Reserves months
- —
- Total cash needed
- —
Loan-product check · same deal, 3 products live
Conventional
25% down · 7.5% · 30yr
- Down + closing
- —
- Monthly P&I
- —
- Monthly cashflow
- —
- DSCR
- —
- Eligible?
- —
Personal DTI + credit; lowest rate.
DSCR
20% down · 8.5% · 30yr
- Down + closing
- —
- Monthly P&I
- —
- Monthly cashflow
- —
- DSCR
- —
- Eligible?
- —
No personal income docs; deal must DSCR.
Hard money
10% down · 12.0% · 12mo
- Down + closing
- —
- Monthly P&I
- —
- Monthly cashflow
- —
- DSCR
- —
- Eligible?
- —
Short-term bridge; refi at stabilization.
Listing history 32 events
-
2026-06-21days on market $165,000 Active 28 DOM
-
2026-06-18days on market $165,000 Active 25 DOM
-
2026-06-17days on market $165,000 Active 24 DOM
-
2026-06-16days on market $165,000 Active 23 DOM
-
2026-06-15days on market $165,000 Active 22 DOM
-
2026-06-13days on market $165,000 Active 20 DOM
-
2026-06-09days on market $165,000 Active 16 DOM
-
2026-06-08days on market $165,000 Active 15 DOM
-
2026-06-07days on market $165,000 Active 14 DOM
-
2026-06-04days on market $165,000 Active 11 DOM
-
2026-06-03days on market $165,000 Active 10 DOM
-
2026-06-02days on market $165,000 Active 9 DOM
-
2026-06-01days on market $165,000 Active 8 DOM
-
2026-05-31days on market $165,000 Active 7 DOM
-
2026-05-20historical $165,000
-
2024-07-10historical
-
2024-05-29price $185,000
-
2024-03-11$195,000 Active
-
2024-02-28historical
-
2023-09-29$195,000 Active
-
2022-04-08soldstatus Sold
-
2022-04-08soldstatus
-
2022-03-29status Option Pending
-
2022-03-28historical
-
2022-03-11price $129,000
-
2021-10-14price $149,000
-
2021-08-25price $154,000
-
2021-07-18price $159,000
-
2021-06-21price $164,000
-
2021-06-01price $169,000
-
2021-04-17price $179,000
-
2021-03-29$189,000 Active
ⓘ Source: listings_history table (triggers on properties + properties_extension) + one-shot
backfill from property_details.listing_events for pre-trigger history.
Tax reassessment forecast TX · Resets to sale price
- Current annual tax
- $3,114 · $259/mo
- Projected year-2 tax
- $3,114 · $259/mo
- Expected delta
- $0/yr ($0/mo · 0.0%)
ⓘ Screening estimate from a state-policy table — verify with the county assessor before closing.
Climate risk First Street
- Flood 9/10 Extreme FEMA zone X (shaded) · 99% chance over 30 yrs
- Wildfire 4/10 Moderate
- Heat 10/10 Extreme 7 d/yr ≥108°F today · 27 d/yr by 30 yrs out
- Wind 10/10 Extreme 99% chance of damaging wind over 30 yrs
- Air quality 2/10 Low 1 unhealthy d/yr today · 1 by 30 yrs out
Nearby sold comps map
Loading sold comps map…
Walkable amenities ~0.75 mi
Loading nearby amenities…
Taxation est. · year 1
- Rental income
- $24,780
- − Mortgage interest
- −$9,243
- − Property taxes
- −$3,114
- − Insurance
- −$1,622
- − Repairs & maintenance
- −$1,982
- − Management
- −$1,982
- − Depreciation
- −$4,800
- Taxable income
- $2,036
- Est. tax owed @ 24.0%
- −$489
- After-tax cash flow
- $3,968/yr
For passive investors: Depreciation is non-cash, so a rental often shows a tax loss while cash-flowing — sheltering income. Rental losses are passive: they offset passive income freely, and up to $25,000/yr can offset ordinary (W-2) income if you actively participate and your MAGI is under $100k (phasing out to $0 by $150k); unused losses carry forward. On sale, claimed depreciation is recaptured at up to 25%, and gains may owe capital-gains tax (a 1031 exchange can defer both). Figures are a year-1 estimate at your 24.0% rate — not tax advice; consult a CPA.
Schools (NCES district)
- District
- Anahuac ISD
- NCES district ID
- 4808190
- Math proficiency
- 41% ▼ -22.00%
- Reading proficiency
- 41% ▼ -7.00%
- Median HH income
- $46,714
- Composite
- 35.02/100
- National rank
- #5043
- State rank
- #373 of 826 in TX
Livability — Texas City
- Score
- 62/100
- State rank
- #907
- US rank
- #16268
Category grades
Schools grade is shown separately in the Schools card above.
Census & demographics
- City population
- 49,936
- Population (ZIP)
- 5,213
Population outlook (Chambers County) Hauer SSP2
- Today (2025)
- 46,946 people
- By 2030
- 51,094 · +8.8%
- By 2040
- 59,578 · +26.9%
- By 2050
- 68,318 · +45.5%
- By 2075
- 90,485 · +92.7%
- By 2100
- 104,885 · +123.4%
Race, ethnicity, and origin ACS 2023
- Neighborhood character
- Diverse neighborhood (Simpson 0.61)
- Race & ethnicity
- White 55% Hispanic / Latino 29% Two or more races 13% Black 10% Asian 3%
- Hispanic origin (detail)
- Mexican 28%
- Common ancestry
- Lithuanian 4% Slovak 2% Scandinavian 1%
- Foreign-born
- 12% · Canada, Vietnam
- Languages at home
- 73% English-only · Spanish 23% Vietnamese 3%
Political lean MEDSL · Chambers
- 2024 margin
- Solid R (+65.6) · D 16.8% · R 82.4%
- 2008→2024 swing
- -14.4pp toward R · 2008: -51.2pp · 2024: -65.6pp
- All cycles
- 2024: R+65.6 2020: R+61.7 2016: R+62.1 2012: R+61.1 2008: R+51.2
Not yet ingested
- Civics
- —
Market trends
- HPI YoY
- ▼ -61.88%
- Current HPI
- 203.8454
- Rent YoY
- —
- Metro
- —
- State GDP YoY
- ▲ 3.95%
- F500 in state
- 110
Industry mix (Fortune 500 HQ in TX)
| Industry | F500 HQs | Revenue |
|---|---|---|
| Energy | 16 | $1,198B |
|
||
| Technology | 5 | $198B |
|
||
| Engineering / Construction | 4 | $72B |
|
||
| Energy Services | 3 | $60B |
|
||
| Utilities | 3 | $41B |
|
||
| Healthcare | 2 | $330B |
|
||
Price history
-12.7% since first listed18 events — show timeline
- 2026-05-20 Coming Soon $165,000 HARMLS
- 2024-07-10 Listing Removed — HARMLS
- 2024-05-29 Price Changed $185,000 HARMLS
- 2024-03-11 Listed $195,000 HARMLS
- 2024-02-28 Listing Removed — HARMLS
- 2023-09-29 Listed $195,000 HARMLS
- 2022-04-08 Sold (Public Records) — Public Records
- 2022-04-08 Sold (MLS) — HARMLS
- 2022-03-29 Pending — HARMLS
- 2022-03-28 Listing Removed — HARMLS
- 2022-03-11 Price Changed $129,000 HARMLS
- 2021-10-14 Price Changed $149,000 HARMLS
- 2021-08-25 Price Changed $154,000 HARMLS
- 2021-07-18 Price Changed $159,000 HARMLS
- 2021-06-21 Price Changed $164,000 HARMLS
- 2021-06-01 Price Changed $169,000 HARMLS
- 2021-04-17 Price Changed $179,000 HARMLS
- 2021-03-29 Listed $189,000 HARMLS
Property tax history
+10.9%/yrLatest (2025): $3,114 · +1.2% YoY. Source: county tax records.
Cash-flow waterfall
monthlySold comps — $/sqft
last 12 mo · ≤1 miLoading sold comps…