 🏗️ New Construction
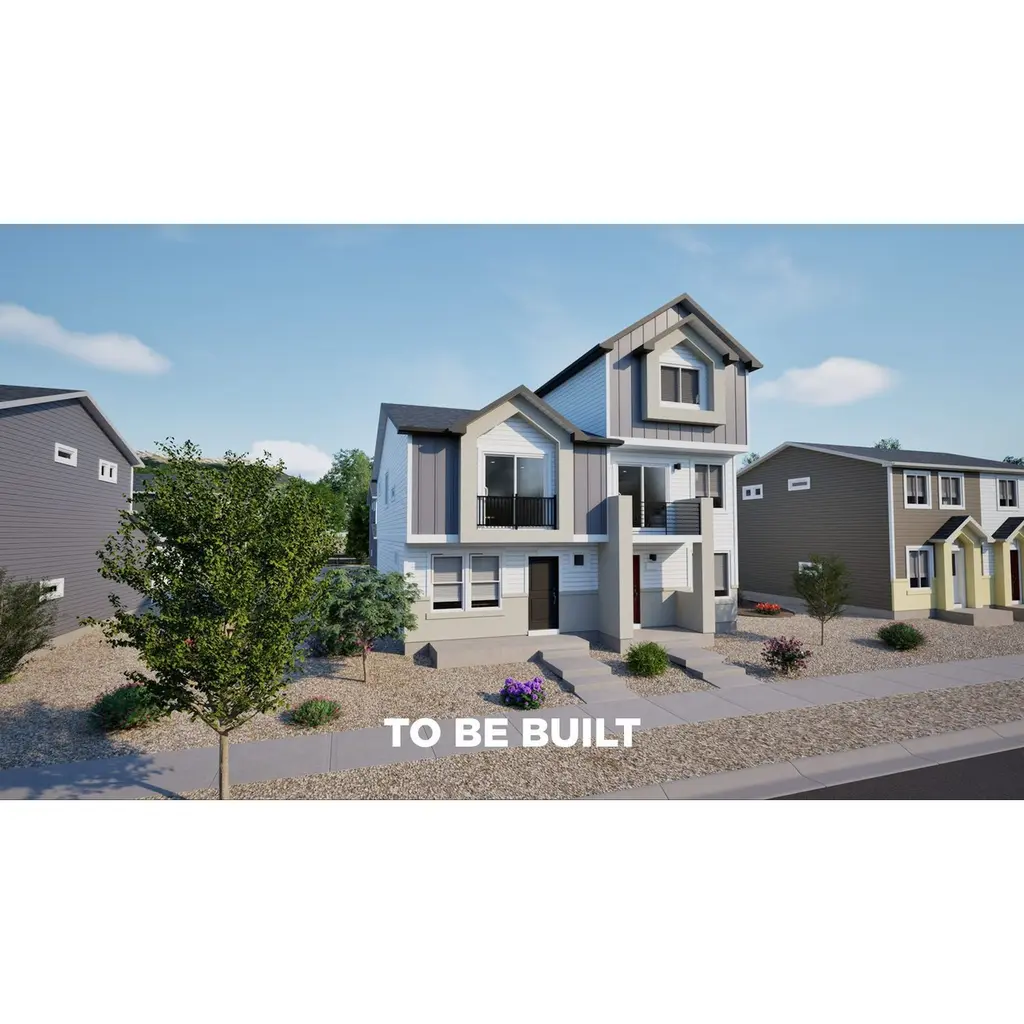
Compass Plan · Colorado Springs, CO
Flood risk No data
- FEMA flood zone
- —
- Chance of flooding over 30 yrs
- —
- Est. flood insurance / yr
- —
Fire risk No data
- Est. fire insurance / yr
- —
Heat risk No data
- Hot days now (above threshold)
- —
- Hot days in 30 yrs
- —
Wind risk No data
- Chance of severe wind over 30 yrs
- —
Air-quality risk No data
- Unhealthy air days now
- —
- Unhealthy air days in 30 yrs
- —
Risk factors via First Street. Map © Google.
Why this score? — see what drove the F grade
The composite is a weighted blend of 9 inputs, each scored 0–100. Each bar is that input's sub-score; the figure is the points it added to the 100-point composite (weight × sub-score).
- ARV discount +7.5/15.0
- Cash flow +4.4/30.0
- Appreciation +4.4/10.0
- Livability +3.9/5.0
- Schools +3.4/10.0
- Condition / age +2.5/5.0
- Rent growth +1.3/5.0
- 1% rule +1.0/10.0
- DSCR +0.0/10.0
$299,990
🖨 Deal sheet (PDF) 📄 Offer letter ✓ Due diligence
Listing remarks MLS
Let the Compass guide you home!. This bright and inviting duet-style home offers 3 bedrooms, 2 baths, and 1,008 square feet of efficient, well-balanced living across two levels. A spacious open-concept main floor connects the kitchen, dining, and great room areas for seamless everyday living. Upstairs, the primary suite includes a private bath and walk-in closet, while two additional bedrooms provide flexibility for family, guests, or a home office. With a 2-car garage, smart storage, and the added benefit of end-unit privacy, the Compass delivers everything you need in a home that fits your budget and your lifestyle. Enjoy access to Banning Lewis Ranch's incredible amenities, including parks, pools, fitness centers, award-winning schools, dog park, and miles of scenic trails, all within a vibrant, welcoming community.
Key facts
- Scenic trails
- Access to amenities
- Private bath
Tags
Neighborhood map
What this means for you Summary
Snapshot
- This is a 3-bed/2.0-bath townhouse listed at $300k.
Deal economics
- At list price, monthly cash flow is $-1k ($-12k/yr) — negative.
- To cash-flow at today's rent, offer at most $241k (19.5% below list).
- To meet the 1% rule (rent ≥ 1% of price), the offer needs to be $234k (22.0% below list).
- Recommended offer: $234k (22.0% below list) — sets the bar for 1% rule.
Location & tenants
- Location reads 78/100 on livability (#23 in CO, #2,639 nationally) — a middle-class / working-renter tenant base. Strengths: amenities A+, housing A+, health & safety A+; Watch: cost of living C-, crime F.
- El Paso County Colorado School District 49 (urban): math 27% / reading 47% proficiency, ranked #27 of 86 in CO (top 31%) — families likely to look elsewhere, expect single-tenant / working-renter base with shorter leases; only 17% free/reduced lunch — higher-income household profile.
- Zoned schools: Falcon Elementary School of Technology (math 24% / reading 24%, grade F, #606 of 966 statewide, top 65%, 257 students, 48% FRL); Falcon Middle School (math 17% / reading 37%, grade F, #154 of 270 statewide, top 59%, 937 students, 27% FRL); Falcon High School (math 32% / reading 67%, grade D, #115 of 381 statewide, top 34%, 1,248 students, 23% FRL) — zoned schools average 33% FRL vs 17% district-wide (16 pts higher); higher-poverty schools than district average — tighter screening recommended.
- Market conditions: Rents falling (-4.7%/yr); 223 active listings in the ZIP; 6 comparable units currently listed for rent nearby; rentals leasing fast (median 5d on market — plan ~1-2 weeks tenant-placement turnaround); high-income renter base; 3,906 units permitted in El Paso County in 2024 (872 in 5+ unit buildings).
- This rent is only 17% of the median local income ($164k/yr) — well below the 30% rent-burden line; pricing power to push rent on renewal without tenant pushback.
Forward outlook
- Local home prices are declining (-1.2%/yr); year-one equity from $3k of loan paydown is wiped out by about $5k of value loss. Plan a longer hold.
- El Paso County population projected at +28% by 2050 — long-run rental-demand tailwind backs the buy-and-hold thesis.
Negotiation context
- It's been on market 230 days — a 12% lower offer ($264k) is reasonable based on typical stale-listing flexibility.
Questions for the listing agent
- What do current leases actually rent for vs. the listed asking? Can we see a recent rent roll and the last 12 months of T-12 income?
- It's been on market 230 days. Have you received any prior offers? Is the seller open to a 22% concession, seller financing, or rate buy-down credit?
- What does the HOA fee cover, when was the last increase, and are there any pending special assessments or reserve-fund shortfalls?
- Why hasn't it sold? Are there any deal-killer items the seller is aware of (foundation, flood, title, zoning, code violations)?
- Is there a deadline driving the sale (1031 exchange, divorce, estate, relocation)? That informs how much negotiation room exists.
- Schools are B-rated — typically a magnet for longer-tenancy family renters. What's the average tenant stay here, and is there a school-zone premium baked into asking?
- Crime grade is F in this area — have there been break-ins, vandalism, or insurance claims at this property in the last 3 years? What carrier currently insures it and at what premium?
- The area grade is low — what's the realistic commute time and amenity access for the typical tenant pool here? Any planned neighborhood developments (good or bad) we should know about?
- What's the average days-on-market for RENTAL listings here right now (not sales)? A rising rental-DOM trend means longer vacancies and softer asking-rent achievability than the comps imply.
- What's the recent tenant-quality profile in this submarket — average credit score on applications, eviction rate, late-payment / NSF rate, and stable-employment percentage? A property-management company in the area should have these aggregated.
- How much new for-sale + rental construction is in the pipeline within 1–3 miles? Heavy new supply typically softens prices + rents 12–24 months out; constrained supply supports both.
Investment metrics
- 1% rule
- 0.60% ✗
- Cap rate
- 3.13%
- Cash-on-cash
- -11.31%
- DSCR
- 0.50
- GRM
- 13.9
CMA / ARV
- ARV (median comp)
- $390,356
- List price
- $299,990
- Delta
- -23.15%
- Verdict
- UNDERPRICED
- Comps
- 2 within 1.0 mi
Projected returns pro-forma
-1.24% appreciation · 0.0% rent growth · sell at horizon
- IRR
- -24.1%
- Equity multiple
- 0.03×
- Total profit
- $-105,822
- Equity at exit
- $89,829
- IRR
- -21.3%
- Equity multiple
- -0.60×
- Total profit
- $-174,921
- Equity at exit
- $90,629
Cash invested: $109,300 (down + closing). Projections, not guarantees.
Landlord ↔ Tenant lean methodology
- Overall (STATE)
- 38 Tenant-Leaning
- State Colorado
- 38 Tenant-Leaning · D+4
- County
- — inherits STATE
- City
- — inherits STATE
ZIP-level market 80927
- Home prices YoY
- -0.7%
- Rents YoY
- -4.7%
- Active inventory
- 223
- Price-to-rent
- 10.7×
Monthly cashflow live
- Estimated rent
- $2,339 high interval (Pro) →
- Mortgage (P&I)
- −$2,047
- Tax est. 1.5%
- −$488 /mo · $5,855/yr
- Insurance
- −$163
- HOA
- −$180
- Vacancy / Maint / Mgmt
- −$491
- Net cashflow
- $-1,030
Break-even live
Sensitivity live
| Price | -10% $-760 | -5% $-895 | +0% $-1,030 | +5% $-1,165 | +10% $-1,300 |
|---|---|---|---|---|---|
| Rent | -10% $-1,215 | -5% $-1,122 | +0% $-1,030 | +5% $-937 | +10% $-845 |
| Rate | -1.0pp $-833 | -0.5pp $-930 | base $-1,030 | +0.5pp $-1,131 | +1.0pp $-1,234 |
UW: 25.0% down · 7.5% · 30yr · 1.5% tax · 5.0% vac · 8.0% maint · 8.0% mgmt
Financing live
Cash to close
- Down payment
- $97,589
- Closing costs
- $11,711
- Reserves months
- —
- Total cash needed
- —
Loan-product check · same deal, 3 products live
Conventional
25% down · 7.5% · 30yr
- Down + closing
- —
- Monthly P&I
- —
- Monthly cashflow
- —
- DSCR
- —
- Eligible?
- —
Personal DTI + credit; lowest rate.
DSCR
20% down · 8.5% · 30yr
- Down + closing
- —
- Monthly P&I
- —
- Monthly cashflow
- —
- DSCR
- —
- Eligible?
- —
No personal income docs; deal must DSCR.
Hard money
10% down · 12.0% · 12mo
- Down + closing
- —
- Monthly P&I
- —
- Monthly cashflow
- —
- DSCR
- —
- Eligible?
- —
Short-term bridge; refi at stabilization.
Rent comps 6 comps
| Address | Beds | Baths | Sqft | Rent | $/sqft | DOM | Units | Dist |
|---|---|---|---|---|---|---|---|---|
| 9286 Henson Pl Colorado Springs, CO | 3.0 | 2.5 | 1400 | $2,200 | $1.57 | 4d | 1 | 0.12mi |
| 6087 Notch Top Way Colorado Springs, CO | 3.0 | 2.0 | 1436 | $2,315 | $1.61 | 4d | 1 | 0.37mi |
| 6027 Notch Top Way Colorado Springs, CO | 3.0 | 2.5 | 1450 | $2,400 | $1.66 | 4d | 1 | 0.38mi |
| 6031 Notch Top Way Colorado Springs, CO | 3.0 | 2.0 | 1436 | $2,475 | $1.72 | 23d | 1 | 0.39mi |
| 9454 Crosshaven Vw Colorado Springs, CO | 2.0 | 2.5 | 1280 | $1,975 | $1.54 | 4d | 1 | 0.71mi |
| 6463 Crossdrum Pt Colorado Springs, CO | 2.0 | 2.0 | 1280 | $2,150 | $1.68 | 12d | 1 | 0.77mi |
HOA detail
- Monthly dues
- $180 · $2,160/yr
- Likely covers
- poolgym
Listing history 18 events
-
2026-06-21days on market $299,990 Active 230 DOM
-
2026-06-18price $299,990 Active 227 DOM
-
2026-06-18days on market $324,990 Active 227 DOM
-
2026-06-17days on market $324,990 Active 226 DOM
-
2026-06-16days on market $324,990 Active 225 DOM
-
2026-06-15days on market $324,990 Active 224 DOM
-
2026-06-14days on market $324,990 Active 222 DOM
-
2026-06-13days on market $324,990 Active 221 DOM
-
2026-06-10days on market $324,990 Active 219 DOM
-
2026-06-09days on market $324,990 Active 218 DOM
-
2026-06-08days on market $324,990 Active 217 DOM
-
2026-06-07days on market $324,990 Active 216 DOM
-
2026-06-05days on market $324,990 Active 213 DOM
-
2026-06-03days on market $324,990 Active 212 DOM
-
2026-06-03days on market $324,990 Active 211 DOM
-
2026-06-01days on market $324,990 Active 210 DOM
-
2026-05-31days on market $324,990 Active 209 DOM
-
2025-11-03$324,990 Active 830-char remark
Show marketing remark (830 chars)
Let the Compass guide you home!. This bright and inviting duet-style home offers 3 bedrooms, 2 baths, and 1,008 square feet of efficient, well-balanced living across two levels. A spacious open-concept main floor connects the kitchen, dining, and great room areas for seamless everyday living. Upstairs, the primary suite includes a private bath and walk-in closet, while two additional bedrooms provide flexibility for family, guests, or a home office. With a 2-car garage, smart storage, and the added benefit of end-unit privacy, the Compass delivers everything you need in a home that fits your budget and your lifestyle. Enjoy access to Banning Lewis Ranch's incredible amenities, including parks, pools, fitness centers, award-winning schools, dog park, and miles of scenic trails, all within a vibrant, welcoming community.
ⓘ Source: listings_history table (triggers on properties + properties_extension) + one-shot
backfill from property_details.listing_events for pre-trigger history.
Nearby sold comps map
Loading sold comps map…
Walkable amenities ~0.75 mi
Loading nearby amenities…
Taxation est. · year 1
- Rental income
- $28,069
- − Mortgage interest
- −$21,866
- − Property taxes
- −$5,855
- − Insurance
- −$1,952
- − Repairs & maintenance
- −$2,246
- − Management
- −$2,246
- − HOA
- −$2,160
- − Depreciation
- −$11,356
- Taxable loss
- −$19,611
- Est. tax savings @ 24.0%
- +$4,707
- After-tax cash flow
- $-7,651/yr
For passive investors: Depreciation is non-cash, so a rental often shows a tax loss while cash-flowing — sheltering income. Rental losses are passive: they offset passive income freely, and up to $25,000/yr can offset ordinary (W-2) income if you actively participate and your MAGI is under $100k (phasing out to $0 by $150k); unused losses carry forward. On sale, claimed depreciation is recaptured at up to 25%, and gains may owe capital-gains tax (a 1031 exchange can defer both). Figures are a year-1 estimate at your 24.0% rate — not tax advice; consult a CPA.
Schools (NCES district)
- District
- El Paso County Colorado School District 49
- NCES district ID
- 0803870
- Math proficiency
- 27% ▼ -4.00%
- Reading proficiency
- 47% ▼ -1.00%
- Median HH income
- $75,604
- Composite
- 34.38/100
- National rank
- #5210
- State rank
- #27 of 86 in CO
Livability — Colorado Springs
- Score
- 78/100
- State rank
- #23
- US rank
- #2639
Category grades
Schools grade is shown separately in the Schools card above.
Census & demographics
- Census place
- Colorado Springs, CO
- County
- El Paso County · 689,348 people
- City population
- 555,783
- Metro
- Colorado Springs, CO
- Population (ZIP)
- 8,036
- Household income
- $163,803
- Rent vs Own
Population outlook (El Paso County) Hauer SSP2
- Today (2025)
- 768,926 people
- By 2030
- 815,739 · +6.1%
- By 2040
- 903,489 · +17.5%
- By 2050
- 981,204 · +27.6%
- By 2075
- 1,155,542 · +50.3%
- By 2100
- 1,202,070 · +56.3%
Race, ethnicity, and origin ACS 2023
- Neighborhood character
- Diverse neighborhood (Simpson 0.57)
- Race & ethnicity
- White 62% Hispanic / Latino 23% Two or more races 16% Black 4% Asian 2%
- Hispanic origin (detail)
- Mexican 13% Puerto Rican 1% Cuban 1%
- Common ancestry
- Italian 3% Romanian 3% Iranian 3%
- Foreign-born
- 3% · Canada, South Korea
- Languages at home
- 94% English-only · Spanish 3% Other Indo-European 1% French/Haitian/Cajun 1%
Political lean MEDSL · El Paso
- 2024 margin
- Lean R (+9.8) · D 43.8% · R 53.5% · Other 2.7%
- 2008→2024 swing
- +9.0pp toward D · 2008: -18.8pp · 2024: -9.8pp
- All cycles
- 2024: R+9.8 2020: R+10.8 2016: R+22.6 2012: R+21.4 2008: R+18.8
Not yet ingested
- Civics
- —
Market trends
- HPI YoY
- ▼ -1.24%
- Current HPI
- 176.9533
- Rent YoY
- ▼ -4.71%
- Metro
- Colorado Springs, CO
- State GDP YoY
- ▲ 1.95%
- F500 in state
- 14
Industry mix (Fortune 500 HQ in CO)
| Industry | F500 HQs | Revenue |
|---|---|---|
| Technology Distribution | 1 | $31B |
|
||
| Food / Agriculture | 1 | $18B |
|
||
| Packaging | 1 | $14B |
|
||
| Healthcare | 1 | $13B |
|
||
| Energy | 1 | $10B |
|
||
| Technology | 1 | $4B |
|
||
Price history
1 event — show timeline
- 2025-11-03 Listed $324,990 Zillow
Cash-flow waterfall
monthlySold comps — $/sqft
last 12 mo · ≤1 miLoading sold comps…