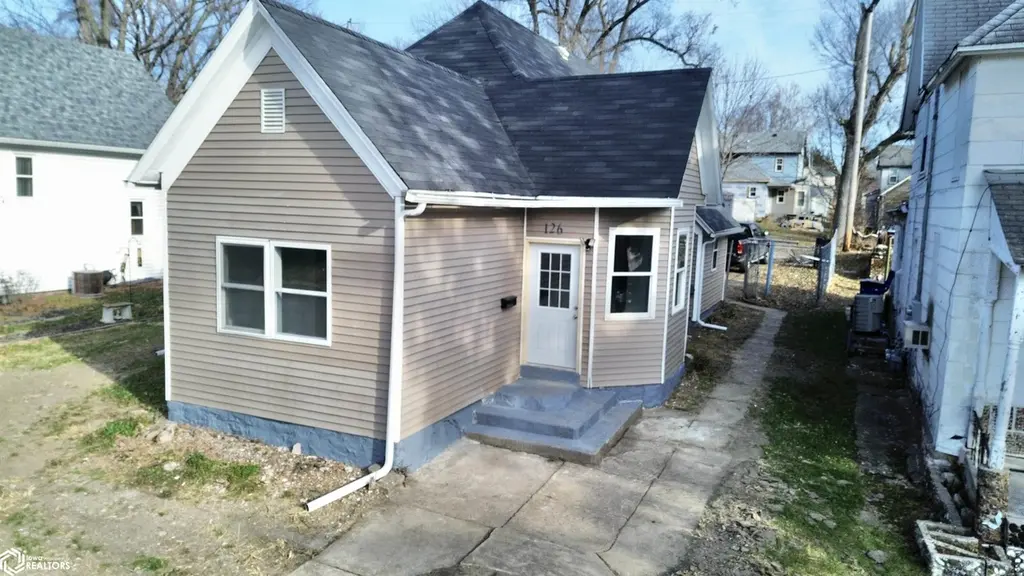
126 S Cooper Ave · Ottumwa, IA
Flood risk 1/10 · Minimal
- FEMA flood zone
- X (unshaded)
- Chance of flooding over 30 yrs
- 0.0%
- Est. flood insurance / yr
- $473 – $860
Fire risk 3/10 · Minor
- Est. fire insurance / yr
- $902 – $1,676
Heat risk 3/10 · Minor
- Hot days now (above 106°F)
- 7 days/yr
- Hot days in 30 yrs
- 15 days/yr
Wind risk 2/10 · Minimal
- Chance of severe wind over 30 yrs
- —
Air-quality risk 2/10 · Minimal
- Unhealthy air days now
- 1 days/yr
- Unhealthy air days in 30 yrs
- 1 days/yr
Risk factors via First Street. Map © Google.
Why this score? — see what drove the F grade
The composite is a weighted blend of 9 inputs, each scored 0–100. Each bar is that input's sub-score; the figure is the points it added to the 100-point composite (weight × sub-score).
- ARV discount +7.5/15.0
- Cash flow +6.2/30.0
- Schools +4.3/10.0
- Livability +4.0/5.0
- Rent growth +2.5/5.0
- Condition / age +2.5/5.0
- 1% rule +0.5/10.0
- DSCR +0.5/10.0
- Appreciation +0.0/10.0
$119,000
🖨 Deal sheet 📄 Offer letter ✓ Due diligence
Listing remarks MLS
Welcome to this affordable turnkey home in Ottumwa, IA featuring 3 bedrooms, over 1,400 square feet of living space, and numerous recent updates throughout. This move-in-ready property includes stainless steel appliances, central A/C, and private parking in the backyard. Major improvements include updated wiring, plumbing, roof, windows, kitchen cabinetry, and a renovated bathroom providing peace of mind for years to come. With spacious living and modern upgrades, this home is a great opportunity for homeowners or investors alike. Call and tour today!
Key facts
- Finished attic
- Partial basement
- Updated kitchen
Tags
Neighborhood map
What this means for you Summary
Snapshot
- This is a 2-bed/1.0-bath single-family listed at $119k.
Deal economics
- At list price, monthly cash flow is $-215 ($-3k/yr) — negative.
- To cash-flow at today's rent, offer at most $81k (32.0% below list).
- To meet the 1% rule (rent ≥ 1% of price), the offer needs to be $65k (45.4% below list).
- Recommended offer: $65k (45.4% below list) — sets the bar for 1% rule.
- Cap rate 4.1% vs local median 5.9% in Ottumwa — below-typical yield; the buyer is paying a premium for something (appreciation thesis, condition, location) that the cap rate doesn't capture.
Location & tenants
- Location reads 80/100 on livability (#91 in IA, #1,900 nationally) — a professional / high-income tenant draw. Strengths: cost of living A+, housing A+, health & safety A+; Watch: crime D-, employment D-.
- Ottumwa Community School District (town): math 50% / reading 54% proficiency, ranked #277 of 289 in IA (top 96%) — acceptable for families but not a draw, mixed tenant base, ~2y average lease.
- Market conditions: 186 active listings in the ZIP; 1 comparable units currently listed for rent nearby; 44 units permitted in Wapello County in 2024 (0 in 5+ unit buildings).
Forward outlook
- Local home prices are declining (-3.0%/yr); year-one equity from $823 of loan paydown is wiped out by about $4k of value loss. Plan a longer hold.
- Wapello County population projected at +5% by 2050 — modest demand growth; plan on rents tracking national, not racing it.
Negotiation context
- It's been on market 202 days — a 12% lower offer ($105k) is reasonable based on typical stale-listing flexibility.
Risks & watch-outs
- Watch-outs: built in 1890 — expect roof / HVAC / electrical / plumbing capex.
Questions for the listing agent
- What do current leases actually rent for vs. the listed asking? Can we see a recent rent roll and the last 12 months of T-12 income?
- It's been on market 202 days. Have you received any prior offers? Is the seller open to a 45% concession, seller financing, or rate buy-down credit?
- Built in 1890 — when were the roof, HVAC, electrical panel, plumbing, and water heater last replaced?
- Why hasn't it sold? Are there any deal-killer items the seller is aware of (foundation, flood, title, zoning, code violations)?
- Is there a deadline driving the sale (1031 exchange, divorce, estate, relocation)? That informs how much negotiation room exists.
- Crime grade is D in this area — have there been break-ins, vandalism, or insurance claims at this property in the last 3 years? What carrier currently insures it and at what premium?
- The area grade is low — what's the realistic commute time and amenity access for the typical tenant pool here? Any planned neighborhood developments (good or bad) we should know about?
- What's the average days-on-market for RENTAL listings here right now (not sales)? A rising rental-DOM trend means longer vacancies and softer asking-rent achievability than the comps imply.
- What's the recent tenant-quality profile in this submarket — average credit score on applications, eviction rate, late-payment / NSF rate, and stable-employment percentage? A property-management company in the area should have these aggregated.
- How much new for-sale + rental construction is in the pipeline within 1–3 miles? Heavy new supply typically softens prices + rents 12–24 months out; constrained supply supports both.
Investment metrics
- 1% rule
- 0.55% ✗
- Cap rate
- 4.12%
- Cash-on-cash
- -7.76%
- DSCR
- 0.65
- GRM
- 15.3
CMA / ARV
- ARV (median comp)
- $73,287
- List price
- $119,000
- Delta
- 62.37%
- Verdict
- OVERPRICED
- Comps
- 20 within 1.0 mi
Show comp detail 9 sales within ~0.75 mi
| Address | Dist | Beds/Ba | Sqft | Sold | Price | $/sf | Match |
|---|---|---|---|---|---|---|---|
| 1318 Locust St | 0.16mi | 2/2.0 | 1,538 (-11%) | 13mo | $143,000 | $93 | 60 |
| 721 N Ash St | 0.56mi | 3/1.0 (+1) | 1,800 (+4%) | 5mo | $55,000 | $31 | 58 |
| 146 S Cooper Ave | 0.05mi | 3/1.0 (+1) | 1,948 (+13%) | 20mo | $110,697 | $57 | 54 |
| 225 Freitag St | 0.48mi | 3/1.0 (+1) | 1,528 (-11%) | 4mo | $53,000 | $35 | 50 |
| 1327 E 4th St | 0.31mi | 3/1.0 (+1) | 1,595 (-8%) | 22mo | $70,500 | $44 | 50 |
| 709 E Second | 0.30mi | 3/1.0 (+1) | 1,492 (-14%) | 17mo | $58,000 | $39 | 44 |
| 513 Camille St | 0.74mi | 3/1.5 (+1) | 1,898 (+10%) | 4mo | $12,000 | $6 | 38 |
| 718 N Ash St | 0.55mi | 2/1.5 | 1,525 (-12%) | 22mo | $40,000 | $26 | 35 |
| 2201 E Main St | 0.72mi | 3/1.5 (+1) | 1,932 (+12%) | 12mo | $116,000 | $60 | 29 |
Match score weights: distance 35% · size 25% · config 20% · recency 20%. Top-matched comps best support the ARV.
Projected returns pro-forma
-3.0% appreciation · 3.0% rent growth · sell at horizon
- IRR
- -30.0%
- Equity multiple
- 0.01×
- Total profit
- $-33,054
- Equity at exit
- $17,743
- IRR
- -31.6%
- Equity multiple
- -0.40×
- Total profit
- $-46,647
- Equity at exit
- $10,289
Cash invested: $33,320 (down + closing). Projections, not guarantees.
Landlord ↔ Tenant lean methodology
- Overall (STATE)
- 83 Strongly Landlord-Friendly
- State Iowa
- 83 Strongly Landlord-Friendly · R+6
- County
- — inherits STATE
- City
- — inherits STATE
ZIP-level market 52501
- Active inventory
- 186
- Price-to-rent
- 15.3×
Monthly cashflow live
- Estimated rent
- $650 medium interval (Pro) →
- Mortgage (P&I)
- −$624
- Tax from tax record
- −$55 /mo · $664/yr
- Insurance
- −$50
- HOA
- −$0
- Vacancy / Maint / Mgmt
- −$136
- Net cashflow
- $-215
Break-even live
UW: 25.0% down · 7.5% · 30yr · 1.5% tax · 5.0% vac · 8.0% maint · 8.0% mgmt
Financing live
Cash to close
- Down payment
- $29,750
- Closing costs
- $3,570
- Reserves months
- —
- Total cash needed
- —
Loan-product check · same deal, 3 products live
Conventional
25% down · 7.5% · 30yr
- Down + closing
- —
- Monthly P&I
- —
- Monthly cashflow
- —
- DSCR
- —
- Eligible?
- —
Personal DTI + credit; lowest rate.
DSCR
20% down · 8.5% · 30yr
- Down + closing
- —
- Monthly P&I
- —
- Monthly cashflow
- —
- DSCR
- —
- Eligible?
- —
No personal income docs; deal must DSCR.
Hard money
10% down · 12.0% · 12mo
- Down + closing
- —
- Monthly P&I
- —
- Monthly cashflow
- —
- DSCR
- —
- Eligible?
- —
Short-term bridge; refi at stabilization.
Rent comps 1 comps
| Address | Beds | Baths | Sqft | Rent | $/sqft | DOM | Units | Dist |
|---|---|---|---|---|---|---|---|---|
| 951 N Court St Ottumwa, IA | 2.0 | 1.0 | 1900 | $650 | $0.34 | 43d | 1 | 1.36mi |
Listing history 17 events
-
2026-06-18days on market $119,000 Active 202 DOM
-
2026-06-17days on market $119,000 Active 201 DOM
-
2026-06-16days on market $119,000 Active 200 DOM
-
2026-06-15days on market $119,000 Active 199 DOM
-
2026-06-13days on market $119,000 Active 197 DOM
-
2026-06-12days on market $119,000 Active 196 DOM
-
2026-06-09days on market $119,000 Active 193 DOM
-
2026-06-08days on market $119,000 Active 192 DOM
-
2026-06-07days on market $119,000 Active 191 DOM
-
2026-06-07days on market $119,000 Active 190 DOM
-
2026-06-04days on market $119,000 Active 187 DOM
-
2026-06-02days on market $119,000 Active 186 DOM
-
2026-06-01days on market $119,000 Active 185 DOM
-
2026-05-31days on market $119,000 Active 184 DOM
-
2026-05-31days on market $119,000 Active 183 DOM
-
2026-03-06price $119,000 557-char remark
Show marketing remark (557 chars)
Welcome to this affordable turnkey home in Ottumwa, IA featuring 3 bedrooms, over 1,400 square feet of living space, and numerous recent updates throughout. This move-in-ready property includes stainless steel appliances, central A/C, and private parking in the backyard. Major improvements include updated wiring, plumbing, roof, windows, kitchen cabinetry, and a renovated bathroom providing peace of mind for years to come. With spacious living and modern upgrades, this home is a great opportunity for homeowners or investors alike. Call and tour today!
-
2025-11-28$129,000 Active 557-char remark
Show marketing remark (557 chars)
Welcome to this affordable turnkey home in Ottumwa, IA featuring 3 bedrooms, over 1,400 square feet of living space, and numerous recent updates throughout. This move-in-ready property includes stainless steel appliances, central A/C, and private parking in the backyard. Major improvements include updated wiring, plumbing, roof, windows, kitchen cabinetry, and a renovated bathroom providing peace of mind for years to come. With spacious living and modern upgrades, this home is a great opportunity for homeowners or investors alike. Call and tour today!
ⓘ Source: listings_history table (triggers on properties + properties_extension) + one-shot
backfill from property_details.listing_events for pre-trigger history.
Tax reassessment forecast IA · Partial reset (capped growth)
- Current annual tax
- $664 · $55/mo
- Projected year-2 tax
- $1,266 · $106/mo
- Expected delta
- +$602/yr (+$50/mo · 90.7%)
ⓘ Screening estimate from a state-policy table — verify with the county assessor before closing.
Climate risk First Street
- Flood 1/10 Low FEMA zone X (unshaded) · 0% chance over 30 yrs
- Wildfire 3/10 Moderate
- Heat 3/10 Moderate 7 d/yr ≥106°F today · 15 d/yr by 30 yrs out
- Wind 2/10 Low
- Air quality 2/10 Low 1 unhealthy d/yr today · 1 by 30 yrs out
Nearby sold comps map
Loading sold comps map…
Walkable amenities ~0.75 mi
Loading nearby amenities…
Taxation est. · year 1
- Rental income
- $7,800
- − Mortgage interest
- −$6,666
- − Property taxes
- −$664
- − Insurance
- −$595
- − Repairs & maintenance
- −$624
- − Management
- −$624
- − Depreciation
- −$3,462
- Taxable loss
- −$4,835
- Est. tax savings @ 24.0%
- +$1,160
- After-tax cash flow
- $-1,425/yr
For passive investors: Depreciation is non-cash, so a rental often shows a tax loss while cash-flowing — sheltering income. Rental losses are passive: they offset passive income freely, and up to $25,000/yr can offset ordinary (W-2) income if you actively participate and your MAGI is under $100k (phasing out to $0 by $150k); unused losses carry forward. On sale, claimed depreciation is recaptured at up to 25%, and gains may owe capital-gains tax (a 1031 exchange can defer both). Figures are a year-1 estimate at your 24.0% rate — not tax advice; consult a CPA.
Schools (NCES district)
- District
- Ottumwa Community School District
- NCES district ID
- 1922110
- Math proficiency
- 50% ▼ -9.00%
- Reading proficiency
- 54% ▲ 1.00%
- Median HH income
- $39,864
- Composite
- 43.46/100
- National rank
- #3004
- State rank
- #277 of 289 in IA
Livability — Ottumwa
- Score
- 80/100
- State rank
- #91
- US rank
- #1900
Category grades
Schools grade is shown separately in the Schools card above.
Census & demographics
- Census place
- Ottumwa, IA
- Population (ZIP)
- 30,341
Population outlook (Wapello County) Hauer SSP2
- Today (2025)
- 35,472 people
- By 2030
- 35,563 · +0.3%
- By 2040
- 36,083 · +1.7%
- By 2050
- 37,287 · +5.1%
- By 2075
- 43,898 · +23.8%
- By 2100
- 52,973 · +49.3%
Race, ethnicity, and origin ACS 2023
- Neighborhood character
- Predominantly White (74%)
- Race & ethnicity
- White 74% Hispanic / Latino 14% Two or more races 7% Black 4% Pacific Islander 2% Asian 2%
- Hispanic origin (detail)
- Mexican 9%
- Common ancestry
- Iranian 4% Italian 1% Slovak 1%
- Foreign-born
- 11% · Canada
- Languages at home
- 84% English-only · Spanish 10% Other Asian/Pacific 3% Tagalog/Filipino 1%
Political lean MEDSL · Wapello
- 2024 margin
- Solid R (+31.4) · D 33.6% · R 65.0% · Other 1.4%
- 2008→2024 swing
- -45.0pp toward R · 2008: 13.5pp · 2024: -31.4pp
- All cycles
- 2024: R+31.4 2020: R+23.6 2016: R+20.8 2012: D+11.8 2008: D+13.5
Not yet ingested
- Civics
- —
Market trends
- HPI YoY
- ▼ -94.66%
- Current HPI
- 174.6021
- Rent YoY
- —
- Metro
- —
- State GDP YoY
- ▲ 2.48%
- F500 in state
- 4
Industry mix (Fortune 500 HQ in IA)
| Industry | F500 HQs | Revenue |
|---|---|---|
| Financial Services | 1 | $16B |
|
||
| Retail / Convenience | 1 | $15B |
|
||
Price history
-7.8% since first listed2 events — show timeline
- 2026-03-06 Price Changed $119,000 IAR
- 2025-11-28 Listed $129,000 IAR
Property tax history
-1.8%/yrLatest (2025): $664 · +5.1% YoY. Source: county tax records.
Cash-flow waterfall
monthlySold comps — $/sqft
last 12 mo · ≤1 miLoading sold comps…