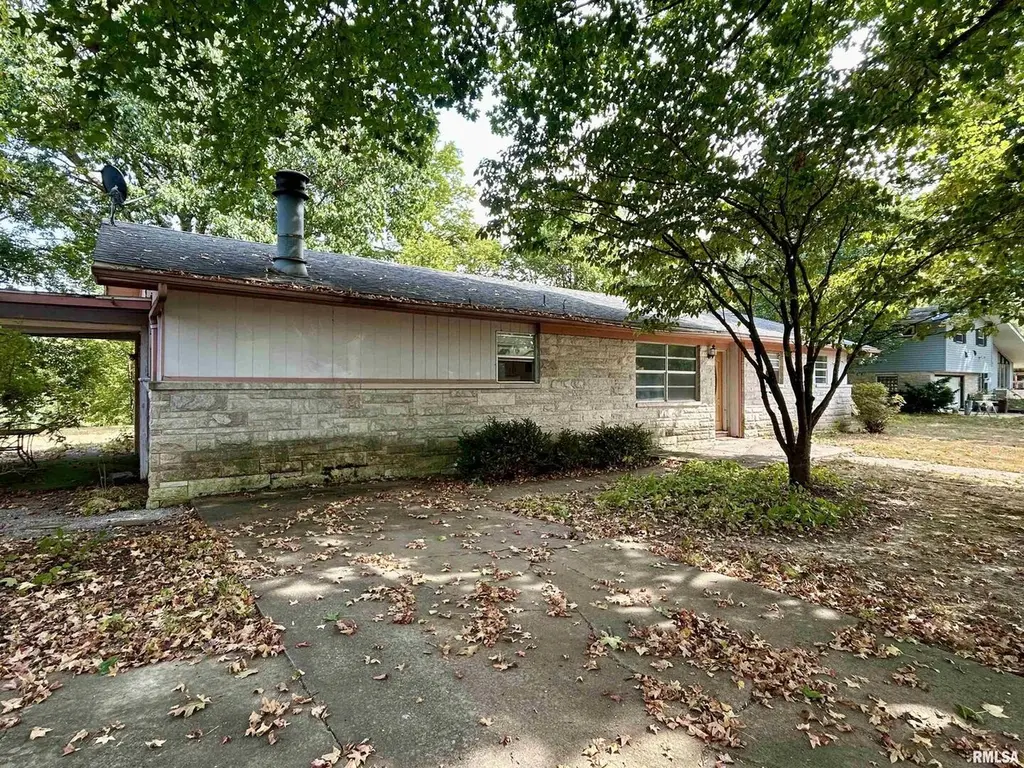
1378 Skelcher Blvd · Makanda, IL
Flood risk 1/10 · Minimal
- FEMA flood zone
- X (unshaded)
- Chance of flooding over 30 yrs
- 0.0%
- Est. flood insurance / yr
- $507 – $1,088
Fire risk 3/10 · Minor
- Est. fire insurance / yr
- $804 – $1,492
Heat risk 5/10 · Moderate
- Hot days now (above 107°F)
- 7 days/yr
- Hot days in 30 yrs
- 21 days/yr
Wind risk 2/10 · Minimal
- Chance of severe wind over 30 yrs
- 3.0%
Air-quality risk 2/10 · Minimal
- Unhealthy air days now
- 0 days/yr
- Unhealthy air days in 30 yrs
- 2 days/yr
Risk factors via First Street. Map © Google.
Why this score? — see what drove the C grade
The composite is a weighted blend of 9 inputs, each scored 0–100. Each bar is that input's sub-score; the figure is the points it added to the 100-point composite (weight × sub-score).
- Cash flow +15.8/30.0
- ARV discount +15.0/15.0
- Appreciation +7.1/10.0
- 1% rule +5.7/10.0
- DSCR +4.9/10.0
- Livability +3.2/5.0
- Rent growth +2.5/5.0
- Condition / age +2.5/5.0
- Schools +2.4/10.0
$112,500
🖨 Deal sheet 📄 Offer letter ✓ Due diligence
Listing remarks
Wake up to lake views. Wind down by the fire. Repeat. Welcome to 1378 Skelcher-your private retreat just outside Makanda, where nature, comfort, and opportunity come together. This 3-bedroom, 2-bath home in the desirable Giant City School District offers a rare chance to create something truly special in a setting that already has it all. Inside, the home feels instantly welcoming, with a cozy wood-burning fireplace that anchors the living space and invites you to slow down. The breezeway adds both charm and practicality, connecting you to a 2-car garage with ease. For those with vision, a few updates and upgrades could dramatically enhance both style and value-making this an ideal opportun
Key facts
- Little grassy lake
- Lake views
- Breezeway
Tags
Neighborhood map
What this means for you Summary
Snapshot
- This is a 3-bed/2.0-bath other listed at $112k.
Deal economics
- At list price, monthly cash flow is $51 ($613/yr) — positive.
- The deal already cash-flows at list — no discount required.
- Meets the 1% rule at list price ($1k rent vs $112k).
- Recommended offer: $99k (12.0% below list) — sets the bar for market timing.
Location & tenants
- Location reads 63/100 on livability (#757 in IL) — a middle-class / working-renter tenant base. Strengths: cost of living A+, housing A+, employment A-; Watch: schools C-, amenities F, commute F.
- Carbondale Chsd 165 (urban): math 26% / reading 35% proficiency, ranked #279 of 620 in IL (top 45%) — families likely to look elsewhere, expect single-tenant / working-renter base with shorter leases.
- Market conditions: 33 active listings in the ZIP; 130 units permitted in Williamson County in 2024 (5 in 5+ unit buildings).
Forward outlook
- In year one you build about $6k of equity ($778 loan paydown + $5k appreciation (4.3% local appreciation)).
- At projected returns (4.3% appreciation + 3.0% rent growth), your $32k cash investment doubles in ~5 years — after that, you're playing with house money.
- By year 7, paydown + projected appreciation supports a ~$36k cash-out refi (75% LTV) — recoverable capital for the next deal without selling this one.
Negotiation context
- It's been on market 146 days — a 12% lower offer ($99k) is reasonable based on typical stale-listing flexibility.
- 5 sale attempts since 3y ago; this cycle's ask is 9275% above the opening price — seller raised mid-cycle; expect resistance to lowballs.
- Current owner paid $40k; list at $112k implies a 181% gain — meaningful room to come down on a strong offer.
Risks & watch-outs
- Watch-outs: property tax is 2.8% of price.
- Climate carrying-cost: extreme-heat days projected 7→21/yr by 2055 (HVAC capex compounding) — expect insurance premiums to compound above CPI over the hold.
Questions for the listing agent
- It's been on market 146 days. Have you received any prior offers? Is the seller open to a 12% concession, seller financing, or rate buy-down credit?
- Built in 1968 — when were the roof, HVAC, electrical panel, plumbing, and water heater last replaced?
- Property tax is high relative to price — has the assessment been appealed recently, and will the sale trigger a re-assessment?
- Why hasn't it sold? Are there any deal-killer items the seller is aware of (foundation, flood, title, zoning, code violations)?
- Is there a deadline driving the sale (1031 exchange, divorce, estate, relocation)? That informs how much negotiation room exists.
- What's the average days-on-market for RENTAL listings here right now (not sales)? A rising rental-DOM trend means longer vacancies and softer asking-rent achievability than the comps imply.
- What's the recent tenant-quality profile in this submarket — average credit score on applications, eviction rate, late-payment / NSF rate, and stable-employment percentage? A property-management company in the area should have these aggregated.
- How much new for-sale + rental construction is in the pipeline within 1–3 miles? Heavy new supply typically softens prices + rents 12–24 months out; constrained supply supports both.
Investment metrics
- 1% rule
- 1.07% ✓
- Cap rate
- 6.84%
- Cash-on-cash
- 1.95%
- DSCR
- 1.09
- GRM
- 7.8
CMA / ARV
- ARV (median comp)
- $208,682
- List price
- $112,500
- Delta
- -46.09%
- Verdict
- UNDERPRICED
- Comps
- 4 within 2.0 mi
Projected returns pro-forma
4.27% appreciation · 3.0% rent growth · sell at horizon
- IRR
- 12.7%
- Equity multiple
- 1.78×
- Total profit
- $24,647
- Equity at exit
- $58,829
- IRR
- 14.0%
- Equity multiple
- 3.36×
- Total profit
- $74,271
- Equity at exit
- $97,677
Cash invested: $31,500 (down + closing). Projections, not guarantees.
Landlord ↔ Tenant lean methodology
- Overall (STATE)
- 43 Moderately Tenant-Leaning
- State Illinois
- 43 Moderately Tenant-Leaning · D+7
- County
- — inherits STATE
- City
- — inherits STATE
ZIP-level market 62958
- Home prices YoY
- 3.4%
- Active inventory
- 33
- Price-to-rent
- 7.8×
Monthly cashflow live
- Estimated rent
- $1,199 medium interval (Pro) →
- Mortgage (P&I)
- −$590
- Tax from tax record
- −$259 /mo · $3,108/yr
- Insurance
- −$47
- HOA
- −$0
- Vacancy / Maint / Mgmt
- −$252
- Net cashflow
- $51
Break-even live
UW: 25.0% down · 7.5% · 30yr · 1.5% tax · 5.0% vac · 8.0% maint · 8.0% mgmt
Financing live
Cash to close
- Down payment
- $28,125
- Closing costs
- $3,375
- Reserves months
- —
- Total cash needed
- —
Loan-product check · same deal, 3 products live
Conventional
25% down · 7.5% · 30yr
- Down + closing
- —
- Monthly P&I
- —
- Monthly cashflow
- —
- DSCR
- —
- Eligible?
- —
Personal DTI + credit; lowest rate.
DSCR
20% down · 8.5% · 30yr
- Down + closing
- —
- Monthly P&I
- —
- Monthly cashflow
- —
- DSCR
- —
- Eligible?
- —
No personal income docs; deal must DSCR.
Hard money
10% down · 12.0% · 12mo
- Down + closing
- —
- Monthly P&I
- —
- Monthly cashflow
- —
- DSCR
- —
- Eligible?
- —
Short-term bridge; refi at stabilization.
Listing history 34 events
-
2026-06-19days on market $112,500 Active 146 DOM
-
2026-06-18days on market $112,500 Active 145 DOM
-
2026-06-17days on market $112,500 Active 144 DOM
-
2026-06-16days on market $112,500 Active 143 DOM
-
2026-06-15days on market $112,500 Active 142 DOM
-
2026-06-14days on market $112,500 Active 140 DOM
-
2026-06-13days on market $112,500 Active 139 DOM
-
2026-06-10days on market $112,500 Active 137 DOM
-
2026-06-09days on market $112,500 Active 136 DOM
-
2026-06-08days on market $112,500 Active 135 DOM
-
2026-06-07days on market $112,500 Active 134 DOM
-
2026-06-05days on market $112,500 Active 131 DOM
-
2026-06-02days on market $112,500 Active 129 DOM
-
2026-06-01days on market $112,500 Active 128 DOM
-
2026-05-31days on market $112,500 Active 127 DOM
-
2026-05-30days on market $112,500 Active 126 DOM
-
2026-04-24status Active
-
2026-03-18historical
-
2026-01-06historical
-
2025-12-10price
-
2025-09-20Active
-
2024-07-01status Active
-
2024-07-01historical
-
2024-07-01historical
-
2024-06-27historical
-
2024-03-30historical $1,200
-
2024-01-18$1,200
-
2023-06-27Active
-
2022-07-29price $1,195
-
2021-08-06historical
-
2021-08-06historical
-
2021-08-06historical
-
2021-08-06historical
-
1984-05-26soldstatus $40,000
ⓘ Source: listings_history table (triggers on properties + properties_extension) + one-shot
backfill from property_details.listing_events for pre-trigger history.
Tax reassessment forecast IL · Partial reset (capped growth)
- Current annual tax
- $3,108 · $259/mo
- Projected year-2 tax
- $3,108 · $259/mo
- Expected delta
- $0/yr ($0/mo · 0.0%)
ⓘ Screening estimate from a state-policy table — verify with the county assessor before closing.
Climate risk First Street
- Flood 1/10 Low FEMA zone X (unshaded) · 0% chance over 30 yrs
- Wildfire 3/10 Moderate
- Heat 5/10 Major 7 d/yr ≥107°F today · 21 d/yr by 30 yrs out
- Wind 2/10 Low 3% chance of damaging wind over 30 yrs
- Air quality 2/10 Low 0 unhealthy d/yr today · 2 by 30 yrs out
Nearby sold comps map
Loading sold comps map…
Walkable amenities ~0.75 mi
Loading nearby amenities…
Taxation est. · year 1
- Rental income
- $14,383
- − Mortgage interest
- −$6,302
- − Property taxes
- −$3,108
- − Insurance
- −$562
- − Repairs & maintenance
- −$1,151
- − Management
- −$1,151
- − Depreciation
- −$3,273
- Taxable loss
- −$1,163
- Est. tax savings @ 24.0%
- +$279
- After-tax cash flow
- $892/yr
For passive investors: Depreciation is non-cash, so a rental often shows a tax loss while cash-flowing — sheltering income. Rental losses are passive: they offset passive income freely, and up to $25,000/yr can offset ordinary (W-2) income if you actively participate and your MAGI is under $100k (phasing out to $0 by $150k); unused losses carry forward. On sale, claimed depreciation is recaptured at up to 25%, and gains may owe capital-gains tax (a 1031 exchange can defer both). Figures are a year-1 estimate at your 24.0% rate — not tax advice; consult a CPA.
Schools (NCES district)
- District
- Carbondale Chsd 165
- NCES district ID
- 1708370
- Math proficiency
- 26% ▼ -10.00%
- Reading proficiency
- 35% ▼ -2.00%
- Median HH income
- $22,075
- Composite
- 23.92/100
- National rank
- #7787
- State rank
- #279 of 620 in IL
Livability — Makanda
- Score
- 63/100
- State rank
- #757
- US rank
- #15308
Category grades
Schools grade is shown separately in the Schools card above.
Census & demographics
- Population (ZIP)
- 2,069
Population outlook (Williamson County) Hauer SSP2
- Today (2025)
- 69,553 people
- By 2030
- 70,090 · +0.8%
- By 2040
- 70,345 · +1.1%
- By 2050
- 69,394 · -0.2%
- By 2075
- 63,590 · -8.6%
- By 2100
- 51,154 · -26.5%
Race, ethnicity, and origin ACS 2023
- Neighborhood character
- Predominantly White (91%)
- Race & ethnicity
- White 91% Asian 3% Black 3% Two or more races 2% Hispanic / Latino 1%
- Common ancestry
- Serbian 6% Romanian 3% Scotch-Irish 2%
- Foreign-born
- 4% · China
- Languages at home
- 96% English-only · Russian/Polish/Slavic 1% Other Indo-European 1% Chinese 1%
Political lean MEDSL · Williamson
- 2024 margin
- Solid R (+38.8) · D 30.0% · R 68.8% · Other 1.3%
- 2008→2024 swing
- -24.0pp toward R · 2008: -14.8pp · 2024: -38.8pp
- All cycles
- 2024: R+38.8 2020: R+37.3 2016: R+41.2 2012: R+25.0 2008: R+14.8
Not yet ingested
- Civics
- —
Market trends
- HPI YoY
- ▲ 4.27%
- Current HPI
- 128.5264
- Rent YoY
- —
- Metro
- —
- State GDP YoY
- ▲ 1.59%
- F500 in state
- 60
Industry mix (Fortune 500 HQ in IL)
| Industry | F500 HQs | Revenue |
|---|---|---|
| Insurance | 4 | $201B |
|
||
| Consumer Goods | 4 | $87B |
|
||
| Industrial Machinery | 3 | $64B |
|
||
| Healthcare | 2 | $55B |
|
||
| Retail / Pharmacy | 1 | $148B |
|
||
| Agriculture / Food | 1 | $86B |
|
||
Price history
-97.0% since first listed18 events — show timeline
- 2026-04-24 Relisted — MRED as Distributed by MLS Grid
- 2026-03-18 Listing Removed — MRED as Distributed by MLS Grid
- 2026-01-06 Listing Removed — RMLSA as Distributed by MLS Grid
- 2025-12-10 Price Changed — RMLSA as Distributed by MLS Grid
- 2025-09-20 Listed — RMLSA as Distributed by MLS Grid
- 2024-07-01 Relisted — RMLSA as Distributed by MLS Grid
- 2024-07-01 Listing Removed — MRED as Distributed by MLS Grid
- 2024-07-01 Listing Removed — RMLSA as Distributed by MLS Grid
- 2024-06-27 Listing Removed — RMLSA as Distributed by MLS Grid
- 2024-03-30 Rental Removed $1,200 APPFOLIO
- 2024-01-18 Listed for Rent $1,200 APPFOLIO
- 2023-06-27 Listed — RMLSA as Distributed by MLS Grid
- 2022-07-29 Price Changed $1,195 APPFOLIO
- 2021-08-06 Listing Removed — RMLSA as Distributed by MLS Grid
- 2021-08-06 Listing Removed — RMLSA as Distributed by MLS Grid
- 2021-08-06 Listing Removed — RMLSA as Distributed by MLS Grid
- 2021-08-06 Listing Removed — RMLSA as Distributed by MLS Grid
- 1984-05-26 Sold (Public Records) $40,000 Public Records
Property tax history
+10.6%/yrLatest (2025): $3,108 · +13.9% YoY. Source: county tax records.
Cash-flow waterfall
monthlySold comps — $/sqft
last 12 mo · ≤1 miLoading sold comps…