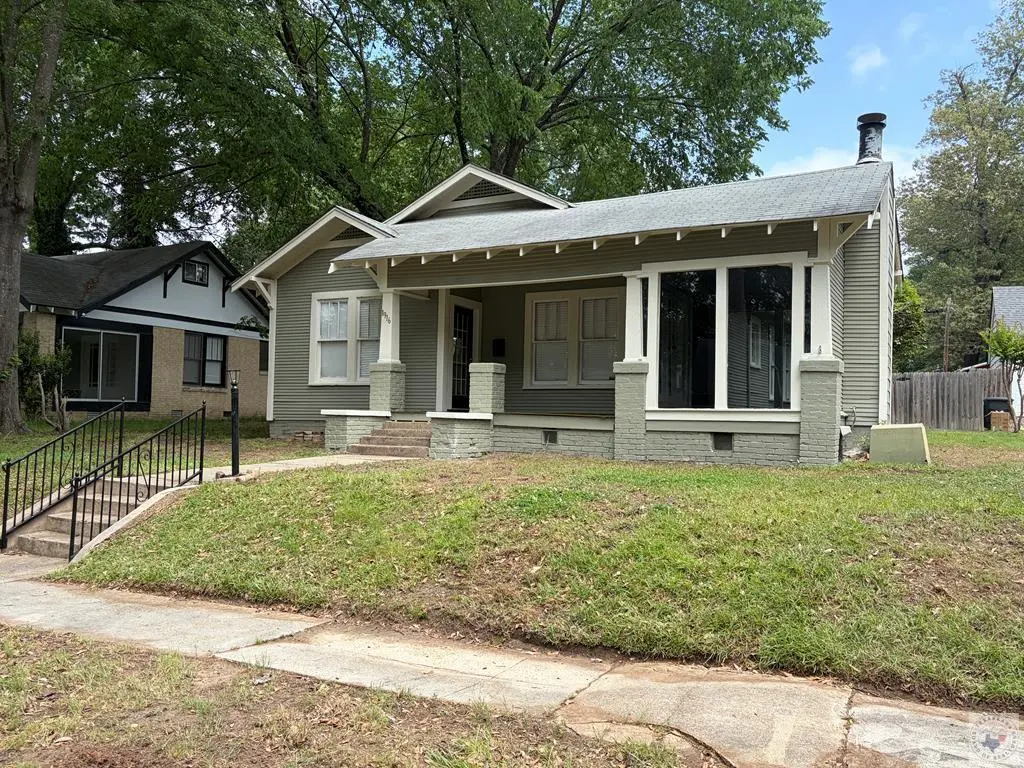
1916 Laurel St · Texarkana, AR
Flood risk 1/10 · Minimal
- FEMA flood zone
- X (unshaded)
- Chance of flooding over 30 yrs
- 0.0%
- Est. flood insurance / yr
- $507 – $1,088
Fire risk 1/10 · Minimal
- Est. fire insurance / yr
- $1,499 – $2,785
Heat risk 7/10 · Major
- Hot days now (above 112°F)
- 7 days/yr
- Hot days in 30 yrs
- 22 days/yr
Wind risk 4/10 · Minor
- Chance of severe wind over 30 yrs
- 24.0%
Air-quality risk 2/10 · Minimal
- Unhealthy air days now
- 0 days/yr
- Unhealthy air days in 30 yrs
- 1 days/yr
Risk factors via First Street. Map © Google.
Why this score? — see what drove the D grade
The composite is a weighted blend of 9 inputs, each scored 0–100. Each bar is that input's sub-score; the figure is the points it added to the 100-point composite (weight × sub-score).
- Cash flow +17.5/30.0
- ARV discount +5.9/15.0
- DSCR +5.5/10.0
- 1% rule +3.7/10.0
- Livability +3.2/5.0
- Rent growth +2.5/5.0
- Condition / age +2.5/5.0
- Schools +2.1/10.0
- Appreciation +0.0/10.0
$148,000
🖨 Deal sheet 📄 Offer letter ✓ Due diligence
Listing remarks
Historic district home with a covered front porch and a fresh coat of paint! This home offers plenty of living space, including a second living area with picture windows that would make a great office or flex space, as well as a formal dining room. It features abundant natural light, a privacy-fenced backyard, and ample parking in the rear near the alley. The home was recently rented for $1,500 per month.
Key facts
- Covered front porch
- Formal dining room
- Ample parking
Tags
Property features AI
Finance
- Other: Subdivision: Arnolds 2nd; Directions: Turn left onto E 20th St from N Stateline Ave then right on Laurel
Exterior
- Parking: Parking pad; Open parking
- Utilities: Public water; Public sewer; Cable available
- Home design: Single family residence; One story; Residential property
- Construction: Wood siding exterior; Composition roof; Pillar/Post/Pier foundation; Built as single-family residence
- Exterior features: Covered patio; Patio; Wood fencing; City street frontage
Interior
- Kitchen: Dishwasher; Gas cooktop; Gas range; Oven; Refrigerator
- Flooring: Vinyl
- Bathrooms: 2 full bathrooms
- Heating & cooling: Central heating; Central air conditioning
- Interior features: Breakfast bar
- Laundry & utility: Gas water heater
Neighborhood map
What this means for you Summary
Snapshot
- This is a 3-bed/2.0-bath single-family listed at $148k.
Deal economics
- At list price, monthly cash flow is $113 ($1k/yr) — positive.
- The deal already cash-flows at list — no discount required.
- To meet the 1% rule (rent ≥ 1% of price), the offer needs to be $129k (13.0% below list).
- Recommended offer: $129k (13.0% below list) — sets the bar for 1% rule.
- Cap rate 7.2% vs local median 4.5% in Texarkana — top-decile yield for the area; either an underpriced asset or a hidden risk that comps aren't pricing in. Stress-test before assuming the spread holds.
Location & tenants
- Location reads 64/100 on livability (#177 in AR) — a middle-class / working-renter tenant base. Strengths: cost of living A+, housing A+, health & safety A-; Watch: schools D, crime F, amenities F.
- Texarkana School District (suburban): math 27% / reading 24% proficiency, ranked #181 of 238 in AR (top 76%) — low school quality limits family demand, transient renter base, plan for 1-2y turnover; 64% free/reduced lunch — lower-income household profile, screen leases tightly.
- Market conditions: 273 active listings in the ZIP; 11 comparable units currently listed for rent nearby; rentals lingering (median 44d on market — plan ~5-8 weeks vacancy on turnover, expect pricing pressure); 100% of comp listings sitting > 30 days — soft ceiling on asking rent; 21 units permitted in Miller County in 2024 (0 in 5+ unit buildings).
- This rent runs 33% of the median local income ($47k/yr) — at the standard rent-burdened threshold; future hikes will face affordability resistance.
Forward outlook
- Local home prices are declining (-3.0%/yr); year-one equity from $1k of loan paydown is wiped out by about $4k of value loss. Plan a longer hold.
- Miller County population projected to shrink 7% by 2050 — rents likely to lag national; underwrite the cash flow, not the appreciation.
Negotiation context
- It's been on market 53 days — a 3% lower offer ($144k) is reasonable based on typical stale-listing flexibility.
- 3 sale attempts since 2y ago with the ask held roughly flat each time — persistent listings suggest the price (not the market) is what's stuck; bring a comps-based counter.
Risks & watch-outs
- Watch-outs: built in 1925 — expect roof / HVAC / electrical / plumbing capex.
- Climate carrying-cost: extreme-heat days projected 7→22/yr by 2055 (HVAC capex compounding) — expect insurance premiums to compound above CPI over the hold.
Questions for the listing agent
- It's been on market 53 days. Have you received any prior offers? Is the seller open to a 13% concession, seller financing, or rate buy-down credit?
- Built in 1925 — when were the roof, HVAC, electrical panel, plumbing, and water heater last replaced?
- Is there a deadline driving the sale (1031 exchange, divorce, estate, relocation)? That informs how much negotiation room exists.
- Schools are D-rated, which usually means shorter tenancies and higher turnover. Who's the typical renter profile here, and what's been the actual vacancy rate?
- Crime grade is F in this area — have there been break-ins, vandalism, or insurance claims at this property in the last 3 years? What carrier currently insures it and at what premium?
- The area grade is low — what's the realistic commute time and amenity access for the typical tenant pool here? Any planned neighborhood developments (good or bad) we should know about?
- What's the average days-on-market for RENTAL listings here right now (not sales)? A rising rental-DOM trend means longer vacancies and softer asking-rent achievability than the comps imply.
- What's the recent tenant-quality profile in this submarket — average credit score on applications, eviction rate, late-payment / NSF rate, and stable-employment percentage? A property-management company in the area should have these aggregated.
- How much new for-sale + rental construction is in the pipeline within 1–3 miles? Heavy new supply typically softens prices + rents 12–24 months out; constrained supply supports both.
Investment metrics
- 1% rule
- 0.87% ✗
- Cap rate
- 7.21%
- Cash-on-cash
- 3.28%
- DSCR
- 1.15
- GRM
- 9.6
CMA / ARV
- ARV (median comp)
- $142,813
- List price
- $148,000
- Delta
- 3.63%
- Verdict
- FAIR
- Comps
- 20 within 1.0 mi
Show comp detail 7 sales within ~0.75 mi
| Address | Dist | Beds/Ba | Sqft | Sold | Price | $/sf | Match |
|---|---|---|---|---|---|---|---|
| 1902 Hickory Street St | 0.35mi | 3/2.0 | 1,368 (-3%) | 15mo | $170,000 | $124 | 66 |
| 1823 Garland | 0.44mi | 3/1.5 | 1,426 (+1%) | 14mo | $99,000 | $69 | 65 |
| 1302 Hickory St | 0.52mi | 3/1.5 | 1,532 (+8%) | 6mo | $60,000 | $39 | 55 |
| 1200 Garland Ave | 0.66mi | 3/2.0 | 1,292 (-9%) | 2mo | $225,000 | $174 | 53 |
| 2501 Senator St | 0.67mi | 3/1.0 | 1,464 (+4%) | 8mo | $152,000 | $104 | 52 |
| 2122 Locust St | 0.43mi | 2/1.0 (-1) | 1,232 (-13%) | 2mo | $102,200 | $83 | 48 |
| 1624 Linden Ave | 0.68mi | 2/1.0 (-1) | 1,508 (+7%) | 14mo | $114,900 | $76 | 37 |
Match score weights: distance 35% · size 25% · config 20% · recency 20%. Top-matched comps best support the ARV.
Projected returns pro-forma
-3.0% appreciation · 3.0% rent growth · sell at horizon
- IRR
- -11.2%
- Equity multiple
- 0.59×
- Total profit
- $-16,823
- Equity at exit
- $22,067
- IRR
- -2.0%
- Equity multiple
- 0.87×
- Total profit
- $-5,579
- Equity at exit
- $12,796
Cash invested: $41,440 (down + closing). Projections, not guarantees.
Landlord ↔ Tenant lean methodology
- Overall (STATE)
- 92 Strongly Landlord-Friendly
- State Arkansas
- 92 Strongly Landlord-Friendly · R+14
- County
- — inherits STATE
- City
- — inherits STATE
ZIP-level market 71854
- Home prices YoY
- -16.9%
- Active inventory
- 273
- Price-to-rent
- 9.6×
Monthly cashflow live
- Estimated rent
- $1,287 high interval (Pro) →
- Mortgage (P&I)
- −$776
- Tax from tax record
- −$66 /mo · $790/yr
- Insurance
- −$62
- HOA
- −$0
- Vacancy / Maint / Mgmt
- −$270
- Net cashflow
- $113
Break-even live
Sensitivity live
| Price | -10% $197 | -5% $155 | +0% $113 | +5% $71 | +10% $29 |
|---|---|---|---|---|---|
| Rent | -10% $12 | -5% $62 | +0% $113 | +5% $164 | +10% $215 |
| Rate | -1.0pp $188 | -0.5pp $151 | base $113 | +0.5pp $75 | +1.0pp $36 |
UW: 25.0% down · 7.5% · 30yr · 1.5% tax · 5.0% vac · 8.0% maint · 8.0% mgmt
Financing live
Cash to close
- Down payment
- $37,000
- Closing costs
- $4,440
- Reserves months
- —
- Total cash needed
- —
Loan-product check · same deal, 3 products live
Conventional
25% down · 7.5% · 30yr
- Down + closing
- —
- Monthly P&I
- —
- Monthly cashflow
- —
- DSCR
- —
- Eligible?
- —
Personal DTI + credit; lowest rate.
DSCR
20% down · 8.5% · 30yr
- Down + closing
- —
- Monthly P&I
- —
- Monthly cashflow
- —
- DSCR
- —
- Eligible?
- —
No personal income docs; deal must DSCR.
Hard money
10% down · 12.0% · 12mo
- Down + closing
- —
- Monthly P&I
- —
- Monthly cashflow
- —
- DSCR
- —
- Eligible?
- —
Short-term bridge; refi at stabilization.
Rent comps 11 comps
| Address | Beds | Baths | Sqft | Rent | $/sqft | DOM | Units | Dist |
|---|---|---|---|---|---|---|---|---|
| 2101 Pecan St Texarkana, AR | 3.0 | 1.0 | 1453 | $1,125 | $0.77 | 44d | 1 | 0.30mi |
| 722 W 34th St Texarkana, TX | 2.0 | 1.0 | 1298 | $1,300 | $1.00 | 44d | 1 | 0.81mi |
| 3302 Anthony Dr Texarkana, TX | 3.0 | 2.0 | 1726 | $850 | $0.49 | 44d | 1 | 0.85mi |
| 3801 Magnolia St Unit MG01 Texarkana, TX | 3.0 | 1.5 | 1200 | $1,000 | $0.83 | 44d | 1 | 0.90mi |
| 3514 Sabine Ave Texarkana, TX | 4.0 | 2.0 | 1600 | $1,845 | $1.15 | 44d | 1 | 1.10mi |
| 4101 Olive St Texarkana, TX | 2.0 | 1.0 | 1400 | $1,300 | $0.93 | 44d | 1 | 1.13mi |
| 2400 Brookridge Dr Texarkana, AR | 2.0–3.0 | 1.0–2.0 | 1000 | $1,095 | $1.09 | 44d | 3 | 1.27mi |
| 1400 E 35th St Unit PS6-052 Texarkana, AR | 2.0 | 2.0 | 1025 | $899 | $0.88 | 44d | 1 | 1.38mi |
| 1400 E 35th St Unit PS2-013 Texarkana, AR | 2.0 | 1.0 | 980 | $859 | $0.88 | 44d | 1 | 1.38mi |
| 1400 E 35th St Unit PS16-142 Texarkana, AR | 2.0 | 1.0 | 980 | $809 | $0.83 | 44d | 1 | 1.38mi |
| 1504 Colorado St Texarkana, TX | 3.0 | 2.0 | 1298 | $1,595 | $1.23 | 44d | 1 | 1.46mi |
Listing history 30 events
-
2026-06-19days on market $148,000 Active 53 DOM
-
2026-06-18days on market $148,000 Active 52 DOM
-
2026-06-17days on market $148,000 Active 51 DOM
-
2026-06-16days on market $148,000 Active 50 DOM
-
2026-06-15days on market $148,000 Active 49 DOM
-
2026-06-14days on market $148,000 Active 47 DOM
-
2026-06-13days on market $148,000 Active 46 DOM
-
2026-06-10pricedays on market $148,000 Active 44 DOM
-
2026-06-09days on market $155,000 Active 43 DOM
-
2026-06-08days on market $155,000 Active 42 DOM
-
2026-06-07days on market $155,000 Active 41 DOM
-
2026-06-05days on market $155,000 Active 38 DOM
-
2026-06-03days on market $155,000 Active 37 DOM
-
2026-06-02days on market $155,000 Active 36 DOM
-
2026-06-01days on market $155,000 Active 35 DOM
-
2026-05-31days on market $155,000 Active 34 DOM
-
2026-05-30days on market $155,000 Active 33 DOM
-
2026-04-27$155,000 Active 408-char remark
-
2025-12-11price $132,500
-
2025-11-10price $137,500
-
2025-10-30price $144,000
-
2025-10-01price $149,000
-
2025-08-30historical $1,529
-
2025-08-22price $1,529
-
2025-08-12price $1,589
-
2025-07-10$1,629
-
2024-08-01historical $1,629
-
2024-07-20$1,629
-
2021-08-02soldstatus $185,000
-
2016-02-12soldstatus $36,000
ⓘ Source: listings_history table (triggers on properties + properties_extension) + one-shot
backfill from property_details.listing_events for pre-trigger history.
Tax reassessment forecast AR · Resets to sale price
- Current annual tax
- $790 · $66/mo
- Projected year-2 tax
- $947 · $79/mo
- Expected delta
- +$157/yr (+$13/mo · 19.8%)
ⓘ Screening estimate from a state-policy table — verify with the county assessor before closing.
Climate risk First Street
- Flood 1/10 Low FEMA zone X (unshaded) · 0% chance over 30 yrs
- Wildfire 1/10 Low
- Heat 7/10 Severe 7 d/yr ≥112°F today · 22 d/yr by 30 yrs out
- Wind 4/10 Moderate 24% chance of damaging wind over 30 yrs
- Air quality 2/10 Low 0 unhealthy d/yr today · 1 by 30 yrs out
Nearby sold comps map
Loading sold comps map…
Walkable amenities ~0.75 mi
Loading nearby amenities…
Taxation est. · year 1
- Rental income
- $15,447
- − Mortgage interest
- −$8,290
- − Property taxes
- −$790
- − Insurance
- −$740
- − Repairs & maintenance
- −$1,236
- − Management
- −$1,236
- − Depreciation
- −$4,305
- Taxable loss
- −$1,151
- Est. tax savings @ 24.0%
- +$276
- After-tax cash flow
- $1,635/yr
For passive investors: Depreciation is non-cash, so a rental often shows a tax loss while cash-flowing — sheltering income. Rental losses are passive: they offset passive income freely, and up to $25,000/yr can offset ordinary (W-2) income if you actively participate and your MAGI is under $100k (phasing out to $0 by $150k); unused losses carry forward. On sale, claimed depreciation is recaptured at up to 25%, and gains may owe capital-gains tax (a 1031 exchange can defer both). Figures are a year-1 estimate at your 24.0% rate — not tax advice; consult a CPA.
Schools (NCES district)
- District
- Texarkana School District
- NCES district ID
- 0513110
- Math proficiency
- 27% ▼ -12.00%
- Reading proficiency
- 24% ▼ -9.00%
- Median HH income
- $39,320
- Composite
- 21.47/100
- National rank
- #8332
- State rank
- #181 of 238 in AR
Livability — Texarkana
- Score
- 64/100
- State rank
- #177
- US rank
- #14514
Category grades
Schools grade is shown separately in the Schools card above.
Census & demographics
- Census place
- Texarkana, AR
- County
- Miller County · 35,720 people
- City population
- 35,720
- Metro
- Texarkana, TX-AR
- Population (ZIP)
- 35,720
- Household income
- $46,878
- Rent vs Own
- Severe rent burden
- 1388.0
Population outlook (Miller County) Hauer SSP2
- Today (2025)
- 44,197 people
- By 2030
- 43,844 · -0.8%
- By 2040
- 42,680 · -3.4%
- By 2050
- 41,024 · -7.2%
- By 2075
- 35,685 · -19.3%
- By 2100
- 28,325 · -35.9%
Race, ethnicity, and origin ACS 2023
- Neighborhood character
- Majority White (62%)
- Race & ethnicity
- White 62% Black 30% Hispanic / Latino 4% Two or more races 3%
- Common ancestry
- Lithuanian 1% Slovak 1%
- Foreign-born
- 2% · Canada
- Languages at home
- 98% English-only · Spanish 2%
Political lean MEDSL · Miller
- 2024 margin
- Solid R (+51.1) · D 23.9% · R 74.9% · Other 1.2%
- 2008→2024 swing
- -17.6pp toward R · 2008: -33.5pp · 2024: -51.1pp
- All cycles
- 2024: R+51.1 2020: R+46.4 2016: R+43.8 2012: R+39.8 2008: R+33.5
Not yet ingested
- Civics
- —
Market trends
- HPI YoY
- ▼ -40.00%
- Current HPI
- 196.7615
- Rent YoY
- —
- Metro
- Texarkana, TX-AR
- State GDP YoY
- ▲ 3.80%
- F500 in state
- 10
Industry mix (Fortune 500 HQ in AR)
| Industry | F500 HQs | Revenue |
|---|---|---|
| Retail | 1 | $681B |
|
||
| Food / Agriculture | 1 | $53B |
|
||
| Retail / Energy | 1 | $22B |
|
||
| Transportation / Logistics | 1 | $12B |
|
||
| Energy | 1 | $4B |
|
||
Price history
+311.1% since first listed14 events — show timeline
- 2026-06-09 Price Changed $148,000 TBOR
- 2026-04-27 Listed $155,000 TBOR
- 2025-12-11 Price Changed $132,500 TBOR
- 2025-11-10 Price Changed $137,500 TBOR
- 2025-10-30 Price Changed $144,000 TBOR
- 2025-10-01 Price Changed $149,000 TBOR
- 2025-08-30 Rental Removed $1,529 APPFOLIO
- 2025-08-22 Price Changed $1,529 APPFOLIO
- 2025-08-12 Price Changed $1,589 APPFOLIO
- 2025-07-10 Listed for Rent $1,629 APPFOLIO
- 2024-08-01 Rental Removed $1,629 APPFOLIO
- 2024-07-20 Listed for Rent $1,629 APPFOLIO
- 2021-08-02 Sold (Public Records) $185,000 Public Records
- 2016-02-12 Sold (Public Records) $36,000 Public Records
Property tax history
+0.4%/yrLatest (2025): $790 · +4.5% YoY. Source: county tax records.
Cash-flow waterfall
monthlySold comps — $/sqft
last 12 mo · ≤1 miLoading sold comps…