 Multi-family
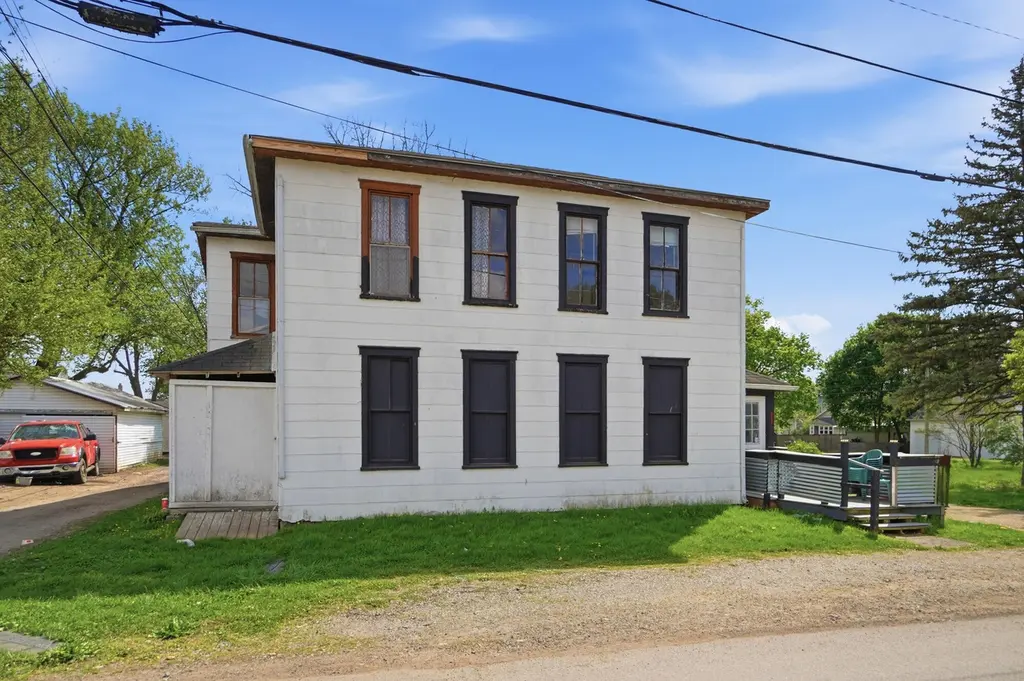
517 Broadway St · Springfield, OH
Flood risk 1/10 · Minimal
- FEMA flood zone
- X (unshaded)
- Chance of flooding over 30 yrs
- 0.0%
- Est. flood insurance / yr
- $473 – $860
Fire risk 1/10 · Minimal
- Est. fire insurance / yr
- $713 – $1,323
Heat risk 3/10 · Minor
- Hot days now (above 100°F)
- 7 days/yr
- Hot days in 30 yrs
- 18 days/yr
Wind risk 2/10 · Minimal
- Chance of severe wind over 30 yrs
- —
Air-quality risk 3/10 · Minor
- Unhealthy air days now
- 2 days/yr
- Unhealthy air days in 30 yrs
- 3 days/yr
Risk factors via First Street. Map © Google.
Why this score? — see what drove the B grade
The composite is a weighted blend of 9 inputs, each scored 0–100. Each bar is that input's sub-score; the figure is the points it added to the 100-point composite (weight × sub-score).
- Cash flow +30.0/30.0
- ARV discount +15.0/15.0
- 1% rule +10.0/10.0
- DSCR +10.0/10.0
- Livability +2.8/5.0
- Rent growth +2.5/5.0
- Condition / age +2.5/5.0
- Schools +1.9/10.0
- Appreciation +0.0/10.0
$65,000
🖨 Deal sheet 📄 Offer letter ✓ Due diligence
Multi-family units
County records classify this as Multi-Family (2-4 Unit). Listing-text estimate: 1 unit. estimate disagrees with records
Listing remarks MLS
LAND CONTRACT OPTION! Located at 517-515 W Broadway Ave in Springfield, this is the kind of opportunity buyers look for when they are ready to take that first real step into real estate. Walk through this property and start thinking about what it could become. It is currently set up as a single-family home, but the layout was previously used as a two-family and may offer the potential to be converted back, subject to buyer verification of zoning, permits, and intended use. With approximately 1,884 square feet, four bedrooms, two full bathrooms, a full basement, and nearly half an acre, there is room here to build something that fits your plan. Land contract terms are available, creating an alternative path to ownership that may allow you to move forward without traditional financing, subject to agreed terms and buyer qualification. For buyers looking to get started or expand, this property may support a range of approaches such as house hacking with potential rental use, exploring a BRRRR strategy, or creating a long-term rental setup. The real value here is the ability to step in, make improvements over time, and shape the property around your goals, all subject to your own due diligence and verification. Opportunities offering flexible terms and multiple potential paths like this are not always easy to find.
Key facts
- 0.48 acre lot
- Built 1891
- Listed 60 days
Neighborhood map
What this means for you Summary
Snapshot
- This is a 4-bed/2.0-bath multifamily listed at $65k.
Deal economics
- At list price, monthly cash flow is $911 ($11k/yr) — positive.
- The deal already cash-flows at list — no discount required.
- Meets the 1% rule at list price ($2k rent vs $65k).
- Recommended offer: $63k (3.0% below list) — sets the bar for market timing.
- Cap rate 23.1% vs local median 4.8% in Springfield — top-decile yield for the area; either an underpriced asset or a hidden risk that comps aren't pricing in. Stress-test before assuming the spread holds.
Location & tenants
- Location reads 56/100 on livability (#1,108 in OH) — a working-class tenant base; expect higher turnover. Strengths: cost of living A+, housing A+; Watch: crime F, amenities F, commute F.
- Springfield City School District (urban): math 20% / reading 27% proficiency, ranked #616 of 656 in OH (top 94%) — low school quality limits family demand, transient renter base, plan for 1-2y turnover; 75% free/reduced lunch — lower-income household profile, screen leases tightly.
- Market conditions: 93 active listings in the ZIP; 10 comparable units currently listed for rent nearby; rentals leasing fast (median 12d on market — plan ~1-2 weeks tenant-placement turnaround); 232 units permitted in Clark County in 2024 (116 in 5+ unit buildings).
- This rent runs 30% of the median local income ($67k/yr) — at the standard rent-burdened threshold; future hikes will face affordability resistance.
Forward outlook
- Local home prices are declining (-3.0%/yr); year-one equity from $449 of loan paydown is wiped out by about $2k of value loss. Plan a longer hold.
- Clark County population projected at -16% by 2050 — secular population decline; favor cash flow + early exit over multi-decade hold.
- At projected returns (-3.0% appreciation + 3.0% rent growth), your $18k cash investment doubles in ~2 years — after that, you're playing with house money.
Negotiation context
- It's been on market 60 days — a 3% lower offer ($63k) is reasonable based on typical stale-listing flexibility.
- 4 sale attempts since 17y ago; this cycle's ask has dropped $15k (19%) from the opening price — seller is motivated, your offer sets the floor, not the list.
- Current owner paid $36k; list at $65k implies a 83% gain — meaningful room to come down on a strong offer.
Risks & watch-outs
- Watch-outs: built in 1891 — expect roof / HVAC / electrical / plumbing capex.
Questions for the listing agent
- It's been on market 60 days. Have you received any prior offers? Is the seller open to a 3% concession, seller financing, or rate buy-down credit?
- Built in 1891 — when were the roof, HVAC, electrical panel, plumbing, and water heater last replaced?
- Is there a deadline driving the sale (1031 exchange, divorce, estate, relocation)? That informs how much negotiation room exists.
- Crime grade is F in this area — have there been break-ins, vandalism, or insurance claims at this property in the last 3 years? What carrier currently insures it and at what premium?
- What's the average days-on-market for RENTAL listings here right now (not sales)? A rising rental-DOM trend means longer vacancies and softer asking-rent achievability than the comps imply.
- What's the recent tenant-quality profile in this submarket — average credit score on applications, eviction rate, late-payment / NSF rate, and stable-employment percentage? A property-management company in the area should have these aggregated.
- How much new apartment / multifamily construction is in the pipeline within 1–3 miles? Heavy new supply (>2% of stock underway) typically softens rents 12–24 months out; light construction supports rent growth.
Investment metrics
- 1% rule
- 2.62% ✓
- Cap rate
- 23.11%
- Cash-on-cash
- 60.06%
- DSCR
- 3.67
- GRM
- 3.2
CMA / ARV
- ARV (median comp)
- $81,739
- List price
- $65,000
- Delta
- -20.48%
- Verdict
- UNDERPRICED
- Comps
- 20 within 1.0 mi
Show comp detail 3 sales within ~0.75 mi
| Address | Dist | Beds/Ba | Sqft | Sold | Price | $/sf | Match |
|---|---|---|---|---|---|---|---|
| 423 N Jackson St | 0.34mi | 4/2.5 | 1,836 (-2%) | 1mo | $80,000 | $44 | 77 |
| 410 N Isabella St | 0.62mi | 4/2.5 | 1,836 (-2%) | 23mo | $158,900 | $87 | 46 |
| 724 Garfield Ave | 0.69mi | 4/2.0 | 2,140 (+14%) | 11mo | $178,800 | $84 | 36 |
Match score weights: distance 35% · size 25% · config 20% · recency 20%. Top-matched comps best support the ARV.
Projected returns pro-forma
-3.0% appreciation · 3.0% rent growth · sell at horizon
- IRR
- 58.8%
- Equity multiple
- 3.61×
- Total profit
- $47,499
- Equity at exit
- $9,692
- IRR
- 63.6%
- Equity multiple
- 7.38×
- Total profit
- $116,132
- Equity at exit
- $5,620
Cash invested: $18,200 (down + closing). Projections, not guarantees.
Landlord ↔ Tenant lean methodology
- Overall (STATE)
- 73 Landlord-Friendly
- State Ohio
- 73 Landlord-Friendly · R+6
- County
- — inherits STATE
- City
- — inherits STATE
ZIP-level market 45504
- Active inventory
- 93
- Price-to-rent
- 3.2×
Monthly cashflow live
- Estimated rent
- $1,702 high interval (Pro) →
- Mortgage (P&I)
- −$341
- Tax from tax record
- −$66 /mo · $787/yr
- Insurance
- −$27
- HOA
- −$0
- Vacancy / Maint / Mgmt
- −$357
- Net cashflow
- $911
Break-even live
UW: 25.0% down · 7.5% · 30yr · 1.5% tax · 5.0% vac · 8.0% maint · 8.0% mgmt
Financing live
Cash to close
- Down payment
- $16,250
- Closing costs
- $1,950
- Reserves months
- —
- Total cash needed
- —
Loan-product check · same deal, 3 products live
Conventional
25% down · 7.5% · 30yr
- Down + closing
- —
- Monthly P&I
- —
- Monthly cashflow
- —
- DSCR
- —
- Eligible?
- —
Personal DTI + credit; lowest rate.
DSCR
20% down · 8.5% · 30yr
- Down + closing
- —
- Monthly P&I
- —
- Monthly cashflow
- —
- DSCR
- —
- Eligible?
- —
No personal income docs; deal must DSCR.
Hard money
10% down · 12.0% · 12mo
- Down + closing
- —
- Monthly P&I
- —
- Monthly cashflow
- —
- DSCR
- —
- Eligible?
- —
Short-term bridge; refi at stabilization.
Rent comps 10 comps
| Address | Beds | Baths | Sqft | Rent | $/sqft | DOM | Units | Dist |
|---|---|---|---|---|---|---|---|---|
| 220 S Yellow Springs St Springfield, OH | 4.0 | 2.0 | 1456 | $1,645 | $1.13 | 23d | 1 | 0.53mi |
| 302 S Yellow Springs St Springfield, OH | 4.0 | 2.0 | 1456 | $1,845 | $1.27 | 11d | 1 | 0.58mi |
| 307 N Isabella St Unit 309 Springfield, OH | 3.0 | 1.5 | 1300 | $1,400 | $1.08 | 3d | 1 | 0.62mi |
| 306 S Plum St Springfield, OH | 4.0 | 2.0 | 1352 | $1,700 | $1.26 | 44d | 1 | 0.63mi |
| 356 S Yellow Springs St Springfield, OH | 4.0 | 2.0 | 1606 | $1,825 | $1.14 | 11d | 1 | 0.64mi |
| 523 W Mulberry St Springfield, OH | 4.0 | 2.0 | 1456 | $1,825 | $1.25 | 11d | 1 | 0.69mi |
| 524 W Pleasant St Springfield, OH | 4.0 | 2.0 | 1456 | $1,645 | $1.13 | 11d | 1 | 0.72mi |
| 401 Section St Springfield, OH | 4.0 | 2.0 | 1612 | $1,850 | $1.15 | 11d | 1 | 0.97mi |
| 545 W Grand Ave Springfield, OH | 4.0 | 2.0 | 1456 | $1,595 | $1.10 | 3d | 1 | 1.20mi |
| 18 E Grand Ave Springfield, OH | 4.0 | 2.0 | 1452 | $1,575 | $1.08 | 19d | 1 | 1.33mi |
Listing history 26 events
-
2026-06-19days on market $65,000 Active 60 DOM
-
2026-06-18days on market $65,000 Active 59 DOM
-
2026-06-17days on market $65,000 Active 58 DOM
-
2026-06-16days on market $65,000 Active 57 DOM
-
2026-06-15days on market $65,000 Active 56 DOM
-
2026-06-14days on market $65,000 Active 54 DOM
-
2026-06-12days on market $65,000 Active 53 DOM
-
2026-06-09days on market $65,000 Active 50 DOM
-
2026-06-08days on market $65,000 Active 49 DOM
-
2026-06-07days on market $65,000 Active 48 DOM
-
2026-06-05days on market $65,000 Active 45 DOM
-
2026-06-02days on market $65,000 Active 43 DOM
-
2026-06-01pricedays on market $65,000 Active 42 DOM
-
2026-05-31days on market $69,900 Active 41 DOM
-
2026-05-30days on market $69,900 Active 40 DOM
-
2026-04-20$80,000 Active 1337-char remark
Show marketing remark (1337 chars)
LAND CONTRACT OPTION! Located at 517-515 W Broadway Ave in Springfield, this is the kind of opportunity buyers look for when they are ready to take that first real step into real estate. Walk through this property and start thinking about what it could become. It is currently set up as a single-family home, but the layout was previously used as a two-family and may offer the potential to be converted back, subject to buyer verification of zoning, permits, and intended use. With approximately 1,884 square feet, four bedrooms, two full bathrooms, a full basement, and nearly half an acre, there is room here to build something that fits your plan. Land contract terms are available, creating an alternative path to ownership that may allow you to move forward without traditional financing, subject to agreed terms and buyer qualification. For buyers looking to get started or expand, this property may support a range of approaches such as house hacking with potential rental use, exploring a BRRRR strategy, or creating a long-term rental setup. The real value here is the ability to step in, make improvements over time, and shape the property around your goals, all subject to your own due diligence and verification. Opportunities offering flexible terms and multiple potential paths like this are not always easy to find.
-
2026-01-08soldstatus $35,500
-
2017-01-30soldstatus $12,000
-
2016-11-04historical
-
2016-11-04historical
-
2015-08-20$14,000
-
2015-08-18$21,111
-
2009-11-04soldstatus $10,000
-
2009-10-26$15,000
-
1994-09-16soldstatus $16,500
-
1985-09-18soldstatus $16,500
ⓘ Source: listings_history table (triggers on properties + properties_extension) + one-shot
backfill from property_details.listing_events for pre-trigger history.
Tax reassessment forecast OH · Partial reset (capped growth)
- Current annual tax
- $787 · $66/mo
- Projected year-2 tax
- $900 · $75/mo
- Expected delta
- +$114/yr (+$9/mo · 14.4%)
ⓘ Screening estimate from a state-policy table — verify with the county assessor before closing.
Climate risk First Street
- Flood 1/10 Low FEMA zone X (unshaded) · 0% chance over 30 yrs
- Wildfire 1/10 Low
- Heat 3/10 Moderate 7 d/yr ≥100°F today · 18 d/yr by 30 yrs out
- Wind 2/10 Low
- Air quality 3/10 Moderate 2 unhealthy d/yr today · 3 by 30 yrs out
Nearby sold comps map
Loading sold comps map…
Walkable amenities ~0.75 mi
Loading nearby amenities…
Taxation est. · year 1
- Rental income
- $20,422
- − Mortgage interest
- −$3,641
- − Property taxes
- −$787
- − Insurance
- −$325
- − Repairs & maintenance
- −$1,634
- − Management
- −$1,634
- − Depreciation
- −$1,891
- Taxable income
- $10,510
- Est. tax owed @ 24.0%
- −$2,523
- After-tax cash flow
- $8,408/yr
For passive investors: Depreciation is non-cash, so a rental often shows a tax loss while cash-flowing — sheltering income. Rental losses are passive: they offset passive income freely, and up to $25,000/yr can offset ordinary (W-2) income if you actively participate and your MAGI is under $100k (phasing out to $0 by $150k); unused losses carry forward. On sale, claimed depreciation is recaptured at up to 25%, and gains may owe capital-gains tax (a 1031 exchange can defer both). Figures are a year-1 estimate at your 24.0% rate — not tax advice; consult a CPA.
Schools (NCES district)
- District
- Springfield City School District
- NCES district ID
- 3904481
- Math proficiency
- 20% ▼ -16.00%
- Reading proficiency
- 27% ▼ -12.00%
- Median HH income
- $32,541
- Composite
- 19.12/100
- National rank
- #8834
- State rank
- #616 of 656 in OH
Livability — Springfield
- Score
- 56/100
- State rank
- #1108
- US rank
- #22551
Category grades
Schools grade is shown separately in the Schools card above.
Census & demographics
- Census place
- Springfield, OH
- County
- Clark · 134,280 people
- City population
- 33,261
- Metro
- Springfield, OH
- Population (ZIP)
- 16,654
- Household income
- $67,334
- Rent vs Own
- Severe rent burden
- 6.4
Population outlook (Clark County) Hauer SSP2
- Today (2025)
- 130,703 people
- By 2030
- 126,952 · -2.9%
- By 2040
- 118,344 · -9.5%
- By 2050
- 109,590 · -16.2%
- By 2075
- 89,464 · -31.6%
- By 2100
- 68,810 · -47.4%
Race, ethnicity, and origin ACS 2023
- Neighborhood character
- Predominantly White (85%)
- Race & ethnicity
- White 85% Two or more races 7% Black 5% Hispanic / Latino 3%
- Common ancestry
- Lithuanian 2% Slovak 2% Italian 1%
- Foreign-born
- 2% · Canada, China
- Languages at home
- 97% English-only · Spanish 2%
Political lean MEDSL · Clark
- 2024 margin
- Strong R (+29.5) · D 34.8% · R 64.3%
- 2008→2024 swing
- -27.0pp toward R · 2008: -2.5pp · 2024: -29.5pp
- All cycles
- 2024: R+29.5 2020: R+23.3 2016: R+19.5 2012: R+1.8 2008: R+2.5
Not yet ingested
- Civics
- —
Market trends
- HPI YoY
- ▼ -138.72%
- Current HPI
- 240.7049
- Rent YoY
- —
- Metro
- —
- State GDP YoY
- ▲ 1.98%
- F500 in state
- 48
Industry mix (Fortune 500 HQ in OH)
| Industry | F500 HQs | Revenue |
|---|---|---|
| Insurance | 3 | $145B |
|
||
| Industrial Machinery | 3 | $49B |
|
||
| Financial Services | 3 | $24B |
|
||
| Consumer Goods | 2 | $93B |
|
||
| Aerospace / Defense | 2 | $47B |
|
||
| Utilities | 2 | $33B |
|
||
Price history
+384.8% since first listed11 events — show timeline
- 2026-04-20 Listed $80,000 WRIST
- 2026-01-08 Sold (Public Records) $35,500 Public Records
- 2017-01-30 Sold (Public Records) $12,000 Public Records
- 2016-11-04 Listing Removed — WRIST
- 2016-11-04 Listing Removed — WRIST
- 2015-08-20 Listed $14,000 WRIST
- 2015-08-18 Listed $21,111 WRIST
- 2009-11-04 Sold (MLS) $10,000 WRIST
- 2009-10-26 Listed $15,000 WRIST
- 1994-09-16 Sold (Public Records) $16,500 Public Records
- 1985-09-18 Sold (Public Records) $16,500 Public Records
Property tax history
+13.1%/yrLatest (2025): $787 · +58.3% YoY. Source: county tax records.
Cash-flow waterfall
monthlySold comps — $/sqft
last 12 mo · ≤1 miLoading sold comps…