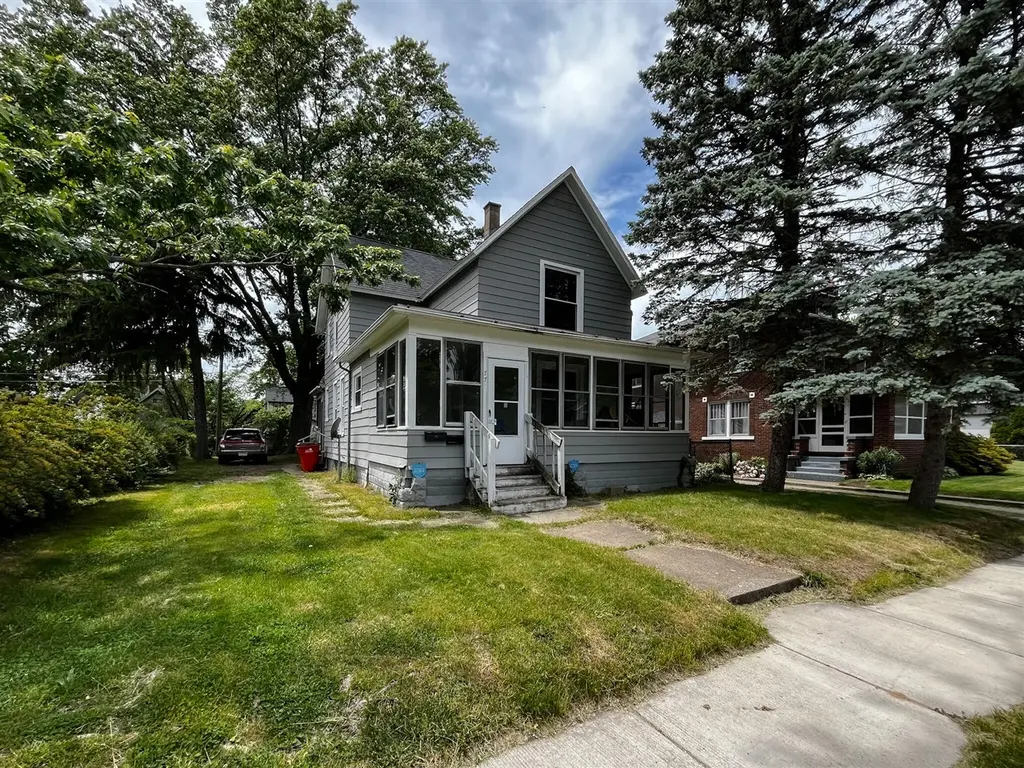
774 Lavette Ave · Benton Harbor, MI
Flood risk 1/10 · Minimal
- FEMA flood zone
- X (unshaded)
- Chance of flooding over 30 yrs
- 0.0%
- Est. flood insurance / yr
- $473 – $860
Fire risk 1/10 · Minimal
- Est. fire insurance / yr
- $784 – $1,456
Heat risk 2/10 · Minimal
- Hot days now (above 100°F)
- 7 days/yr
- Hot days in 30 yrs
- 14 days/yr
Wind risk 2/10 · Minimal
- Chance of severe wind over 30 yrs
- —
Air-quality risk 5/10 · Moderate
- Unhealthy air days now
- 8 days/yr
- Unhealthy air days in 30 yrs
- 8 days/yr
Risk factors via First Street. Map © Google.
Why this score? — see what drove the D+ grade
The composite is a weighted blend of 9 inputs, each scored 0–100. Each bar is that input's sub-score; the figure is the points it added to the 100-point composite (weight × sub-score).
- Cash flow +24.3/30.0
- DSCR +7.8/10.0
- 1% rule +5.7/10.0
- Livability +2.8/5.0
- Rent growth +2.5/5.0
- Condition / age +2.5/5.0
- Schools +0.8/10.0
- ARV discount +0.0/15.0
- Appreciation +0.0/10.0
$150,000
🖨 Deal sheet (PDF) 📄 Offer letter ✓ Due diligence
Listing remarks MLS
Welcome to this duplex in Benton Harbor, offering a great opportunity for investors or buyers looking for additional income. The property features a spacious 3 bedroom unit on the main level and a 2 bedroom, 1 bath unit upstairs, making it an excellent option for rental income or owner occupancy. The lower unit offers plenty of living space with three comfortable bedrooms, while the upper unit provides a functional layout with two bedrooms and a full bathroom. With separate living spaces, this property offers flexibility for tenants and owners alike. Conveniently located with easy access to shopping, major roadways, and less than 10 minutes from St. Joseph, this property puts you close to everything Southwest Michigan has to offer. Whether you're looking to expand your investment portfolio or live in one unit while renting the other, this duplex presents a fantastic opportunity with strong income potential.
Key facts
- Duplex
- 6,098 sq ft lot
- 4 parking spots
Tags
Property features AI
Finance
- Other: Tax year 2024 - total tax amount $2,611
- Financial info: Two rental units: both occupied; Unit 1 rent: $1,000; Unit 2 rent: $850
- HOA & community: Landlord pays water and sewer
Exterior
- Utilities: Natural gas; Public water and sewer (landlord pays water/sewer)
- Home design: Multi-family property; Built in 1926; Avenue street designation
- Construction: Vinyl siding exterior; Basement foundation; Built in 1926
- Exterior features: Vinyl siding; Basement foundation; 0.14 acre lot with approximately 50 feet frontage
Interior
- Heating & cooling: Forced air heating; Natural gas fuel
- Interior features: Multi-family layout (2 units)
Neighborhood map
What this means for you Summary
Snapshot
- This is a 3-bed/1.0-bath single-family listed at $150k.
Deal economics
- At list price, monthly cash flow is $302 ($4k/yr) — positive.
- The deal already cash-flows at list — no discount required.
- Meets the 1% rule at list price ($2k rent vs $150k).
Location & tenants
- Location reads 55/100 on livability (#671 in MI) — a working-class tenant base; expect higher turnover. Strengths: cost of living A+, housing A+, health & safety A-; Watch: schools F, crime F, amenities F.
- Benton Harbor Area Schools (urban): math 4% / reading 7% proficiency, ranked #732 of 760 in MI (top 96%) — low school quality limits family demand, transient renter base, plan for 1-2y turnover; 89% free/reduced lunch — lower-income household profile, screen leases tightly.
- Market conditions: 179 active listings in the ZIP; 3 comparable units currently listed for rent nearby; rentals lingering (median 44d on market — plan ~5-8 weeks vacancy on turnover, expect pricing pressure); 100% of comp listings sitting > 30 days — soft ceiling on asking rent; 397 units permitted in Berrien County in 2024 (40 in 5+ unit buildings).
Forward outlook
- Local home prices are declining (-3.0%/yr); year-one equity from $1k of loan paydown is wiped out by about $4k of value loss. Plan a longer hold.
- Berrien County population projected at -16% by 2050 — secular population decline; favor cash flow + early exit over multi-decade hold.
Negotiation context
- Only 5 days on market — expect competitive offers; lowballing is unlikely to land.
- 5 sale attempts since 2y ago with the ask held roughly flat each time — persistent listings suggest the price (not the market) is what's stuck; bring a comps-based counter.
- Current owner paid $100k; list at $150k implies a 50% gain — meaningful room to come down on a strong offer.
Risks & watch-outs
- Watch-outs: built in 1926 — expect roof / HVAC / electrical / plumbing capex.
Questions for the listing agent
- Built in 1926 — when were the roof, HVAC, electrical panel, plumbing, and water heater last replaced?
- Is there a deadline driving the sale (1031 exchange, divorce, estate, relocation)? That informs how much negotiation room exists.
- Schools are F-rated, which usually means shorter tenancies and higher turnover. Who's the typical renter profile here, and what's been the actual vacancy rate?
- Crime grade is F in this area — have there been break-ins, vandalism, or insurance claims at this property in the last 3 years? What carrier currently insures it and at what premium?
- The area grade is low — what's the realistic commute time and amenity access for the typical tenant pool here? Any planned neighborhood developments (good or bad) we should know about?
- What's the average days-on-market for RENTAL listings here right now (not sales)? A rising rental-DOM trend means longer vacancies and softer asking-rent achievability than the comps imply.
- What's the recent tenant-quality profile in this submarket — average credit score on applications, eviction rate, late-payment / NSF rate, and stable-employment percentage? A property-management company in the area should have these aggregated.
- How much new for-sale + rental construction is in the pipeline within 1–3 miles? Heavy new supply typically softens prices + rents 12–24 months out; constrained supply supports both.
Investment metrics
- 1% rule
- 1.07% ✓
- Cap rate
- 8.71%
- Cash-on-cash
- 8.63%
- DSCR
- 1.38
- GRM
- 7.8
CMA / ARV
- ARV (on-the-fly)
- $126,825
- Comps found
- 12
Show comp detail 12 sales within ~0.75 mi
| Address | Dist | Beds/Ba | Sqft | Sold | Price | $/sf | Match |
|---|---|---|---|---|---|---|---|
| 694 Colfax Ave | 0.12mi | 3/2.5 | 1,478 (+11%) | 4mo | $140,000 | $95 | 67 |
| 833 Pearl St | 0.28mi | 2/2.0 (-1) | 1,270 (-5%) | 3mo | $99,270 | $78 | 67 |
| 202 Searles Ave | 0.41mi | 2/1.0 (-1) | 1,362 (+2%) | 7mo | $147,000 | $108 | 67 |
| 863 Colfax Ave | 0.11mi | 2/1.0 (-1) | 1,180 (-12%) | 10mo | $125,000 | $106 | 62 |
| 814 Columbus Ave | 0.31mi | 4/2.0 (+1) | 1,436 (+8%) | 4mo | $144,000 | $100 | 61 |
| 1267 Broadway | 0.65mi | 4/1.0 (+1) | 1,352 (+1%) | 6mo | $19,000 | $14 | 58 |
| 1120 Monroe St | 0.66mi | 3/1.5 | 1,280 (-4%) | 5mo | $65,000 | $51 | 56 |
| 885 Broadway | 0.25mi | 3/1.5 | 1,152 (-14%) | 9mo | $125,000 | $109 | 56 |
| 410 Division St | 0.35mi | 4/2.0 (+1) | 1,492 (+12%) | 2mo | $25,000 | $17 | 53 |
| 460 Colfax Ave | 0.39mi | 3/1.0 | 1,532 (+15%) | 7mo | $99,900 | $65 | 52 |
| 1238 Broadway | 0.62mi | 3/1.5 | 1,197 (-10%) | 3mo | $110,000 | $92 | 50 |
| 1043 Jennings Ave | 0.68mi | 3/2.0 | 1,200 (-10%) | 8mo | $160,000 | $133 | 41 |
Match score weights: distance 35% · size 25% · config 20% · recency 20%. Top-matched comps best support the ARV.
Projected returns pro-forma
-3.0% appreciation · 3.0% rent growth · sell at horizon
- IRR
- -3.2%
- Equity multiple
- 0.88×
- Total profit
- $-5,081
- Equity at exit
- $22,365
- IRR
- 6.5%
- Equity multiple
- 1.48×
- Total profit
- $20,272
- Equity at exit
- $12,969
Cash invested: $42,000 (down + closing). Projections, not guarantees.
Landlord ↔ Tenant lean methodology
- Overall (STATE)
- 62 Landlord-Friendly
- State Michigan
- 62 Landlord-Friendly · EVEN
- County
- — inherits STATE
- City
- — inherits STATE
ZIP-level market 49022
- Active inventory
- 179
- Price-to-rent
- 7.8×
Monthly cashflow live
- Estimated rent
- $1,600 medium interval (Pro) →
- Mortgage (P&I)
- −$787
- Tax from tax record
- −$113 /mo · $1,355/yr
- Insurance
- −$62
- HOA
- −$0
- Vacancy / Maint / Mgmt
- −$336
- Net cashflow
- $302
Break-even live
Sensitivity live
| Price | -10% $387 | -5% $345 | +0% $302 | +5% $260 | +10% $217 |
|---|---|---|---|---|---|
| Rent | -10% $176 | -5% $239 | +0% $302 | +5% $365 | +10% $429 |
| Rate | -1.0pp $378 | -0.5pp $340 | base $302 | +0.5pp $263 | +1.0pp $224 |
UW: 25.0% down · 7.5% · 30yr · 1.5% tax · 5.0% vac · 8.0% maint · 8.0% mgmt
Financing live
Cash to close
- Down payment
- $37,500
- Closing costs
- $4,500
- Reserves months
- —
- Total cash needed
- —
Loan-product check · same deal, 3 products live
Conventional
25% down · 7.5% · 30yr
- Down + closing
- —
- Monthly P&I
- —
- Monthly cashflow
- —
- DSCR
- —
- Eligible?
- —
Personal DTI + credit; lowest rate.
DSCR
20% down · 8.5% · 30yr
- Down + closing
- —
- Monthly P&I
- —
- Monthly cashflow
- —
- DSCR
- —
- Eligible?
- —
No personal income docs; deal must DSCR.
Hard money
10% down · 12.0% · 12mo
- Down + closing
- —
- Monthly P&I
- —
- Monthly cashflow
- —
- DSCR
- —
- Eligible?
- —
Short-term bridge; refi at stabilization.
Rent comps 3 comps
| Address | Beds | Baths | Sqft | Rent | $/sqft | DOM | Units | Dist |
|---|---|---|---|---|---|---|---|---|
| 797 Ogden Ave Benton Harbor, MI | 2.0 | 1.0 | 1000 | $900 | $0.90 | 44d | 1 | 0.45mi |
| 187 Wayne St #13 Saint Joseph, MI | 3.0 | 2.0 | 1500 | $2,900 | $1.93 | 44d | 1 | 1.11mi |
| 968 Chicago Ave Benton Harbor, MI | 4.0 | 2.0 | 1350 | $1,800 | $1.33 | 44d | 1 | 1.47mi |
Listing history 7 events
-
2026-06-19days on market $150,000 Active 5 DOM
-
2026-06-18days on market $150,000 Active 4 DOM
-
2026-06-17days on market $150,000 Active 3 DOM
-
2026-06-16days on market $150,000 Active 2 DOM
-
2026-06-15$150,000 Active 1 DOM
-
2026-06-15remarks 699-char remark
-
2026-06-15$150,000 Active 1 DOM
ⓘ Source: listings_history table (triggers on properties + properties_extension) + one-shot
backfill from property_details.listing_events for pre-trigger history.
Tax reassessment forecast MI · Partial reset (capped growth)
- Current annual tax
- $1,355 · $113/mo
- Projected year-2 tax
- $1,832 · $153/mo
- Expected delta
- +$478/yr (+$40/mo · 35.3%)
ⓘ Screening estimate from a state-policy table — verify with the county assessor before closing.
Climate risk First Street
- Flood 1/10 Low FEMA zone X (unshaded) · 0% chance over 30 yrs
- Wildfire 1/10 Low
- Heat 2/10 Low 7 d/yr ≥100°F today · 14 d/yr by 30 yrs out
- Wind 2/10 Low
- Air quality 5/10 Major 8 unhealthy d/yr today · 8 by 30 yrs out
Nearby sold comps map
Loading sold comps map…
Walkable amenities ~0.75 mi
Loading nearby amenities…
Taxation est. · year 1
- Rental income
- $19,203
- − Mortgage interest
- −$8,402
- − Property taxes
- −$1,355
- − Insurance
- −$750
- − Repairs & maintenance
- −$1,536
- − Management
- −$1,536
- − Depreciation
- −$4,364
- Taxable income
- $1,260
- Est. tax owed @ 24.0%
- −$302
- After-tax cash flow
- $3,324/yr
For passive investors: Depreciation is non-cash, so a rental often shows a tax loss while cash-flowing — sheltering income. Rental losses are passive: they offset passive income freely, and up to $25,000/yr can offset ordinary (W-2) income if you actively participate and your MAGI is under $100k (phasing out to $0 by $150k); unused losses carry forward. On sale, claimed depreciation is recaptured at up to 25%, and gains may owe capital-gains tax (a 1031 exchange can defer both). Figures are a year-1 estimate at your 24.0% rate — not tax advice; consult a CPA.
Schools (NCES district)
- District
- Benton Harbor Area Schools
- NCES district ID
- 2604830
- Math proficiency
- 4% ▬ 0.00%
- Reading proficiency
- 7% ▬ 0.00%
- Median HH income
- $27,038
- Composite
- 7.53/100
- National rank
- #14787
- State rank
- #732 of 760 in MI
Livability — Benton Harbor
- Score
- 55/100
- State rank
- #671
- US rank
- #23724
Category grades
Schools grade is shown separately in the Schools card above.
Census & demographics
- Census place
- Benton Harbor, MI
- Population (ZIP)
- 29,796
Population outlook (Berrien County) Hauer SSP2
- Today (2025)
- 149,273 people
- By 2030
- 145,211 · -2.7%
- By 2040
- 135,435 · -9.3%
- By 2050
- 125,543 · -15.9%
- By 2075
- 103,986 · -30.3%
- By 2100
- 82,256 · -44.9%
Race, ethnicity, and origin ACS 2023
- Neighborhood character
- Diverse neighborhood (Simpson 0.61)
- Race & ethnicity
- Black 50% White 37% Hispanic / Latino 7% Two or more races 6% Native American 2%
- Hispanic origin (detail)
- Mexican 6%
- Common ancestry
- Romanian 1% Lithuanian 1% Slovak 1%
- Foreign-born
- 3% · Canada
- Languages at home
- 94% English-only · Spanish 5%
Political lean MEDSL · Berrien
- 2024 margin
- Lean R (+7.9) · D 45.4% · R 53.2% · Other 1.4%
- 2008→2024 swing
- -13.3pp toward R · 2008: 5.5pp · 2024: -7.9pp
- All cycles
- 2024: R+7.9 2020: R+7.4 2016: R+12.7 2012: R+6.6 2008: D+5.5
Not yet ingested
- Civics
- —
Market trends
- HPI YoY
- ▼ -309.81%
- Current HPI
- 209.9723
- Rent YoY
- —
- Metro
- —
- State GDP YoY
- ▲ 1.37%
- F500 in state
- 28
Industry mix (Fortune 500 HQ in MI)
| Industry | F500 HQs | Revenue |
|---|---|---|
| Automotive Parts | 3 | $48B |
|
||
| Automotive | 2 | $372B |
|
||
| Chemicals | 1 | $45B |
|
||
| Automotive Retail | 1 | $29B |
|
||
| Healthcare / Medical Devices | 1 | $23B |
|
||
| Automotive Technology | 1 | $20B |
|
||
Price history
+50.2% since first listed11 events — show timeline
- 2026-06-13 Listed $150,000 REALCOMP
- 2026-06-13 Listed $150,000 MiRealSource-MiMLS
- 2024-07-01 Sold (MLS) $99,900 SW Michigan MLS
- 2024-07-01 Sold (MLS) $99,900 MiRealSource-MiMLS
- 2024-07-01 Sold (MLS) $99,900 REALCOMP
- 2024-05-20 Pending — REALCOMP
- 2024-05-20 Pending — MiRealSource-MiMLS
- 2024-05-20 Pending — SW Michigan MLS
- 2024-04-23 Listed $99,900 SW Michigan MLS
- 2024-04-23 Listed $99,900 MiRealSource-MiMLS
- 2024-04-23 Listed $99,900 REALCOMP
Property tax history
+13.8%/yrLatest (2024): $1,355 · +4.2% YoY. Source: county tax records.
Cash-flow waterfall
monthlySold comps — $/sqft
last 12 mo · ≤1 miLoading sold comps…