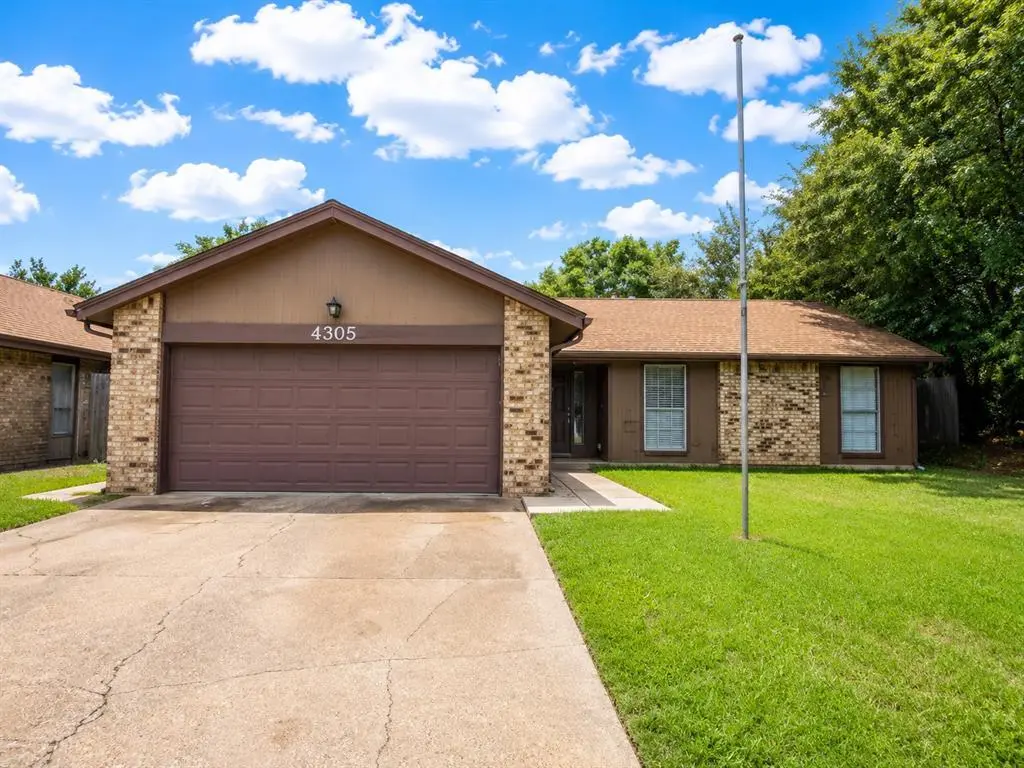
4305 Valley Forge Dr · Enid, OK
Flood risk 1/10 · Minimal
- FEMA flood zone
- X (unshaded)
- Chance of flooding over 30 yrs
- 0.0%
- Est. flood insurance / yr
- $507 – $1,088
Fire risk 1/10 · Minimal
- Est. fire insurance / yr
- $2,463 – $4,575
Heat risk 6/10 · Moderate
- Hot days now (above 108°F)
- 7 days/yr
- Hot days in 30 yrs
- 19 days/yr
Wind risk 2/10 · Minimal
- Chance of severe wind over 30 yrs
- 2.0%
Air-quality risk 2/10 · Minimal
- Unhealthy air days now
- 0 days/yr
- Unhealthy air days in 30 yrs
- 1 days/yr
Risk factors via First Street. Map © Google.
Why this score? — see what drove the D grade
The composite is a weighted blend of 9 inputs, each scored 0–100. Each bar is that input's sub-score; the figure is the points it added to the 100-point composite (weight × sub-score).
- Cash flow +15.1/30.0
- ARV discount +8.8/15.0
- DSCR +4.6/10.0
- 1% rule +4.0/10.0
- Livability +3.2/5.0
- Rent growth +3.1/5.0
- Condition / age +2.5/5.0
- Schools +1.8/10.0
- Appreciation +0.0/10.0
$170,000
🖨 Deal sheet (PDF) 📄 Offer letter ✓ Due diligence
Listing remarks MLS
Great home with new tile flooring in the living room & kitchen. Brand new carpet in the bedrooms & hallway too! Kitchen has granite countertops, new sink, solid wood cabinets & new light fixtures. Hall bathroom has been very nicely updated with a new vanity, granite countertop, custom shower & flooring. Home also offers a whole home water softener & purified water system to the kitchen sink & refrigerator. Backyard has a new fence for great privacy while you entertain under the covered patio. Stay safe in the Oklahoma storms in the in-ground storm shelter in the garage.
Key facts
- Cozy brick fireplace
- Vaulted ceilings
- 8,059 sq ft lot
Tags
Property features AI
Finance
- Other: Interior lot size approximately 0.185 acres; Occupied; No conditions affecting sale
- Financial info: Financing may qualify; Not assumable
- HOA & community: No mandatory association dues
Exterior
- Parking: 2-car garage; Garage floor storm shelter
- Home design: Single-family residence; One story; Existing property
- Construction: Brick and frame construction; Composition roof; Built status: existing
- Exterior features: Covered patio; Interior lot
Interior
- Bedrooms: 3 bedrooms
- Bathrooms: 2 full bathrooms
- Interior features: One living area; Living area reported by assessor; Slab foundation; Insert fireplace
Neighborhood map
What this means for you Summary
Snapshot
- This is a 3-bed/2.0-bath single-family listed at $170k.
Deal economics
- At list price, monthly cash flow is $55 ($658/yr) — positive.
- The deal already cash-flows at list — no discount required.
- To meet the 1% rule (rent ≥ 1% of price), the offer needs to be $153k (10.3% below list).
- Recommended offer: $153k (10.3% below list) — sets the bar for 1% rule.
- Cap rate 6.7% vs local median 5.0% in Enid — top-decile yield for the area; either an underpriced asset or a hidden risk that comps aren't pricing in. Stress-test before assuming the spread holds.
Location & tenants
- Location reads 63/100 on livability (#212 in OK) — a middle-class / working-renter tenant base. Strengths: cost of living A+, housing A+; Watch: employment C-, crime F, amenities F.
- Enid (town): math 19% / reading 22% proficiency, ranked #168 of 270 in OK (top 62%) — low school quality limits family demand, transient renter base, plan for 1-2y turnover; 64% free/reduced lunch — lower-income household profile, screen leases tightly.
- Zoned schools: Prairie View Es (math 47% / reading 37%, grade F, #84 of 845 statewide, top 11%, 431 students, 0% FRL); Dewitt Waller Ms (math 19% / reading 27%, grade F, #120 of 345 statewide, top 35%, 735 students, 0% FRL); Enid Hs (math 14% / reading 26%, grade F, #236 of 447 statewide, top 61%, 2,252 students, 0% FRL) — zoned schools average 0% FRL vs 64% district-wide (64 pts lower); this property's tenant base skews higher-income than the district average.
- Market conditions: Rents rising (+2.4%/yr); 175 active listings in the ZIP; 19 units permitted in Garfield County in 2024 (0 in 5+ unit buildings).
Forward outlook
- Local home prices are declining (-3.0%/yr); year-one equity from $1k of loan paydown is wiped out by about $5k of value loss. Plan a longer hold.
- Garfield County population projected at +27% by 2050 — long-run rental-demand tailwind backs the buy-and-hold thesis.
Negotiation context
- Only 12 days on market — expect competitive offers; lowballing is unlikely to land.
- 2 sale attempts since 3y ago with the ask held roughly flat each time — persistent listings suggest the price (not the market) is what's stuck; bring a comps-based counter.
Risks & watch-outs
- Climate carrying-cost: extreme-heat days projected 7→19/yr by 2055 (HVAC capex compounding) — expect insurance premiums to compound above CPI over the hold.
Questions for the listing agent
- Built in 1978 — when were the roof, HVAC, electrical panel, plumbing, and water heater last replaced?
- Is there a deadline driving the sale (1031 exchange, divorce, estate, relocation)? That informs how much negotiation room exists.
- Schools are D-rated, which usually means shorter tenancies and higher turnover. Who's the typical renter profile here, and what's been the actual vacancy rate?
- Crime grade is F in this area — have there been break-ins, vandalism, or insurance claims at this property in the last 3 years? What carrier currently insures it and at what premium?
- The area grade is low — what's the realistic commute time and amenity access for the typical tenant pool here? Any planned neighborhood developments (good or bad) we should know about?
- What's the average days-on-market for RENTAL listings here right now (not sales)? A rising rental-DOM trend means longer vacancies and softer asking-rent achievability than the comps imply.
- What's the recent tenant-quality profile in this submarket — average credit score on applications, eviction rate, late-payment / NSF rate, and stable-employment percentage? A property-management company in the area should have these aggregated.
- How much new for-sale + rental construction is in the pipeline within 1–3 miles? Heavy new supply typically softens prices + rents 12–24 months out; constrained supply supports both.
Investment metrics
- 1% rule
- 0.90% ✗
- Cap rate
- 6.68%
- Cash-on-cash
- 1.38%
- DSCR
- 1.06
- GRM
- 9.3
CMA / ARV
- ARV (on-the-fly)
- $175,028
- Comps found
- 12
Show comp detail 12 sales within ~0.75 mi
| Address | Dist | Beds/Ba | Sqft | Sold | Price | $/sf | Match |
|---|---|---|---|---|---|---|---|
| 4321 Valley Frg | 0.05mi | 3/2.0 | 1,332 (+1%) | 4mo | $172,500 | $130 | 92 |
| 4006 Tory Cir | 0.17mi | 3/2.0 | 1,350 (+3%) | 2mo | $179,000 | $133 | 86 |
| 4202 Revere Rd | 0.21mi | 3/2.0 | 1,273 (-3%) | 1mo | $174,900 | $137 | 84 |
| 2513 Mt Vernon Rd | 0.12mi | 3/2.0 | 1,426 (+8%) | 6mo | $199,000 | $140 | 76 |
| 2714 Constitution Ave | 0.10mi | 3/2.0 | 1,435 (+9%) | 7mo | $202,000 | $141 | 74 |
| 2902 Liberty Ln | 0.29mi | 3/2.0 | 1,340 (+2%) | 22mo | $172,500 | $129 | 65 |
| 4008 Philadelphia Pl | 0.18mi | 2/2.0 (-1) | 1,356 (+3%) | 20mo | $170,000 | $125 | 64 |
| 2402 Liberty Ln | 0.23mi | 3/2.0 | 1,479 (+12%) | 9mo | $161,000 | $109 | 61 |
| 2901 Williamsburg | 0.28mi | 3/2.0 | 1,144 (-13%) | 8mo | $180,000 | $157 | 58 |
| 1908 N Oakwood | 0.54mi | 2/2.0 (-1) | 1,255 (-5%) | 5mo | $148,000 | $118 | 58 |
| 2901 Mt Vernon Rd | 0.25mi | 3/2.0 | 1,499 (+14%) | 22mo | $165,000 | $110 | 47 |
| 3709 Scarlet Ln | 0.74mi | 3/2.0 | 1,504 (+14%) | 1mo | $220,000 | $146 | 41 |
Match score weights: distance 35% · size 25% · config 20% · recency 20%. Top-matched comps best support the ARV.
Projected returns pro-forma
-3.0% appreciation · 2.42% rent growth · sell at horizon
- IRR
- -14.7%
- Equity multiple
- 0.48×
- Total profit
- $-24,932
- Equity at exit
- $25,348
- IRR
- -7.0%
- Equity multiple
- 0.56×
- Total profit
- $-20,770
- Equity at exit
- $14,698
Cash invested: $47,600 (down + closing). Projections, not guarantees.
Landlord ↔ Tenant lean methodology
- Overall (STATE)
- 83 Strongly Landlord-Friendly
- State Oklahoma
- 83 Strongly Landlord-Friendly · R+20
- County
- — inherits STATE
- City
- — inherits STATE
ZIP-level market 73703
- Rents YoY
- 2.4%
- Active inventory
- 175
- Price-to-rent
- 9.3×
Monthly cashflow live
- Estimated rent
- $1,525 medium interval (Pro) →
- Mortgage (P&I)
- −$891
- Tax from tax record
- −$188 /mo · $2,252/yr
- Insurance
- −$71
- HOA
- −$0
- Vacancy / Maint / Mgmt
- −$320
- Net cashflow
- $55
Break-even live
Sensitivity live
| Price | -10% $151 | -5% $103 | +0% $55 | +5% $7 | +10% $-41 |
|---|---|---|---|---|---|
| Rent | -10% $-66 | -5% $-5 | +0% $55 | +5% $115 | +10% $175 |
| Rate | -1.0pp $140 | -0.5pp $98 | base $55 | +0.5pp $11 | +1.0pp $-34 |
UW: 25.0% down · 7.5% · 30yr · 1.5% tax · 5.0% vac · 8.0% maint · 8.0% mgmt
Financing live
Cash to close
- Down payment
- $42,500
- Closing costs
- $5,100
- Reserves months
- —
- Total cash needed
- —
Loan-product check · same deal, 3 products live
Conventional
25% down · 7.5% · 30yr
- Down + closing
- —
- Monthly P&I
- —
- Monthly cashflow
- —
- DSCR
- —
- Eligible?
- —
Personal DTI + credit; lowest rate.
DSCR
20% down · 8.5% · 30yr
- Down + closing
- —
- Monthly P&I
- —
- Monthly cashflow
- —
- DSCR
- —
- Eligible?
- —
No personal income docs; deal must DSCR.
Hard money
10% down · 12.0% · 12mo
- Down + closing
- —
- Monthly P&I
- —
- Monthly cashflow
- —
- DSCR
- —
- Eligible?
- —
Short-term bridge; refi at stabilization.
Listing history 10 events
-
2026-06-22days on market $170,000 Active 12 DOM
-
2026-06-21days on market $170,000 Active 11 DOM
-
2026-06-19days on market $170,000 Active 9 DOM
-
2026-06-18days on market $170,000 Active 8 DOM
-
2026-06-17days on market $170,000 Active 7 DOM
-
2026-06-16days on market $170,000 Active 6 DOM
-
2026-06-15days on market $170,000 Active 5 DOM
-
2026-06-14days on market $170,000 Active 3 DOM
-
2026-06-12remarks 699-char remark
-
2026-06-12$170,000 Active 2 DOM
ⓘ Source: listings_history table (triggers on properties + properties_extension) + one-shot
backfill from property_details.listing_events for pre-trigger history.
Tax reassessment forecast OK · Resets to sale price
- Current annual tax
- $2,252 · $188/mo
- Projected year-2 tax
- $2,252 · $188/mo
- Expected delta
- $0/yr ($0/mo · 0.0%)
ⓘ Screening estimate from a state-policy table — verify with the county assessor before closing.
Climate risk First Street
- Flood 1/10 Low FEMA zone X (unshaded) · 0% chance over 30 yrs
- Wildfire 1/10 Low
- Heat 6/10 Major 7 d/yr ≥108°F today · 19 d/yr by 30 yrs out
- Wind 2/10 Low 2% chance of damaging wind over 30 yrs
- Air quality 2/10 Low 0 unhealthy d/yr today · 1 by 30 yrs out
Nearby sold comps map
Loading sold comps map…
Walkable amenities ~0.75 mi
Loading nearby amenities…
Taxation est. · year 1
- Rental income
- $18,301
- − Mortgage interest
- −$9,523
- − Property taxes
- −$2,252
- − Insurance
- −$850
- − Repairs & maintenance
- −$1,464
- − Management
- −$1,464
- − Depreciation
- −$4,945
- Taxable loss
- −$2,197
- Est. tax savings @ 24.0%
- +$527
- After-tax cash flow
- $1,185/yr
For passive investors: Depreciation is non-cash, so a rental often shows a tax loss while cash-flowing — sheltering income. Rental losses are passive: they offset passive income freely, and up to $25,000/yr can offset ordinary (W-2) income if you actively participate and your MAGI is under $100k (phasing out to $0 by $150k); unused losses carry forward. On sale, claimed depreciation is recaptured at up to 25%, and gains may owe capital-gains tax (a 1031 exchange can defer both). Figures are a year-1 estimate at your 24.0% rate — not tax advice; consult a CPA.
Schools (NCES district)
- District
- Enid
- NCES district ID
- 4010920
- Math proficiency
- 19% ▼ -11.00%
- Reading proficiency
- 22% ▼ -9.00%
- Median HH income
- $42,389
- Composite
- 17.59/100
- National rank
- #9040
- State rank
- #168 of 270 in OK
Livability — Enid
- Score
- 63/100
- State rank
- #212
- US rank
- #15472
Category grades
Schools grade is shown separately in the Schools card above.
Census & demographics
- Census place
- Enid, OK
- County
- Garfield County · 55,032 people
- City population
- 55,032
- Metro
- Enid, OK
- Population (ZIP)
- 30,556
- Household income
- $73,333
- Rent vs Own
- Severe rent burden
- 702.0
Population outlook (Garfield County) Hauer SSP2
- Today (2025)
- 69,026 people
- By 2030
- 72,171 · +4.6%
- By 2040
- 79,366 · +15.0%
- By 2050
- 87,847 · +27.3%
- By 2075
- 112,714 · +63.3%
- By 2100
- 135,682 · +96.6%
Race, ethnicity, and origin ACS 2023
- Neighborhood character
- Predominantly White (78%)
- Race & ethnicity
- White 78% Hispanic / Latino 10% Two or more races 9% Black 2% Asian 2% Native American 2%
- Hispanic origin (detail)
- Mexican 8%
- Common ancestry
- Iranian 2% Slovak 2% Serbian 1%
- Foreign-born
- 4% · Canada, China
- Languages at home
- 92% English-only · Spanish 5% Other Asian/Pacific 2% Chinese 1%
Political lean MEDSL · Garfield
- 2024 margin
- Solid R (+53.8) · D 22.2% · R 76.0% · Other 1.8%
- 2008→2024 swing
- -2.8pp toward R · 2008: -51.0pp · 2024: -53.8pp
- All cycles
- 2024: R+53.8 2020: R+53.7 2016: R+53.5 2012: R+52.5 2008: R+51.0
Not yet ingested
- Civics
- —
Market trends
- HPI YoY
- ▼ -111.61%
- Current HPI
- 187.8197
- Rent YoY
- ▲ 2.42%
- Metro
- Enid, OK
- State GDP YoY
- ▲ 1.55%
- F500 in state
- 6
Industry mix (Fortune 500 HQ in OK)
| Industry | F500 HQs | Revenue |
|---|---|---|
| Energy | 3 | $48B |
|
||
Price history
+133.2% since first listed6 events — show timeline
- 2026-06-10 Listed $170,000 MLSOK
- 2023-07-12 Sold (Public Records) $160,000 Public Records
- 2023-07-11 Sold (MLS) $159,900 NWOAR
- 2023-06-03 Listed $159,900 NWOAR
- 2009-09-23 Sold (Public Records) $102,440 Public Records
- 2004-05-26 Sold (Public Records) $72,900 Public Records
Property tax history
+6.8%/yrLatest (2025): $2,252 · +4.3% YoY. Source: county tax records.
Cash-flow waterfall
monthlySold comps — $/sqft
last 12 mo · ≤1 miLoading sold comps…