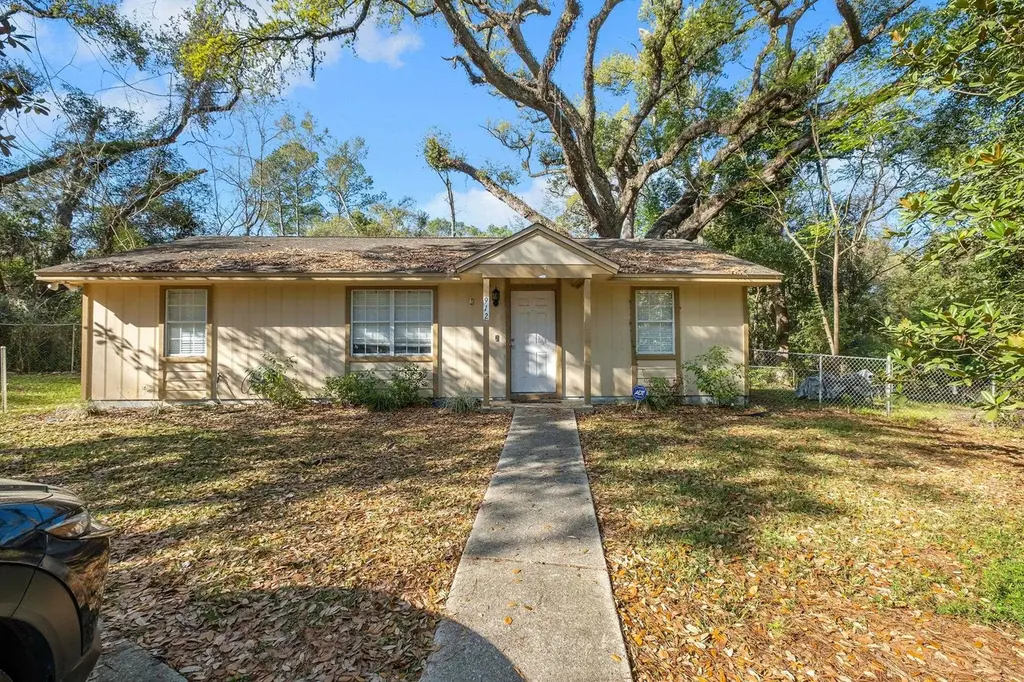
912 Bald Eagle Run · Tallahassee, FL
Flood risk 1/10 · Minimal
- FEMA flood zone
- X (unshaded)
- Chance of flooding over 30 yrs
- 0.0%
- Est. flood insurance / yr
- $507 – $1,088
Fire risk 3/10 · Minor
- Est. fire insurance / yr
- $947 – $1,759
Heat risk 8/10 · Major
- Hot days now (above 108°F)
- 7 days/yr
- Hot days in 30 yrs
- 18 days/yr
Wind risk 9/10 · Severe
- Chance of severe wind over 30 yrs
- 99.0%
Air-quality risk 4/10 · Minor
- Unhealthy air days now
- 5 days/yr
- Unhealthy air days in 30 yrs
- 6 days/yr
Risk factors via First Street. Map © Google.
Why this score? — see what drove the D grade
The composite is a weighted blend of 9 inputs, each scored 0–100. Each bar is that input's sub-score; the figure is the points it added to the 100-point composite (weight × sub-score).
- Cash flow +11.4/30.0
- ARV discount +9.7/15.0
- Schools +4.3/10.0
- Livability +4.3/5.0
- Rent growth +3.7/5.0
- DSCR +3.3/10.0
- 1% rule +3.0/10.0
- Condition / age +2.5/5.0
- Appreciation +0.0/10.0
$169,500
🖨 Deal sheet 📄 Offer letter ✓ Due diligence
Listing remarks MLS
This two bedroom, two bathroom home is close to FSU/FAMU/TCC and would be the perfect buy for students or investors! Close to the downtown area as well. Sliding glass back door leading to a fenced back yard with a storage shed! Master bedroom has a walk in closet.
Key facts
- Spacious pantry
- Stainless appliances
- Ample cabinet space
Tags
Property features AI
Finance
- Financial info: For sale
Exterior
- Parking: Driveway
- Home design: Single-story; Lot approximately 0.1 acres
- Exterior features: Partial fencing; Private maintained road
Interior
- Kitchen: Refrigerator; Stove; Dishwasher
- Bedrooms: Bedroom with dimensions 15x12; Bedroom 2 with dimensions 15x12
- Bathrooms: 2 full bathrooms
- Heating & cooling: Central heating; Central electric air conditioning
- Interior features: Tray ceilings; Vaulted ceilings
- Laundry & utility: Washer; Dryer
Neighborhood map
What this means for you Summary
Snapshot
- This is a 2-bed/2.0-bath single-family listed at $170k.
Deal economics
- At list price, monthly cash flow is $-60 ($-723/yr) — negative.
- To cash-flow at today's rent, offer at most $159k (6.3% below list).
- To meet the 1% rule (rent ≥ 1% of price), the offer needs to be $136k (20.1% below list).
- Recommended offer: $136k (20.1% below list) — sets the bar for 1% rule.
- Cap rate 5.9% vs local median 4.2% in Tallahassee — top-decile yield for the area; either an underpriced asset or a hidden risk that comps aren't pricing in. Stress-test before assuming the spread holds.
Location & tenants
- Location reads 86/100 on livability (#19 in FL, #429 nationally) — a professional / high-income tenant draw. Strengths: amenities A+, commute A+, health & safety A+; Watch: employment D.
- Leon (urban): math 48% / reading 53% proficiency, ranked #33 of 73 in FL (top 45%) — acceptable for families but not a draw, mixed tenant base, ~2y average lease.
- Market conditions: Rents rising fast (+4.7%/yr); 142 active listings in the ZIP; 30 comparable units currently listed for rent nearby; rentals at typical pace (median 21d on market — plan ~3-4 weeks tenant-placement turnaround); lower-income renter base — watch delinquency; 1,765 units permitted in Leon County in 2024 (975 in 5+ unit buildings).
- At $1,355/mo this rent would consume 50% of the median local household income ($32k/yr) (locally 6995% of renters already pay >50% of income on rent) — very limited rent-growth headroom before tenants either downsize or default.
Forward outlook
- Local home prices are declining (-3.0%/yr); year-one equity from $1k of loan paydown is wiped out by about $5k of value loss. Plan a longer hold.
- Leon County population projected at +23% by 2050 — long-run rental-demand tailwind backs the buy-and-hold thesis.
Negotiation context
- It's been on market 97 days — a 9% lower offer ($154k) is reasonable based on typical stale-listing flexibility.
- 4 sale attempts since 20y ago with the ask held roughly flat each time — persistent listings suggest the price (not the market) is what's stuck; bring a comps-based counter.
- Current owner paid $63k; list at $170k implies a 169% gain — meaningful room to come down on a strong offer.
Risks & watch-outs
- Climate carrying-cost: severe wind risk, 99% chance of damaging wind over 30y; extreme-heat days projected 7→18/yr by 2055 (HVAC capex compounding) — expect insurance premiums to compound above CPI over the hold.
Questions for the listing agent
- What do current leases actually rent for vs. the listed asking? Can we see a recent rent roll and the last 12 months of T-12 income?
- It's been on market 97 days. Have you received any prior offers? Is the seller open to a 20% concession, seller financing, or rate buy-down credit?
- Why hasn't it sold? Are there any deal-killer items the seller is aware of (foundation, flood, title, zoning, code violations)?
- Is there a deadline driving the sale (1031 exchange, divorce, estate, relocation)? That informs how much negotiation room exists.
- Schools are B-rated — typically a magnet for longer-tenancy family renters. What's the average tenant stay here, and is there a school-zone premium baked into asking?
- The area grade is low — what's the realistic commute time and amenity access for the typical tenant pool here? Any planned neighborhood developments (good or bad) we should know about?
- What's the average days-on-market for RENTAL listings here right now (not sales)? A rising rental-DOM trend means longer vacancies and softer asking-rent achievability than the comps imply.
- What's the recent tenant-quality profile in this submarket — average credit score on applications, eviction rate, late-payment / NSF rate, and stable-employment percentage? A property-management company in the area should have these aggregated.
- How much new for-sale + rental construction is in the pipeline within 1–3 miles? Heavy new supply typically softens prices + rents 12–24 months out; constrained supply supports both.
Investment metrics
- 1% rule
- 0.80% ✗
- Cap rate
- 5.87%
- Cash-on-cash
- -1.52%
- DSCR
- 0.93
- GRM
- 10.4
CMA / ARV
- ARV (on-the-fly)
- $178,416
- Comps found
- 12
Show comp detail 12 sales within ~0.75 mi
| Address | Dist | Beds/Ba | Sqft | Sold | Price | $/sf | Match |
|---|---|---|---|---|---|---|---|
| 901 Brave Trl | 0.08mi | 3/2.0 (+1) | 1,092 (+8%) | 3mo | $199,900 | $183 | 75 |
| 2113 Melanie Dr | 0.19mi | 3/1.0 (+1) | 975 (-3%) | 9mo | $173,000 | $177 | 69 |
| 1737 Atkamire Dr | 0.31mi | 3/1.0 (+1) | 1,026 (+2%) | 7mo | $180,000 | $175 | 68 |
| 1811 Jackson Bluff Rd | 0.36mi | 3/1.0 (+1) | 1,042 (+3%) | 3mo | $115,000 | $110 | 66 |
| 1824 Tyndall Dr | 0.28mi | 3/1.0 (+1) | 934 (-7%) | 5mo | $165,000 | $177 | 62 |
| 1825 Tyndall Dr | 0.26mi | 3/1.0 (+1) | 912 (-10%) | 6mo | $185,000 | $203 | 58 |
| 1811 Tyndall Dr | 0.32mi | 3/1.0 (+1) | 912 (-10%) | 4mo | $169,000 | $185 | 57 |
| 1658 Sharkey St | 0.47mi | 3/1.0 (+1) | 974 (-3%) | 10mo | $187,000 | $192 | 55 |
| 1631 Mccaskill Ave | 0.61mi | 2/1.0 | 946 (-6%) | 5mo | $98,000 | $104 | 53 |
| 2131 Berkshire Dr | 0.44mi | 3/1.0 (+1) | 912 (-10%) | 9mo | $150,000 | $164 | 47 |
| 1605 Mayhew St | 0.60mi | 3/1.0 (+1) | 912 (-10%) | 8mo | $165,000 | $181 | 41 |
| 1426 Pepper Dr | 0.67mi | 1/1.0 (-1) | 858 (-15%) | 9mo | $92,500 | $108 | 27 |
Match score weights: distance 35% · size 25% · config 20% · recency 20%. Top-matched comps best support the ARV.
Projected returns pro-forma
-3.0% appreciation · 4.69% rent growth · sell at horizon
- IRR
- -17.0%
- Equity multiple
- 0.39×
- Total profit
- $-28,967
- Equity at exit
- $25,273
- IRR
- -6.2%
- Equity multiple
- 0.57×
- Total profit
- $-20,235
- Equity at exit
- $14,655
Cash invested: $47,460 (down + closing). Projections, not guarantees.
Landlord ↔ Tenant lean methodology
- Overall (STATE)
- 87 Strongly Landlord-Friendly
- State Florida
- 87 Strongly Landlord-Friendly · R+3
- County
- — inherits STATE
- City
- — inherits STATE
ZIP-level market 32304
- Home prices YoY
- -21.2%
- Rents YoY
- 4.7%
- Active inventory
- 142
- Price-to-rent
- 10.4×
Monthly cashflow live
- Estimated rent
- $1,355 high interval (Pro) →
- Mortgage (P&I)
- −$889
- Tax from tax record
- −$171 /mo · $2,055/yr
- Insurance
- −$71
- HOA
- −$0
- Vacancy / Maint / Mgmt
- −$285
- Net cashflow
- $-60
Break-even live
UW: 25.0% down · 7.5% · 30yr · 1.5% tax · 5.0% vac · 8.0% maint · 8.0% mgmt
Financing live
Cash to close
- Down payment
- $42,375
- Closing costs
- $5,085
- Reserves months
- —
- Total cash needed
- —
Loan-product check · same deal, 3 products live
Conventional
25% down · 7.5% · 30yr
- Down + closing
- —
- Monthly P&I
- —
- Monthly cashflow
- —
- DSCR
- —
- Eligible?
- —
Personal DTI + credit; lowest rate.
DSCR
20% down · 8.5% · 30yr
- Down + closing
- —
- Monthly P&I
- —
- Monthly cashflow
- —
- DSCR
- —
- Eligible?
- —
No personal income docs; deal must DSCR.
Hard money
10% down · 12.0% · 12mo
- Down + closing
- —
- Monthly P&I
- —
- Monthly cashflow
- —
- DSCR
- —
- Eligible?
- —
Short-term bridge; refi at stabilization.
Rent comps 30 comps
| Address | Beds | Baths | Sqft | Rent | $/sqft | DOM | Units | Dist |
|---|---|---|---|---|---|---|---|---|
| 930 S Lipona Rd Unit D Tallahassee, FL | 2.0 | 2.0 | 896 | $1,295 | $1.45 | 21d | 1 | 0.10mi |
| 2125 Jackson Bluff Rd Tallahassee, FL | 1.0–3.0 | 1.0–2.0 | 975 | $1,172 | $1.20 | 21d | 4 | 0.24mi |
| 2131 Jackson Bluff Rd Tallahassee, FL | 2.0 | 2.0 | 1043 | $1,257 | $1.21 | 13d | 3 | 0.30mi |
| 316 Ausley Rd Tallahassee, FL | 1.0–4.0 | 1.0–2.0 | 750 | $798 | $1.06 | 13d | 8 | 0.40mi |
| 301 S Lipona Rd #24 Tallahassee, FL | 2.0 | 1.5 | 896 | $1,350 | $1.51 | 21d | 1 | 0.43mi |
| 1801 Lenora Dr Tallahassee, FL | 3.0 | 1.0 | 1150 | $1,800 | $1.57 | 21d | 1 | 0.45mi |
| 1854 Belle Vue Way Tallahassee, FL | 2.0–4.0 | 1.0–2.0 | 1100 | $1,235 | $1.12 | 21d | 1 | 0.48mi |
| 1643 Sharkey St Tallahassee, FL | 3.0 | 1.0 | 912 | $1,350 | $1.48 | 21d | 1 | 0.49mi |
| 1606 Airport Dr Tallahassee, FL | 3.0 | 2.0 | 1008 | $1,395 | $1.38 | 21d | 1 | 0.57mi |
| 220 Atkinson Dr Unit D Tallahassee, FL | 2.0 | 1.0 | 928 | $1,100 | $1.19 | 21d | 1 | 0.60mi |
| 1616 McCaskill Ave Tallahassee, FL | 1.0–2.0 | 1.0 | 750 | $969 | $1.29 | 21d | 43 | 0.65mi |
| 1426 Pepper Dr Tallahassee, FL | 2.0 | 1.0 | 858 | $1,250 | $1.46 | 21d | 1 | 0.66mi |
| 1313 Airport Dr Unit DRE6 Tallahassee, FL | 1.0 | 1.5 | 1100 | $1,300 | $1.18 | 13d | 1 | 0.68mi |
| 1327 Jackson Bluff Rd Tallahassee, FL | 2.0–4.0 | 2.0 | 1450 | $475 | $0.33 | 21d | 1 | 0.68mi |
| 1612 Overstreet St Tallahassee, FL | 3.0 | 3.0 | 1500 | $3,300 | $2.20 | 21d | 1 | 0.70mi |
| 1303 Airport Dr Unit A08 Tallahassee, FL | 2.0 | 2.5 | 1083 | $1,475 | $1.36 | 21d | 1 | 0.71mi |
| 317 Mabry St Tallahassee, FL | 2.0 | 1.0 | 808 | $898 | $1.11 | 21d | 1 | 0.75mi |
| 2202 W Pensacola St Tallahassee, FL | 1.0–3.0 | 1.0 | 950 | $1,224 | $1.29 | 21d | 3 | 0.76mi |
| 205 White Dr Tallahassee, FL | 1.0–4.0 | 1.0–4.0 | 1155 | $637 | $0.55 | 21d | 1 | 0.95mi |
| 1240 Levy Ave Tallahassee, FL | 3.0 | 1.0 | 1290 | $1,350 | $1.05 | 21d | 1 | 0.95mi |
| 322 Conradi St Tallahassee, FL | 3.0 | 2.0 | 1100 | $1,950 | $1.77 | 21d | 4 | 1.08mi |
| 833 W Gaines St Tallahassee, FL | 2.0 | 2.0 | 1080 | $2,350 | $2.18 | 13d | 2 | 1.17mi |
| 2182 Timberwood Cir S Unit 1 Tallahassee, FL | 3.0 | 2.5 | 1280 | $1,599 | $1.25 | 21d | 1 | 1.19mi |
| 103 Cactus St Tallahassee, FL | 2.0–4.0 | 1.0–2.0 | 1000 | $1,195 | $1.20 | 13d | 3 | 1.19mi |
| 808 Saint Augustine St Tallahassee, FL | 2.0 | 2.5 | 1500 | $2,095 | $1.40 | 21d | 1 | 1.28mi |
| 1525 W Tennessee St #307 Tallahassee, FL | 2.0 | 1.0 | 1200 | $1,600 | $1.33 | 21d | 1 | 1.29mi |
| 1001 Ocala Rd Tallahassee, FL | 4.0 | 1.0–2.0 | 899 | $584 | $0.65 | 21d | 6 | 1.32mi |
| 2350 Horne Ave Unit 2 Tallahassee, FL | 2.0 | 2.0 | 800 | $995 | $1.24 | 21d | 1 | 1.33mi |
| 1315 Pinellas St Tallahassee, FL | 3.0 | 3.0 | 1197 | $1,450 | $1.21 | 21d | 1 | 1.39mi |
| 900 Taylor St Unit B Tallahassee, FL | 1.0 | 1.0 | 864 | $1,000 | $1.16 | 21d | 1 | 1.45mi |
Listing history 27 events
-
2026-06-18pricedays on market $169,500 Active 97 DOM
-
2026-06-17days on market $175,000 Active 96 DOM
-
2026-06-16days on market $175,000 Active 95 DOM
-
2026-06-15days on market $175,000 Active 94 DOM
-
2026-06-14days on market $175,000 Active 92 DOM
-
2026-06-10days on market $175,000 Active 89 DOM
-
2026-06-09days on market $175,000 Active 88 DOM
-
2026-06-08days on market $175,000 Active 87 DOM
-
2026-06-07days on market $175,000 Active 86 DOM
-
2026-06-05days on market $175,000 Active 83 DOM
-
2026-06-03days on market $175,000 Active 82 DOM
-
2026-06-02days on market $175,000 Active 81 DOM
-
2026-06-01days on market $175,000 Active 80 DOM
-
2026-05-31days on market $175,000 Active 79 DOM
-
2026-05-30days on market $175,000 Active 78 DOM
-
2026-05-06status Active
-
2026-04-20historical Active Under Contract
-
2026-03-13$175,000 Active
-
2015-02-02soldstatus $63,000
-
2013-05-10soldstatus $45,000
-
2013-05-06soldstatus $45,000 264-char remark
Show marketing remark (264 chars)
This two bedroom, two bathroom home is close to FSU/FAMU/TCC and would be the perfect buy for students or investors! Close to the downtown area as well. Sliding glass back door leading to a fenced back yard with a storage shed! Master bedroom has a walk in closet.
-
2012-02-22$45,000 264-char remark
Show marketing remark (264 chars)
This two bedroom, two bathroom home is close to FSU/FAMU/TCC and would be the perfect buy for students or investors! Close to the downtown area as well. Sliding glass back door leading to a fenced back yard with a storage shed! Master bedroom has a walk in closet.
-
2006-09-19soldstatus $122,300
-
2006-09-13soldstatus $122,265
-
2006-05-12$125,000
-
2000-05-05soldstatus $59,000
-
1996-04-17soldstatus $49,900
ⓘ Source: listings_history table (triggers on properties + properties_extension) + one-shot
backfill from property_details.listing_events for pre-trigger history.
Tax reassessment forecast FL · Resets to sale price
- Current annual tax
- $2,055 · $171/mo
- Projected year-2 tax
- $2,055 · $171/mo
- Expected delta
- $0/yr ($0/mo · 0.0%)
ⓘ Screening estimate from a state-policy table — verify with the county assessor before closing.
Climate risk First Street
- Flood 1/10 Low FEMA zone X (unshaded) · 0% chance over 30 yrs
- Wildfire 3/10 Moderate
- Heat 8/10 Severe 7 d/yr ≥108°F today · 18 d/yr by 30 yrs out
- Wind 9/10 Extreme 99% chance of damaging wind over 30 yrs
- Air quality 4/10 Moderate 5 unhealthy d/yr today · 6 by 30 yrs out
Nearby sold comps map
Loading sold comps map…
Walkable amenities ~0.75 mi
Loading nearby amenities…
Taxation est. · year 1
- Rental income
- $16,260
- − Mortgage interest
- −$9,495
- − Property taxes
- −$2,055
- − Insurance
- −$848
- − Repairs & maintenance
- −$1,301
- − Management
- −$1,301
- − Depreciation
- −$4,931
- Taxable loss
- −$3,669
- Est. tax savings @ 24.0%
- +$881
- After-tax cash flow
- $157/yr
For passive investors: Depreciation is non-cash, so a rental often shows a tax loss while cash-flowing — sheltering income. Rental losses are passive: they offset passive income freely, and up to $25,000/yr can offset ordinary (W-2) income if you actively participate and your MAGI is under $100k (phasing out to $0 by $150k); unused losses carry forward. On sale, claimed depreciation is recaptured at up to 25%, and gains may owe capital-gains tax (a 1031 exchange can defer both). Figures are a year-1 estimate at your 24.0% rate — not tax advice; consult a CPA.
Schools (NCES district)
- District
- Leon
- NCES district ID
- 1201110
- Math proficiency
- 48% ▼ -13.00%
- Reading proficiency
- 53% ▼ -5.00%
- Median HH income
- $46,339
- Composite
- 42.84/100
- National rank
- #3131
- State rank
- #33 of 73 in FL
Livability — Tallahassee
- Score
- 86/100
- State rank
- #19
- US rank
- #429
Category grades
Schools grade is shown separately in the Schools card above.
Census & demographics
- Census place
- Tallahassee, FL
- County
- Leon County · 294,472 people
- City population
- 294,472
- Metro
- Tallahassee, FL
- Population (ZIP)
- 51,673
- Household income
- $32,348
- Rent vs Own
- Severe rent burden
- 6995.0
Population outlook (Leon County) Hauer SSP2
- Today (2025)
- 315,507 people
- By 2030
- 330,677 · +4.8%
- By 2040
- 358,465 · +13.6%
- By 2050
- 386,804 · +22.6%
- By 2075
- 465,480 · +47.5%
- By 2100
- 519,959 · +64.8%
Race, ethnicity, and origin ACS 2023
- Neighborhood character
- Diverse neighborhood (Simpson 0.65)
- Race & ethnicity
- White 45% Black 36% Hispanic / Latino 10% Two or more races 7% Asian 4%
- Hispanic origin (detail)
- Mexican 2% Puerto Rican 2% Cuban 2%
- Common ancestry
- Romanian 2% Lithuanian 1% Italian 1%
- Foreign-born
- 8% · Canada, China
- Languages at home
- 86% English-only · Spanish 7% Other Indo-European 2% French/Haitian/Cajun 1%
Political lean MEDSL · Leon
- 2024 margin
- Strong D (+21.8) · D 60.3% · R 38.5% · Other 1.2%
- 2008→2024 swing
- -2.5pp toward R · 2008: 24.3pp · 2024: 21.8pp
- All cycles
- 2024: D+21.8 2020: D+28.3 2016: D+25.1 2012: D+23.6 2008: D+24.3
Not yet ingested
- Civics
- —
Market trends
- HPI YoY
- ▼ -72.04%
- Current HPI
- 267.8426
- Rent YoY
- ▲ 4.69%
- Metro
- Tallahassee, FL
- State GDP YoY
- ▲ 3.28%
- F500 in state
- 36
Industry mix (Fortune 500 HQ in FL)
| Industry | F500 HQs | Revenue |
|---|---|---|
| Industrial Technology | 2 | $29B |
|
||
| Insurance | 2 | $17B |
|
||
| Retail | 1 | $60B |
|
||
| Technology Distribution | 1 | $58B |
|
||
| Homebuilding | 1 | $35B |
|
||
| Technology Manufacturing | 1 | $35B |
|
||
Price history
+250.7% since first listed12 events — show timeline
- 2026-05-06 Relisted — CATRS
- 2026-04-20 Contingent — CATRS
- 2026-03-13 Listed $175,000 CATRS
- 2015-02-02 Sold (Public Records) $63,000 Public Records
- 2013-05-10 Sold (Public Records) $45,000 Public Records
- 2013-05-06 Sold (MLS) $45,000 CATRS
- 2012-02-22 Listed $45,000 CATRS
- 2006-09-19 Sold (Public Records) $122,300 Public Records
- 2006-09-13 Sold (MLS) $122,265 CATRS
- 2006-05-12 Listed $125,000 CATRS
- 2000-05-05 Sold (Public Records) $59,000 Public Records
- 1996-04-17 Sold (Public Records) $49,900 Public Records
Property tax history
+5.9%/yrLatest (2025): $2,055 · +7.5% YoY. Source: county tax records.
Cash-flow waterfall
monthlySold comps — $/sqft
last 12 mo · ≤1 miLoading sold comps…