600 S Main St #4303 · Breckenridge, CO
Flood risk No data
- FEMA flood zone
- —
- Chance of flooding over 30 yrs
- —
- Est. flood insurance / yr
- —
Fire risk No data
- Est. fire insurance / yr
- —
Heat risk No data
- Hot days now (above threshold)
- —
- Hot days in 30 yrs
- —
Wind risk No data
- Chance of severe wind over 30 yrs
- —
Air-quality risk No data
- Unhealthy air days now
- —
- Unhealthy air days in 30 yrs
- —
Risk factors via First Street. Map © Google.
Why this score? — see what drove the D grade
The composite is a weighted blend of 9 inputs, each scored 0–100. Each bar is that input's sub-score; the figure is the points it added to the 100-point composite (weight × sub-score).
- Cash flow +15.0/30.0
- ARV discount +7.5/15.0
- 1% rule +5.0/10.0
- DSCR +5.0/10.0
- Livability +3.6/5.0
- Schools +3.2/10.0
- Rent growth +2.5/5.0
- Condition / age +2.5/5.0
- Appreciation +0.0/10.0
$10,000
🖨 Deal sheet 📄 Offer letter ✓ Due diligence
Listing remarks
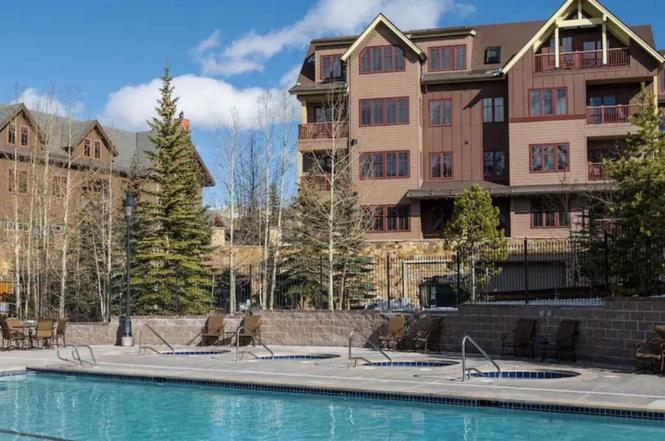
Discover this special 2-bedroom unit at The Residences at Main Street Station – Hyatt Vacation Club. This fractional ownership includes Week 1, a highly sought-after platinum week in the Hyatt system. Owning a 1/20th share grants you 17 days each year—including the set winter week (week 2), 7 summer float days, and 3 extra float days for spring or fall getaways. This particular unit is a highly sought after unit in the building, offering views of the surrounding ski mountains and Maggie pond. The Residences at Main Street Station - Hyatt Vacation Club is located in Breckenridge’s historic district, just a short walk to the Quicksilver Lift and close to shopping, dining, an
Key facts
- Outdoor heated pool
- Close to nightlife
- Close to dining
Tags
Property features AI
Finance
- HOA & community: HOA with annual fee; Annual association fee: $4,475 (approx. $372.92/month); Community fitness center; Building amenities include elevators, on-site management, reception area, screening room, and WiFi
Exterior
- Parking: Assigned underground garage
- Utilities: Public water; Cable available
- Home design: Residential timeshare
- Construction: Concrete construction; Steel siding; Asphalt roof
- Exterior features: Community pool; Storage; City lot; Paved road
Interior
- Kitchen: Dryer; Dishwasher; Electric cooktop; Electric range; Disposal; Microwave; Washer
- Flooring: Carpet; Tile
- Bathrooms: 2 full bathrooms
- Heating & cooling: Baseboard heating; Radiant heating
- Interior features: Eat-in kitchen; Furnished; Gas fireplace
- Laundry & utility: In-unit laundry
Neighborhood map
What this means for you Summary
Snapshot
- This is a 2-bed/2.0-bath timeshare listed at $10k.
Deal economics
- At list price, monthly cash flow is $2k ($25k/yr) — positive.
- The deal already cash-flows at list — no discount required.
- Meets the 1% rule at list price ($3k rent vs $10k).
- Recommended offer: $9k (12.0% below list) — sets the bar for market timing.
- Cap rate 254.8% vs local median 0.7% in Breckenridge — top-decile yield for the area; either an underpriced asset or a hidden risk that comps aren't pricing in. Stress-test before assuming the spread holds.
Location & tenants
- Location reads 72/100 on livability (#62 in CO) — a middle-class / working-renter tenant base. Strengths: commute A+, employment A+, housing B; Watch: health & safety C-, crime D, amenities F.
- Summit School District No. RE-1 (rural): math 27% / reading 43% proficiency, ranked #35 of 86 in CO (top 41%) — families likely to look elsewhere, expect single-tenant / working-renter base with shorter leases.
- Market conditions: 614 active listings in the ZIP; 1 comparable units currently listed for rent nearby; high-income renter base; 308 units permitted in Summit County in 2024 (123 in 5+ unit buildings).
- This rent runs 32% of the median local income ($121k/yr) — at the standard rent-burdened threshold; future hikes will face affordability resistance.
Forward outlook
- Local home prices are declining (-3.0%/yr); year-one equity from $69 of loan paydown is wiped out by about $300 of value loss. Plan a longer hold.
- Summit County population projected at +32% by 2050 — long-run rental-demand tailwind backs the buy-and-hold thesis.
- At projected returns (-3.0% appreciation + 3.0% rent growth), your $3k cash investment doubles in ~1 year — after that, you're playing with house money.
Negotiation context
- It's been on market 408 days — a 12% lower offer ($9k) is reasonable based on typical stale-listing flexibility.
Questions for the listing agent
- It's been on market 408 days. Have you received any prior offers? Is the seller open to a 12% concession, seller financing, or rate buy-down credit?
- What does the HOA fee cover, when was the last increase, and are there any pending special assessments or reserve-fund shortfalls?
- Why hasn't it sold? Are there any deal-killer items the seller is aware of (foundation, flood, title, zoning, code violations)?
- Is there a deadline driving the sale (1031 exchange, divorce, estate, relocation)? That informs how much negotiation room exists.
- Schools are B-rated — typically a magnet for longer-tenancy family renters. What's the average tenant stay here, and is there a school-zone premium baked into asking?
- Crime grade is D in this area — have there been break-ins, vandalism, or insurance claims at this property in the last 3 years? What carrier currently insures it and at what premium?
- The area grade is low — what's the realistic commute time and amenity access for the typical tenant pool here? Any planned neighborhood developments (good or bad) we should know about?
- What's the average days-on-market for RENTAL listings here right now (not sales)? A rising rental-DOM trend means longer vacancies and softer asking-rent achievability than the comps imply.
- What's the recent tenant-quality profile in this submarket — average credit score on applications, eviction rate, late-payment / NSF rate, and stable-employment percentage? A property-management company in the area should have these aggregated.
- How much new for-sale + rental construction is in the pipeline within 1–3 miles? Heavy new supply typically softens prices + rents 12–24 months out; constrained supply supports both.
Investment metrics
- 1% rule
- 31.81% ✓
- Cap rate
- 254.77%
- Cash-on-cash
- 887.41%
- DSCR
- 40.48
- GRM
- 0.3
CMA / ARV
No comps found within radius.
Projected returns pro-forma
-3.0% appreciation · 3.0% rent growth · sell at horizon
- IRR
- —
- Equity multiple
- 47.62×
- Total profit
- $130,536
- Equity at exit
- $1,491
- IRR
- —
- Equity multiple
- 102.65×
- Total profit
- $284,610
- Equity at exit
- $865
Cash invested: $2,800 (down + closing). Projections, not guarantees.
Landlord ↔ Tenant lean methodology
- Overall (STATE)
- 38 Tenant-Leaning
- State Colorado
- 38 Tenant-Leaning · D+4
- County
- — inherits STATE
- City
- — inherits STATE
ZIP-level market 80424
- Active inventory
- 614
- Price-to-rent
- 0.3×
Monthly cashflow live
- Estimated rent
- $3,181 medium interval (Pro) →
- Mortgage (P&I)
- −$52
- Tax est. 1.5%
- −$12 /mo · $150/yr
- Insurance
- −$4
- HOA
- −$373
- Vacancy / Maint / Mgmt
- −$668
- Net cashflow
- $2,071
Break-even live
UW: 25.0% down · 7.5% · 30yr · 1.5% tax · 5.0% vac · 8.0% maint · 8.0% mgmt
Financing live
Cash to close
- Down payment
- $2,500
- Closing costs
- $300
- Reserves months
- —
- Total cash needed
- —
Loan-product check · same deal, 3 products live
Conventional
25% down · 7.5% · 30yr
- Down + closing
- —
- Monthly P&I
- —
- Monthly cashflow
- —
- DSCR
- —
- Eligible?
- —
Personal DTI + credit; lowest rate.
DSCR
20% down · 8.5% · 30yr
- Down + closing
- —
- Monthly P&I
- —
- Monthly cashflow
- —
- DSCR
- —
- Eligible?
- —
No personal income docs; deal must DSCR.
Hard money
10% down · 12.0% · 12mo
- Down + closing
- —
- Monthly P&I
- —
- Monthly cashflow
- —
- DSCR
- —
- Eligible?
- —
Short-term bridge; refi at stabilization.
Rent comps 1 comps
| Address | Beds | Baths | Sqft | Rent | $/sqft | DOM | Units | Dist |
|---|---|---|---|---|---|---|---|---|
| 304 E. Washington RD Breckenridge, CO | 1.0–4.0 | 1.0–4.5 | 1760 | $4,067 | $2.31 | 2d | 2 | 0.49mi |
HOA detail
- Monthly dues
- $373 · $4,476/yr
Listing history 16 events
-
2026-06-19days on market $10,000 Active 408 DOM
-
2026-06-18days on market $10,000 Active 407 DOM
-
2026-06-17days on market $10,000 Active 406 DOM
-
2026-06-16days on market $10,000 Active 405 DOM
-
2026-06-15days on market $10,000 Active 404 DOM
-
2026-06-14days on market $10,000 Active 402 DOM
-
2026-06-12days on market $10,000 Active 401 DOM
-
2026-06-09days on market $10,000 Active 398 DOM
-
2026-06-08days on market $10,000 Active 397 DOM
-
2026-06-07days on market $10,000 Active 396 DOM
-
2026-06-05days on market $10,000 Active 393 DOM
-
2026-06-02days on market $10,000 Active 391 DOM
-
2026-06-01days on market $10,000 Active 390 DOM
-
2026-05-31days on market $10,000 Active 389 DOM
-
2026-05-30days on market $10,000 Active 388 DOM
-
2025-05-07$10,000 Active
ⓘ Source: listings_history table (triggers on properties + properties_extension) + one-shot
backfill from property_details.listing_events for pre-trigger history.
Nearby sold comps map
Loading sold comps map…
Walkable amenities ~0.75 mi
Loading nearby amenities…
Taxation est. · year 1
- Rental income
- $38,168
- − Mortgage interest
- −$560
- − Property taxes
- −$150
- − Insurance
- −$50
- − Repairs & maintenance
- −$3,053
- − Management
- −$3,053
- − HOA
- −$4,476
- − Depreciation
- −$291
- Taxable income
- $26,534
- Est. tax owed @ 24.0%
- −$6,368
- After-tax cash flow
- $18,479/yr
For passive investors: Depreciation is non-cash, so a rental often shows a tax loss while cash-flowing — sheltering income. Rental losses are passive: they offset passive income freely, and up to $25,000/yr can offset ordinary (W-2) income if you actively participate and your MAGI is under $100k (phasing out to $0 by $150k); unused losses carry forward. On sale, claimed depreciation is recaptured at up to 25%, and gains may owe capital-gains tax (a 1031 exchange can defer both). Figures are a year-1 estimate at your 24.0% rate — not tax advice; consult a CPA.
Schools (NCES district)
- District
- Summit School District No. RE-1
- NCES district ID
- 0806810
- Math proficiency
- 27% ▼ -7.00%
- Reading proficiency
- 43% ▼ -7.00%
- Median HH income
- $67,591
- Composite
- 31.97/100
- National rank
- #5840
- State rank
- #35 of 86 in CO
Livability — Breckenridge
- Score
- 72/100
- State rank
- #62
- US rank
- #6014
Category grades
Schools grade is shown separately in the Schools card above.
Census & demographics
- Census place
- Breckenridge, CO
- County
- Summit County · 31,352 people
- City population
- 9,764
- Metro
- Breckenridge, CO
- Population (ZIP)
- 9,764
- Household income
- $120,907
- Rent vs Own
- Severe rent burden
- 181.0
Population outlook (Summit County) Hauer SSP2
- Today (2025)
- 35,421 people
- By 2030
- 37,983 · +7.2%
- By 2040
- 42,597 · +20.3%
- By 2050
- 46,695 · +31.8%
- By 2075
- 55,288 · +56.1%
- By 2100
- 61,033 · +72.3%
Race, ethnicity, and origin ACS 2023
- Neighborhood character
- Predominantly White (82%)
- Race & ethnicity
- White 82% Two or more races 11% Hispanic / Latino 7% Asian 3% Pacific Islander 1%
- Hispanic origin (detail)
- Mexican 6%
- Common ancestry
- Romanian 4% Slovak 4% Scotch-Irish 3%
- Foreign-born
- 5% · Canada, Dominican Republic
- Languages at home
- 95% English-only · Spanish 5%
Political lean MEDSL · Summit
- 2024 margin
- Solid D (+37.2) · D 67.0% · R 29.9% · Other 3.1%
- 2008→2024 swing
- +4.1pp toward D · 2008: 33.0pp · 2024: 37.2pp
- All cycles
- 2024: D+37.2 2020: D+39.5 2016: D+27.6 2012: D+24.4 2008: D+33.0
Not yet ingested
- Civics
- —
Market trends
- HPI YoY
- ▼ -389.29%
- Current HPI
- 311.0453
- Rent YoY
- —
- Metro
- Breckenridge, CO
- State GDP YoY
- ▲ 1.95%
- F500 in state
- 14
Industry mix (Fortune 500 HQ in CO)
| Industry | F500 HQs | Revenue |
|---|---|---|
| Technology Distribution | 1 | $31B |
|
||
| Food / Agriculture | 1 | $18B |
|
||
| Packaging | 1 | $14B |
|
||
| Healthcare | 1 | $13B |
|
||
| Energy | 1 | $10B |
|
||
| Technology | 1 | $4B |
|
||
Price history
1 event — show timeline
- 2025-05-07 Listed $10,000 SAR
Property tax history
+5.0%/yrLatest (2025): $4,122 · +2.5% YoY. Source: county tax records.
Cash-flow waterfall
monthlySold comps — $/sqft
last 12 mo · ≤1 miLoading sold comps…