 Fourplex
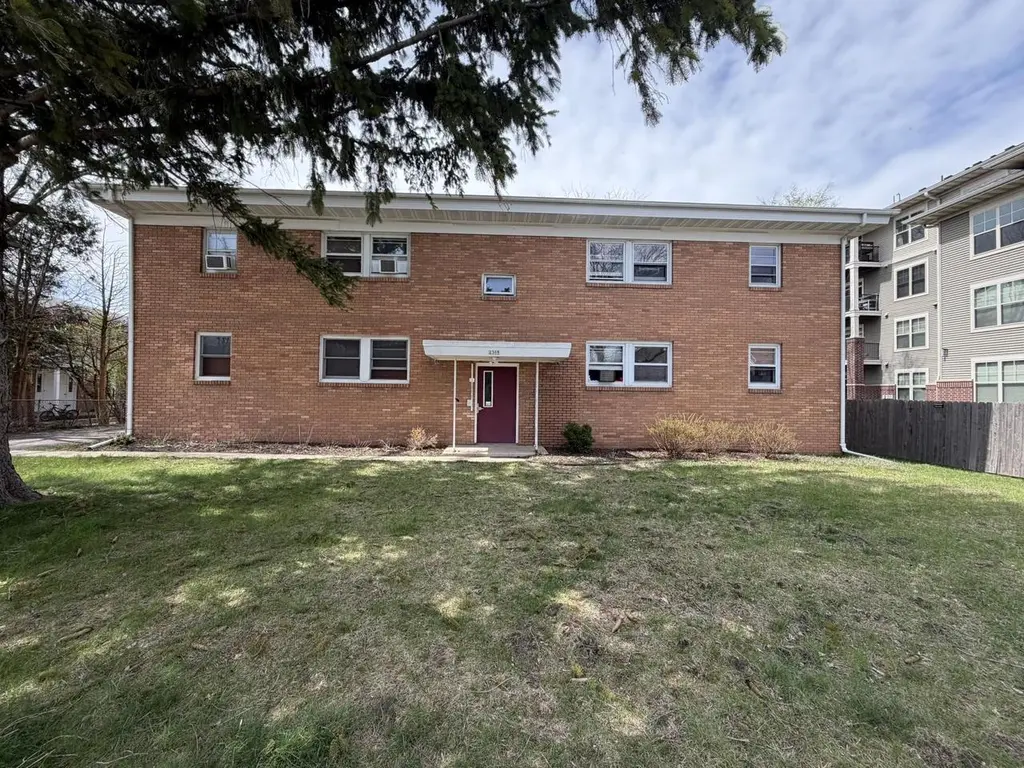
2308 Parmenter St · Middleton, WI
Flood risk No data
- FEMA flood zone
- —
- Chance of flooding over 30 yrs
- —
- Est. flood insurance / yr
- —
Fire risk No data
- Est. fire insurance / yr
- —
Heat risk No data
- Hot days now (above threshold)
- —
- Hot days in 30 yrs
- —
Wind risk No data
- Chance of severe wind over 30 yrs
- —
Air-quality risk No data
- Unhealthy air days now
- —
- Unhealthy air days in 30 yrs
- —
Risk factors via First Street. Map © Google.
Why this score? — see what drove the C grade
The composite is a weighted blend of 9 inputs, each scored 0–100. Each bar is that input's sub-score; the figure is the points it added to the 100-point composite (weight × sub-score).
- Cash flow +20.6/30.0
- ARV discount +7.5/15.0
- DSCR +6.5/10.0
- 1% rule +5.4/10.0
- Schools +4.9/10.0
- Livability +4.5/5.0
- Rent growth +3.2/5.0
- Condition / age +2.8/5.0
- Appreciation +0.0/10.0
$800,000
🖨 Deal sheet 📄 Offer letter ✓ Due diligence
Multi-family units
County records classify this as Multi-Family (2-4 Unit). Listing-text estimate: 4 units. confirmed
Listing remarks
Solid brick 4-unit building in a great location?perfect for investors! Each unit features 2 bedrooms and 1 bathroom, with additional storage space available in the basement for both tenants and landlord use. The property includes a large fenced yard and dedicated parking spaces for each tenant. Rent currently includes heat and water. Recent updates include a new water heater, awning above basement door, new coin-operated laundry machine available in the basement. This well-maintained property has long-term tenants in place and is priced to sell?don?t miss this excellent investment opportunity!
Key facts
- Fenced yard
- New water heater
- Storage space
Tags
Neighborhood map
What this means for you Summary
Snapshot
- This is a 4 × 2-bed/1.0-bath units multifamily listed at $800k. Condition is rated average.
Deal economics
- At list price, monthly cash flow is $1k ($13k/yr) — positive. Per door: $267/mo.
- The deal already cash-flows at list — no discount required.
- Meets the 1% rule at list price ($8k rent vs $800k).
- Cap rate 7.9% vs local median 1.8% in Middleton — top-decile yield for the area; either an underpriced asset or a hidden risk that comps aren't pricing in. Stress-test before assuming the spread holds.
Location & tenants
- Location reads 91/100 on livability (#5 in WI, #61 nationally) — a professional / high-income tenant draw. Strengths: crime A+, commute A+, employment A+; Watch: cost of living D.
- Middleton-Cross Plains Area School District (suburban): math 52% / reading 56% proficiency, ranked #36 of 342 in WI (top 10%) — acceptable for families but not a draw, mixed tenant base, ~2y average lease; only 15% free/reduced lunch — higher-income household profile.
- Zoned schools: Middleton High (math 49% / reading 57%, grade C-, #29 of 483 statewide, top 6%, 2,309 students, 18% FRL) — zoned schools at 18% FRL track the district average.
- Market conditions: Rents rising (+3.0%/yr); 216 active listings in the ZIP; solid renter incomes; 5,519 units permitted in Dane County in 2024 (3,978 in 5+ unit buildings).
- At $8,351/mo this rent would consume 99% of the median local household income ($101k/yr) (locally 911% of renters already pay >50% of income on rent) — very limited rent-growth headroom before tenants either downsize or default.
Forward outlook
- Local home prices are declining (-3.0%/yr); year-one equity from $6k of loan paydown is wiped out by about $24k of value loss. Plan a longer hold.
- Dane County population projected at +35% by 2050 — long-run rental-demand tailwind backs the buy-and-hold thesis.
Negotiation context
- Only 3 days on market — expect competitive offers; lowballing is unlikely to land.
Questions for the listing agent
- Can we see the unit-by-unit rent roll, current vacancy, and any below-market leases? What's the average tenancy length?
- What capital expenditures (roof, boiler, parking lot, exteriors) have been made in the last 5 years, and what's planned in the next 2?
- Built in 1960 — when were the roof, HVAC, electrical panel, plumbing, and water heater last replaced?
- Is there a deadline driving the sale (1031 exchange, divorce, estate, relocation)? That informs how much negotiation room exists.
- Schools are A-rated — typically a magnet for longer-tenancy family renters. What's the average tenant stay here, and is there a school-zone premium baked into asking?
- What's the average days-on-market for RENTAL listings here right now (not sales)? A rising rental-DOM trend means longer vacancies and softer asking-rent achievability than the comps imply.
- What's the recent tenant-quality profile in this submarket — average credit score on applications, eviction rate, late-payment / NSF rate, and stable-employment percentage? A property-management company in the area should have these aggregated.
- How much new apartment / multifamily construction is in the pipeline within 1–3 miles? Heavy new supply (>2% of stock underway) typically softens rents 12–24 months out; light construction supports rent growth.
Investment metrics
- 1% rule
- 1.04% ✓
- Cap rate
- 7.90%
- Cash-on-cash
- 5.73%
- DSCR
- 1.25
- GRM
- 8.0
CMA / ARV
No comps found within radius.
Show comp detail 1 sale within ~0.75 mi
| Address | Dist | Beds/Ba | Sqft | Sold | Price | $/sf | Match |
|---|---|---|---|---|---|---|---|
| 2308 Parmenter St | 0.00mi | 8/4.0 | — | 1mo | $810,000 | — | 87 |
Match score weights: distance 35% · size 25% · config 20% · recency 20%. Top-matched comps best support the ARV.
Projected returns pro-forma
-3.0% appreciation · 2.95% rent growth · sell at horizon
- IRR
- -7.5%
- Equity multiple
- 0.72×
- Total profit
- $-61,864
- Equity at exit
- $119,283
- IRR
- 2.0%
- Equity multiple
- 1.15×
- Total profit
- $32,564
- Equity at exit
- $69,169
Cash invested: $224,000 (down + closing). Projections, not guarantees.
Landlord ↔ Tenant lean methodology
- Overall (STATE)
- 73 Landlord-Friendly
- State Wisconsin
- 73 Landlord-Friendly · R+2
- County
- — inherits STATE
- City
- — inherits STATE
ZIP-level market 53562
- Rents YoY
- 3.0%
- Active inventory
- 216
- Price-to-rent
- 31.9×
Monthly cashflow live
- Estimated rent
- $8,351 high interval (Pro) →
- Mortgage (P&I)
- −$4,195
- Tax est. 1.5%
- −$1,000 /mo · $12,000/yr
- Insurance
- −$333
- HOA
- −$0
- Vacancy / Maint / Mgmt
- −$1,754
- Net cashflow
- $1,069
Break-even live
4-unit breakdown (identical units grouped — click to expand)
| Units | Beds | Baths | Est. rent |
|---|---|---|---|
| 4× units | 2 | 1 | $8,352 |
| #1 | 2 | 1 | $2,088 |
| #2 | 2 | 1 | $2,088 |
| #3 | 2 | 1 | $2,088 |
| #4 | 2 | 1 | $2,088 |
| Total (4 units) | $8,351 | ||
UW: 25.0% down · 7.5% · 30yr · 1.5% tax · 5.0% vac · 8.0% maint · 8.0% mgmt
Financing live
Cash to close
- Down payment
- $200,000
- Closing costs
- $24,000
- Reserves months
- —
- Total cash needed
- —
Loan-product check · same deal, 3 products live
Conventional
25% down · 7.5% · 30yr
- Down + closing
- —
- Monthly P&I
- —
- Monthly cashflow
- —
- DSCR
- —
- Eligible?
- —
Personal DTI + credit; lowest rate.
DSCR
20% down · 8.5% · 30yr
- Down + closing
- —
- Monthly P&I
- —
- Monthly cashflow
- —
- DSCR
- —
- Eligible?
- —
No personal income docs; deal must DSCR.
Hard money
10% down · 12.0% · 12mo
- Down + closing
- —
- Monthly P&I
- —
- Monthly cashflow
- —
- DSCR
- —
- Eligible?
- —
Short-term bridge; refi at stabilization.
Listing history 2 events
-
2026-04-23status Pending
-
2026-04-20$800,000 Active
ⓘ Source: listings_history table (triggers on properties + properties_extension) + one-shot
backfill from property_details.listing_events for pre-trigger history.
Nearby sold comps map
Loading sold comps map…
Walkable amenities ~0.75 mi
Loading nearby amenities…
Taxation est. · year 1
- Rental income
- $100,212
- − Mortgage interest
- −$44,812
- − Property taxes
- −$12,000
- − Insurance
- −$4,000
- − Repairs & maintenance
- −$8,017
- − Management
- −$8,017
- − Depreciation
- −$23,273
- Taxable income
- $93
- Est. tax owed @ 24.0%
- −$22
- After-tax cash flow
- $12,802/yr
For passive investors: Depreciation is non-cash, so a rental often shows a tax loss while cash-flowing — sheltering income. Rental losses are passive: they offset passive income freely, and up to $25,000/yr can offset ordinary (W-2) income if you actively participate and your MAGI is under $100k (phasing out to $0 by $150k); unused losses carry forward. On sale, claimed depreciation is recaptured at up to 25%, and gains may owe capital-gains tax (a 1031 exchange can defer both). Figures are a year-1 estimate at your 24.0% rate — not tax advice; consult a CPA.
Condition & rehab AI · 11 photos
This 4-unit multi-family property requires moderate repairs and maintenance to improve its condition and value. Fresh paint and landscaping upgrades can significantly enhance its appeal for both resale and rental.
Repairs flagged
- Minor Staircase and hallway walls — Visible discoloration and minor cracking on walls.
- Minor Basement ceiling — Exposed pipes and concrete ceiling suggest potential water damage or need for waterproofing.
Value-add opportunities
- Both Paint exterior and interior walls — Fresh paint can improve the home's curb appeal and interior aesthetics, enhancing both resale and rental value.
- Both Landscaping and fencing maintenance — A well-maintained yard and fence can significantly boost the home's curb appeal and rental value.
Renovation cost estimate screening
| Repair item | Severity | Est. cost |
|---|---|---|
| Staircase and hallway walls · Visible discoloration and minor cracking on walls. | Minor | $500–3,000 |
| Basement ceiling · Exposed pipes and concrete ceiling suggest potential water damage or need for waterproofing. | Minor | $500–3,000 |
| Total estimated repair cost · 2 items | $1,000–6,000 |
Value-add ROI direction
- Both Paint exterior and interior walls — Fresh paint can improve the home's curb appeal and interior aesthetics, enhancing both resale and rental value. ↑
- Both Landscaping and fencing maintenance — A well-maintained yard and fence can significantly boost the home's curb appeal and rental value. ↑
ⓘ Cost ranges are severity-bucket heuristics (US national rule-of-thumb). Get contractor quotes + a written scope before underwriting a rehab budget.
Schools (NCES district)
- District
- Middleton-Cross Plains Area School District
- NCES district ID
- 5509510
- Math proficiency
- 52% ▼ -12.00%
- Reading proficiency
- 56% ▼ -4.00%
- Median HH income
- $75,614
- Composite
- 48.54/100
- National rank
- #2116
- State rank
- #36 of 342 in WI
Livability — Middleton
- Score
- 91/100
- State rank
- #5
- US rank
- #61
Category grades
Schools grade is shown separately in the Schools card above.
Census & demographics
- Census place
- Middleton, WI
- County
- Dane County · 506,461 people
- City population
- 29,790
- Metro
- Madison, WI
- Population (ZIP)
- 29,790
- Household income
- $101,381
- Rent vs Own
- Severe rent burden
- 911.0
Population outlook (Dane County) Hauer SSP2
- Today (2025)
- 610,707 people
- By 2030
- 654,875 · +7.2%
- By 2040
- 740,480 · +21.2%
- By 2050
- 826,188 · +35.3%
- By 2075
- 1,040,574 · +70.4%
- By 2100
- 1,168,084 · +91.3%
Race, ethnicity, and origin ACS 2023
- Neighborhood character
- Predominantly White (77%)
- Race & ethnicity
- White 77% Hispanic / Latino 9% Asian 8% Two or more races 7% Black 2%
- Hispanic origin (detail)
- Mexican 4%
- Common ancestry
- Portuguese 8% Romanian 5% Slovak 3%
- Foreign-born
- 9% · Canada, China, Jamaica
- Languages at home
- 87% English-only · Spanish 5% Chinese 2% Other Asian/Pacific 2%
Political lean MEDSL · Dane
- 2024 margin
- Solid D (+51.7) · D 75.1% · R 23.4% · Other 1.5%
- 2008→2024 swing
- +4.7pp toward D · 2008: 47.0pp · 2024: 51.7pp
- All cycles
- 2024: D+51.7 2020: D+52.6 2016: D+48.0 2012: D+43.6 2008: D+47.0
Not yet ingested
- Civics
- —
Market trends
- HPI YoY
- ▼ -360.72%
- Current HPI
- 285.5796
- Rent YoY
- ▲ 2.95%
- Metro
- Madison, WI
- State GDP YoY
- ▲ 2.10%
- F500 in state
- 20
Industry mix (Fortune 500 HQ in WI)
| Industry | F500 HQs | Revenue |
|---|---|---|
| Industrial Machinery | 4 | $23B |
|
||
| Industrial Technology | 2 | $36B |
|
||
| Insurance | 1 | $36B |
|
||
| Professional Services | 1 | $19B |
|
||
| Utilities | 1 | $9B |
|
||
| Consumer Goods | 1 | $3B |
|
||
Price history
2 events — show timeline
- 2026-04-23 Pending — SCWMLS
- 2026-04-20 Listed $800,000 SCWMLS
Cash-flow waterfall
monthlySold comps — $/sqft
last 12 mo · ≤1 miLoading sold comps…