4816 Hal Dr · Chattanooga, TN
Flood risk 8/10 · Major
- FEMA flood zone
- X (unshaded)
- Chance of flooding over 30 yrs
- 0.99%
- Est. flood insurance / yr
- $507 – $1,088
Fire risk 1/10 · Minimal
- Est. fire insurance / yr
- $949 – $1,763
Heat risk 6/10 · Moderate
- Hot days now (above 105°F)
- 7 days/yr
- Hot days in 30 yrs
- 19 days/yr
Wind risk 4/10 · Minor
- Chance of severe wind over 30 yrs
- 10.0%
Air-quality risk 3/10 · Minor
- Unhealthy air days now
- 2 days/yr
- Unhealthy air days in 30 yrs
- 2 days/yr
Risk factors via First Street. Map © Google.
Why this score? — see what drove the C- grade
The composite is a weighted blend of 9 inputs, each scored 0–100. Each bar is that input's sub-score; the figure is the points it added to the 100-point composite (weight × sub-score).
- Cash flow +16.1/30.0
- ARV discount +15.0/15.0
- DSCR +5.0/10.0
- Livability +3.9/5.0
- 1% rule +3.2/10.0
- Schools +2.7/10.0
- Condition / age +2.5/5.0
- Rent growth +2.4/5.0
- Appreciation +0.0/10.0
$170,000
🖨 Deal sheet 📄 Offer letter ✓ Due diligence
Listing remarks
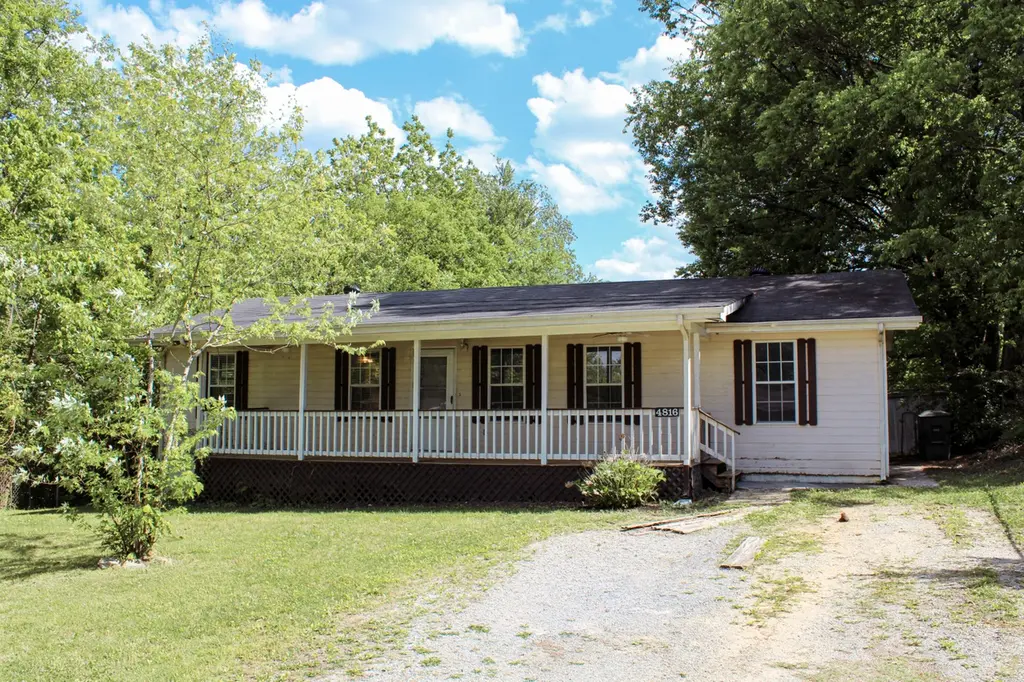
Welcome to this charming one-level home in Chattanooga offering 3 bedrooms, 1.5 bathrooms, and plenty of potential! Inside, you'll find beautiful hardwood floors, a functional layout, and an unfinished bonus room just off the kitchen that could easily become a home office, playroom, mudroom, or additional living space. Enjoy mornings on the covered front porch and evenings in the spacious level yard, complete with a storage shed for extra convenience. Whether you're looking for your next home or an investment opportunity, this property is full of possibilities and ready for its next owner to make it their own. * THIS PROPERTY IS BEING SOLD AS IS *
Key facts
- Covered front porch
- Spacious level yard
- Storage shed
Tags
Property features AI
Finance
- Other: Lot is level and approximately 0.47 acres (approx. dimensions 75 x 241.3); Subdivision: Lake Terrace
Exterior
- Parking: Concrete driveway
- Utilities: Public water; Public sewer; Electricity connected; Natural gas available; Water connected; Sewer connected
- Home design: Single-family residence; One story
- Construction: Other construction materials
- Exterior features: Covered porch; Patio; Shed(s) / exterior storage
Interior
- Bedrooms: Total of 7 rooms (bedroom count not specified)
- Flooring: Hardwood; Tile
- Bathrooms: 1 full bathroom; 1 half bathroom
- Heating & cooling: Central heating (electric); Central air conditioning (electric)
- Interior features: Hardwood and tile flooring; Storage
Neighborhood map
What this means for you Summary
Snapshot
- This is a 3-bed/1.5-bath single-family listed at $170k.
Deal economics
- At list price, monthly cash flow is $22 ($265/yr) — positive.
- The deal already cash-flows at list — no discount required.
- To meet the 1% rule (rent ≥ 1% of price), the offer needs to be $139k (18.0% below list).
- Recommended offer: $139k (18.0% below list) — sets the bar for 1% rule.
- Cap rate 6.9% vs local median 3.4% in Chattanooga — top-decile yield for the area; either an underpriced asset or a hidden risk that comps aren't pricing in. Stress-test before assuming the spread holds.
Location & tenants
- Location reads 78/100 on livability (#3 in TN, #2,582 nationally) — a middle-class / working-renter tenant base. Strengths: amenities A+, commute A+, cost of living A+; Watch: employment D+, crime F.
- Hamilton County (urban): math 31% / reading 31% proficiency, ranked #42 of 139 in TN (top 30%) — families likely to look elsewhere, expect single-tenant / working-renter base with shorter leases.
- Zoned schools: Harrison Elementary (math 20% / reading 19%, grade F, #654 of 952 statewide, top 72%, 1,013 students, 0% FRL); Brown Middle School (math 14% / reading 15%, grade F, #231 of 333 statewide, top 70%, 344 students, 0% FRL); Central High School (math 8% / reading 32%, grade F, #183 of 332 statewide, top 59%, 749 students, 0% FRL) — zoned schools average 0% FRL vs 52% district-wide (52 pts lower); this property's tenant base skews higher-income than the district average.
- Zoned-school proficiency averages 18% at this address vs 31% district-wide (-13 pts) — the specific schools serving this property underperform the Hamilton County average; the district grade overstates school quality for this exact location.
- Market conditions: Rents soft (-0.2%/yr); 99 active listings in the ZIP; 13 comparable units currently listed for rent nearby; rentals at typical pace (median 24d on market — plan ~3-4 weeks tenant-placement turnaround); 2,133 units permitted in Hamilton County in 2024 (405 in 5+ unit buildings).
Forward outlook
- Local home prices are declining (-3.0%/yr); year-one equity from $1k of loan paydown is wiped out by about $5k of value loss. Plan a longer hold.
- Hamilton County population projected at +23% by 2050 — long-run rental-demand tailwind backs the buy-and-hold thesis.
Negotiation context
- Only 4 days on market — expect competitive offers; lowballing is unlikely to land.
- 3 sale attempts since 18y ago with the ask held roughly flat each time — persistent listings suggest the price (not the market) is what's stuck; bring a comps-based counter.
- Current owner paid $70k; list at $170k implies a 143% gain — meaningful room to come down on a strong offer.
Risks & watch-outs
- Watch-outs: flood insurance adds $66/mo; built in 1958 — expect roof / HVAC / electrical / plumbing capex.
- Climate carrying-cost: severe flood risk; extreme-heat days projected 7→19/yr by 2055 (HVAC capex compounding) — expect insurance premiums to compound above CPI over the hold.
Questions for the listing agent
- Built in 1958 — when were the roof, HVAC, electrical panel, plumbing, and water heater last replaced?
- What's the actual annual flood-insurance premium (NFIP or private), and is the property in a SFHA with mandatory coverage?
- Is there a deadline driving the sale (1031 exchange, divorce, estate, relocation)? That informs how much negotiation room exists.
- Schools are F-rated, which usually means shorter tenancies and higher turnover. Who's the typical renter profile here, and what's been the actual vacancy rate?
- Crime grade is F in this area — have there been break-ins, vandalism, or insurance claims at this property in the last 3 years? What carrier currently insures it and at what premium?
- What's the average days-on-market for RENTAL listings here right now (not sales)? A rising rental-DOM trend means longer vacancies and softer asking-rent achievability than the comps imply.
- What's the recent tenant-quality profile in this submarket — average credit score on applications, eviction rate, late-payment / NSF rate, and stable-employment percentage? A property-management company in the area should have these aggregated.
- How much new for-sale + rental construction is in the pipeline within 1–3 miles? Heavy new supply typically softens prices + rents 12–24 months out; constrained supply supports both.
Investment metrics
- 1% rule
- 0.82% ✗
- Cap rate
- 6.92%
- Cash-on-cash
- 2.23%
- DSCR
- 1.10
- GRM
- 10.2
CMA / ARV
- ARV (on-the-fly)
- $253,044
- Comps found
- 8
Show comp detail 8 sales within ~0.75 mi
| Address | Dist | Beds/Ba | Sqft | Sold | Price | $/sf | Match |
|---|---|---|---|---|---|---|---|
| 4809 Briarwood Dr | 0.05mi | 3/2.0 | 1,162 (-2%) | 15mo | $240,000 | $207 | 80 |
| 4702 Beverly Kay Dr | 0.15mi | 3/2.0 | 1,200 (+1%) | 22mo | $255,000 | $213 | 71 |
| 4716 Beverly Kay Dr | 0.24mi | 3/2.0 | 1,224 (+3%) | 18mo | $220,000 | $180 | 67 |
| 4728 Jersey Pike | 0.33mi | 3/2.0 | 1,231 (+4%) | 23mo | $270,000 | $219 | 57 |
| 4026 Teakwood Dr | 0.64mi | 3/2.0 | 1,120 (-6%) | 4mo | $250,000 | $223 | 55 |
| 4722 Mink Pl | 0.35mi | 4/1.5 (+1) | 1,320 (+11%) | 19mo | $258,900 | $196 | 44 |
| 7606 Cecelia Dr | 0.70mi | 3/2.0 | 1,296 (+9%) | 8mo | $292,000 | $225 | 44 |
| 4550 Tricia Dr | 0.38mi | 3/2.0 | 1,337 (+12%) | 18mo | $249,900 | $187 | 44 |
Match score weights: distance 35% · size 25% · config 20% · recency 20%. Top-matched comps best support the ARV.
Projected returns pro-forma
-3.0% appreciation · 0.0% rent growth · sell at horizon
- IRR
- -18.6%
- Equity multiple
- 0.36×
- Total profit
- $-30,267
- Equity at exit
- $25,348
- IRR
- -17.8%
- Equity multiple
- 0.15×
- Total profit
- $-40,491
- Equity at exit
- $14,698
Cash invested: $47,600 (down + closing). Projections, not guarantees.
Landlord ↔ Tenant lean methodology
- Overall (STATE)
- 87 Strongly Landlord-Friendly
- State Tennessee
- 87 Strongly Landlord-Friendly · R+13
- County
- — inherits STATE
- City
- — inherits STATE
ZIP-level market 37416
- Home prices YoY
- -30.5%
- Rents YoY
- -0.2%
- Active inventory
- 99
- Price-to-rent
- 10.2×
Monthly cashflow live
- Estimated rent
- $1,394 high interval (Pro) →
- Mortgage (P&I)
- −$891
- Tax from tax record
- −$51 /mo · $608/yr
- Insurance
- −$71
- Flood insurance flood zone
- −$66 /mo · $798/yr
- HOA
- −$0
- Vacancy / Maint / Mgmt
- −$293
- Net cashflow
- $22
Break-even live
UW: 25.0% down · 7.5% · 30yr · 1.5% tax · 5.0% vac · 8.0% maint · 8.0% mgmt
Financing live
Cash to close
- Down payment
- $42,500
- Closing costs
- $5,100
- Reserves months
- —
- Total cash needed
- —
Loan-product check · same deal, 3 products live
Conventional
25% down · 7.5% · 30yr
- Down + closing
- —
- Monthly P&I
- —
- Monthly cashflow
- —
- DSCR
- —
- Eligible?
- —
Personal DTI + credit; lowest rate.
DSCR
20% down · 8.5% · 30yr
- Down + closing
- —
- Monthly P&I
- —
- Monthly cashflow
- —
- DSCR
- —
- Eligible?
- —
No personal income docs; deal must DSCR.
Hard money
10% down · 12.0% · 12mo
- Down + closing
- —
- Monthly P&I
- —
- Monthly cashflow
- —
- DSCR
- —
- Eligible?
- —
Short-term bridge; refi at stabilization.
Rent comps 13 comps
| Address | Beds | Baths | Sqft | Rent | $/sqft | DOM | Units | Dist |
|---|---|---|---|---|---|---|---|---|
| 4025 Oakwood Dr Chattanooga, TN | 1.0–3.0 | 1.0–2.0 | 997 | $1,685 | $1.69 | 13d | 14 | 0.62mi |
| 3982 Arbor Place Ln Chattanooga, TN | 2.0 | 1.0 | 1070 | $1,095 | $1.02 | 23d | 1 | 0.63mi |
| 4715 Bonny Oaks Dr Chattanooga, TN | 1.0–2.0 | 1.0–2.0 | 912 | $1,425 | $1.56 | 13d | 19 | 0.67mi |
| 4041 Arbor Place Ln Chattanooga, TN | 2.0 | 1.0 | 960 | $1,250 | $1.30 | 21d | 1 | 0.69mi |
| 4041 Arbor Place Ln Chattanooga, TN | 2.0 | 1.0 | 960 | $1,250 | $1.30 | 13d | 1 | 0.69mi |
| 4059 Arbor Place Ln Chattanooga, TN | 2.0 | 1.0 | 908 | $1,295 | $1.43 | 21d | 1 | 0.73mi |
| 3907 Kingsbridge Rd Unit 3907 Chattanooga, TN | 2.0 | 1.5 | 1240 | $1,250 | $1.01 | 23d | 1 | 0.87mi |
| 7716 Nautical Way Chattanooga, TN | 2.0 | 1.0 | 850 | $1,350 | $1.59 | 23d | 1 | 1.03mi |
| 4125 Wilkesview Dr Chattanooga, TN | 2.0 | 1.0 | 969 | $975 | $1.01 | 23d | 1 | 1.07mi |
| 7741 Nautical Way Chattanooga, TN | 4.0 | 2.0 | 1196 | $1,900 | $1.59 | 23d | 1 | 1.08mi |
| 7808 Holiday Hills Cir Unit A Chattanooga, TN | 2.0 | 1.5 | 1040 | $1,045 | $1.00 | 13d | 1 | 1.08mi |
| 4149 Willard Dr Chattanooga, TN | 2.0 | 1.5 | 985 | $975 | $0.99 | 23d | 1 | 1.11mi |
| 7490 Austin Dr Unit 7492 Chattanooga, TN | 2.0 | 1.0 | 936 | $1,395 | $1.49 | 23d | 1 | 1.42mi |
Listing history 6 events
-
2026-05-13status Pending
-
2026-05-08$170,000 Active
-
2011-09-16$95,900
-
2008-09-10$105,000
-
1996-09-11soldstatus $70,000
-
1995-09-26soldstatus $40,000
ⓘ Source: listings_history table (triggers on properties + properties_extension) + one-shot
backfill from property_details.listing_events for pre-trigger history.
Tax reassessment forecast TN · Resets to sale price
- Current annual tax
- $608 · $51/mo
- Projected year-2 tax
- $1,207 · $101/mo
- Expected delta
- +$599/yr (+$50/mo · 98.6%)
ⓘ Screening estimate from a state-policy table — verify with the county assessor before closing.
Climate risk First Street
- Flood 8/10 Severe FEMA zone X (unshaded) · 99% chance over 30 yrs
- Wildfire 1/10 Low
- Heat 6/10 Major 7 d/yr ≥105°F today · 19 d/yr by 30 yrs out
- Wind 4/10 Moderate 10% chance of damaging wind over 30 yrs
- Air quality 3/10 Moderate 2 unhealthy d/yr today · 2 by 30 yrs out
Nearby sold comps map
Loading sold comps map…
Walkable amenities ~0.75 mi
Loading nearby amenities…
Taxation est. · year 1
- Rental income
- $16,731
- − Mortgage interest
- −$9,523
- − Property taxes
- −$608
- − Insurance
- −$1,648
- − Repairs & maintenance
- −$1,339
- − Management
- −$1,339
- − Depreciation
- −$4,945
- Taxable loss
- −$2,669
- Est. tax savings @ 24.0%
- +$641
- After-tax cash flow
- $905/yr
For passive investors: Depreciation is non-cash, so a rental often shows a tax loss while cash-flowing — sheltering income. Rental losses are passive: they offset passive income freely, and up to $25,000/yr can offset ordinary (W-2) income if you actively participate and your MAGI is under $100k (phasing out to $0 by $150k); unused losses carry forward. On sale, claimed depreciation is recaptured at up to 25%, and gains may owe capital-gains tax (a 1031 exchange can defer both). Figures are a year-1 estimate at your 24.0% rate — not tax advice; consult a CPA.
Schools (NCES district)
- District
- Hamilton County
- NCES district ID
- 4701590
- Math proficiency
- 31% ▼ -10.00%
- Reading proficiency
- 31% ▼ -3.00%
- Median HH income
- $47,456
- Composite
- 26.8/100
- National rank
- #7122
- State rank
- #42 of 139 in TN
Livability — Chattanooga
- Score
- 78/100
- State rank
- #3
- US rank
- #2582
Category grades
Schools grade is shown separately in the Schools card above.
Census & demographics
- Census place
- Chattanooga, TN
- County
- Hamilton County · 312,777 people
- City population
- 131,999
- Metro
- Chattanooga, TN-GA
- Population (ZIP)
- 13,919
- Household income
- $70,705
- Rent vs Own
- Severe rent burden
- 480.0
Population outlook (Hamilton County) Hauer SSP2
- Today (2025)
- 393,784 people
- By 2030
- 412,983 · +4.9%
- By 2040
- 449,502 · +14.1%
- By 2050
- 484,341 · +23.0%
- By 2075
- 565,746 · +43.7%
- By 2100
- 618,394 · +57.0%
Race, ethnicity, and origin ACS 2023
- Neighborhood character
- Diverse neighborhood (Simpson 0.59)
- Race & ethnicity
- White 47% Black 43% Two or more races 5% Hispanic / Latino 4% Asian 1%
- Common ancestry
- Hispanic 4% Italian 3% Slovak 1%
- Foreign-born
- 8% · Canada, South Korea
- Languages at home
- 89% English-only · Spanish 5% French/Haitian/Cajun 5% Other Indo-European 1%
Political lean MEDSL · Hamilton
- 2024 margin
- R (+13.1) · D 42.7% · R 55.7% · Other 1.6%
- 2008→2024 swing
- -1.2pp toward R · 2008: -11.8pp · 2024: -13.1pp
- All cycles
- 2024: R+13.1 2020: R+9.7 2016: R+16.6 2012: R+14.8 2008: R+11.8
Not yet ingested
- Civics
- —
Market trends
- HPI YoY
- ▼ -112.99%
- Current HPI
- 257.5129
- Rent YoY
- ▼ -0.22%
- Metro
- Chattanooga, TN-GA
- State GDP YoY
- ▲ 2.78%
- F500 in state
- 22
Industry mix (Fortune 500 HQ in TN)
| Industry | F500 HQs | Revenue |
|---|---|---|
| Healthcare | 3 | $91B |
|
||
| Retail | 3 | $72B |
|
||
| Transportation / Logistics | 1 | $88B |
|
||
| Paper / Packaging | 1 | $19B |
|
||
| Insurance | 1 | $13B |
|
||
| Energy | 1 | $12B |
|
||
Price history
+325.0% since first listed6 events — show timeline
- 2026-05-13 Pending — GCAR
- 2026-05-08 Listed $170,000 GCAR
- 2011-09-16 Listed $95,900 RCAOR
- 2008-09-10 Listed $105,000 RCAOR
- 1996-09-11 Sold (Public Records) $70,000 Public Records
- 1995-09-26 Sold (Public Records) $40,000 Public Records
Property tax history
-0.0%/yrLatest (2025): $608 · -10.3% YoY. Source: county tax records.
Cash-flow waterfall
monthlySold comps — $/sqft
last 12 mo · ≤1 miLoading sold comps…