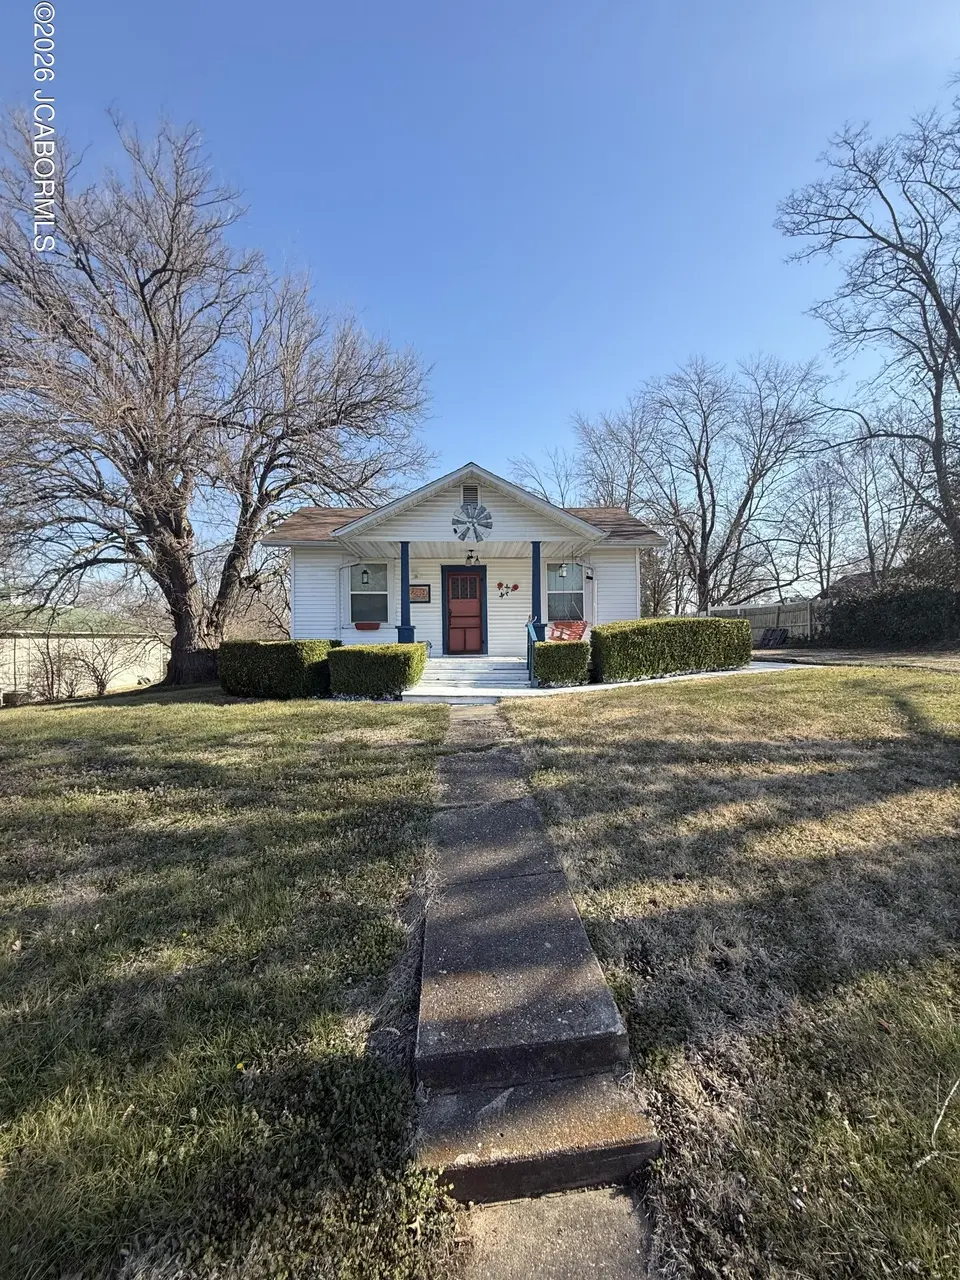
219 Willow Dr · New Bloomfield, MO
Flood risk 1/10 · Minimal
- FEMA flood zone
- X (unshaded)
- Chance of flooding over 30 yrs
- 0.0%
- Est. flood insurance / yr
- $473 – $860
Fire risk 3/10 · Minor
- Est. fire insurance / yr
- $1,054 – $1,958
Heat risk 4/10 · Minor
- Hot days now (above 107°F)
- 7 days/yr
- Hot days in 30 yrs
- 19 days/yr
Wind risk 2/10 · Minimal
- Chance of severe wind over 30 yrs
- 0.0%
Air-quality risk 1/10 · Minimal
- Unhealthy air days now
- 0 days/yr
- Unhealthy air days in 30 yrs
- 0 days/yr
Risk factors via First Street. Map © Google.
Why this score? — see what drove the B- grade
The composite is a weighted blend of 9 inputs, each scored 0–100. Each bar is that input's sub-score; the figure is the points it added to the 100-point composite (weight × sub-score).
- Cash flow +25.9/30.0
- ARV discount +15.0/15.0
- DSCR +8.7/10.0
- 1% rule +6.0/10.0
- Schools +3.3/10.0
- Livability +3.2/5.0
- Rent growth +2.5/5.0
- Condition / age +2.5/5.0
- Appreciation +0.0/10.0
$160,000
🖨 Deal sheet 📄 Offer letter ✓ Due diligence
Listing remarks MLS
2 bedroom, 1 bath home on large lot. Large deck and shop plus storage shed. OWNER/BROKER.
Key facts
- Spacious back deck
- Tool shed
- Large yard
Tags
Neighborhood map
What this means for you Summary
Snapshot
- This is a 2-bed/1.0-bath single-family listed at $160k.
Deal economics
- At list price, monthly cash flow is $395 ($5k/yr) — positive.
- The deal already cash-flows at list — no discount required.
- Meets the 1% rule at list price ($2k rent vs $160k).
Location & tenants
- Location reads 63/100 on livability (#365 in MO) — a middle-class / working-renter tenant base. Strengths: cost of living A+, housing A+; Watch: schools D, crime F, amenities F.
- New Bloomfield R-III (rural): math 35% / reading 39% proficiency, ranked #165 of 324 in MO (top 51%) — families likely to look elsewhere, expect single-tenant / working-renter base with shorter leases.
- Market conditions: 35 active listings in the ZIP; 40 units permitted in Callaway County in 2024 (0 in 5+ unit buildings).
Forward outlook
- Local home prices are declining (-3.0%/yr); year-one equity from $1k of loan paydown is wiped out by about $5k of value loss. Plan a longer hold.
Negotiation context
- Only 7 days on market — expect competitive offers; lowballing is unlikely to land.
- 5 sale attempts since 12y ago with the ask held roughly flat each time — persistent listings suggest the price (not the market) is what's stuck; bring a comps-based counter.
- Current owner paid $74k; list at $160k implies a 116% gain — meaningful room to come down on a strong offer.
Questions for the listing agent
- Is there a deadline driving the sale (1031 exchange, divorce, estate, relocation)? That informs how much negotiation room exists.
- Schools are D-rated, which usually means shorter tenancies and higher turnover. Who's the typical renter profile here, and what's been the actual vacancy rate?
- Crime grade is F in this area — have there been break-ins, vandalism, or insurance claims at this property in the last 3 years? What carrier currently insures it and at what premium?
- What's the average days-on-market for RENTAL listings here right now (not sales)? A rising rental-DOM trend means longer vacancies and softer asking-rent achievability than the comps imply.
- What's the recent tenant-quality profile in this submarket — average credit score on applications, eviction rate, late-payment / NSF rate, and stable-employment percentage? A property-management company in the area should have these aggregated.
- How much new for-sale + rental construction is in the pipeline within 1–3 miles? Heavy new supply typically softens prices + rents 12–24 months out; constrained supply supports both.
Investment metrics
- 1% rule
- 1.10% ✓
- Cap rate
- 9.26%
- Cash-on-cash
- 10.59%
- DSCR
- 1.47
- GRM
- 7.6
CMA / ARV
- ARV (on-the-fly)
- $202,575
- Comps found
- 6
Show comp detail 6 sales within ~0.75 mi
| Address | Dist | Beds/Ba | Sqft | Sold | Price | $/sf | Match |
|---|---|---|---|---|---|---|---|
| 108 Oak St | 0.08mi | 3/1.0 (+1) | 960 (-12%) | 22mo | $179,900 | $187 | 53 |
| 102 Chevy Chase Ln | 0.66mi | 3/1.0 (+1) | 1,000 (-9%) | 1mo | $184,900 | $185 | 49 |
| 711 Redwood Dr | 0.61mi | 3/1.0 (+1) | 1,103 (+1%) | 20mo | $209,900 | $190 | 49 |
| 222 Maple St | 0.22mi | 3/2.0 (+1) | 1,258 (+15%) | 18mo | $185,000 | $147 | 41 |
| 336 Elmwood Circle Cir | 0.65mi | 3/1.0 (+1) | 1,022 (-7%) | 22mo | $165,000 | $161 | 35 |
| 614 Cedar Ln | 0.60mi | 3/1.0 (+1) | 959 (-12%) | 19mo | $161,900 | $169 | 30 |
Match score weights: distance 35% · size 25% · config 20% · recency 20%. Top-matched comps best support the ARV.
Projected returns pro-forma
-3.0% appreciation · 3.0% rent growth · sell at horizon
- IRR
- -0.5%
- Equity multiple
- 0.98×
- Total profit
- $-781
- Equity at exit
- $23,857
- IRR
- 9.2%
- Equity multiple
- 1.70×
- Total profit
- $31,578
- Equity at exit
- $13,834
Cash invested: $44,800 (down + closing). Projections, not guarantees.
Landlord ↔ Tenant lean methodology
- Overall (STATE)
- 81 Strongly Landlord-Friendly
- State Missouri
- 81 Strongly Landlord-Friendly · R+10
- County
- — inherits STATE
- City
- — inherits STATE
ZIP-level market 65063
- Home prices YoY
- -26.8%
- Active inventory
- 35
- Price-to-rent
- 7.6×
Monthly cashflow live
- Estimated rent
- $1,756 medium interval (Pro) →
- Mortgage (P&I)
- −$839
- Tax from tax record
- −$86 /mo · $1,034/yr
- Insurance
- −$67
- HOA
- −$0
- Vacancy / Maint / Mgmt
- −$369
- Net cashflow
- $395
Break-even live
UW: 25.0% down · 7.5% · 30yr · 1.5% tax · 5.0% vac · 8.0% maint · 8.0% mgmt
Financing live
Cash to close
- Down payment
- $40,000
- Closing costs
- $4,800
- Reserves months
- —
- Total cash needed
- —
Loan-product check · same deal, 3 products live
Conventional
25% down · 7.5% · 30yr
- Down + closing
- —
- Monthly P&I
- —
- Monthly cashflow
- —
- DSCR
- —
- Eligible?
- —
Personal DTI + credit; lowest rate.
DSCR
20% down · 8.5% · 30yr
- Down + closing
- —
- Monthly P&I
- —
- Monthly cashflow
- —
- DSCR
- —
- Eligible?
- —
No personal income docs; deal must DSCR.
Hard money
10% down · 12.0% · 12mo
- Down + closing
- —
- Monthly P&I
- —
- Monthly cashflow
- —
- DSCR
- —
- Eligible?
- —
Short-term bridge; refi at stabilization.
Listing history 6 events
-
2026-06-16days on market $160,000 Active 7 DOM
-
2026-06-15days on market $160,000 Active 6 DOM
-
2026-06-14days on market $160,000 Active 4 DOM
-
2026-06-13days on market $160,000 Active 3 DOM
-
2026-06-10remarks 683-char remark
-
2026-06-10$160,000 Active 1 DOM
ⓘ Source: listings_history table (triggers on properties + properties_extension) + one-shot
backfill from property_details.listing_events for pre-trigger history.
Tax reassessment forecast MO · Resets to sale price
- Current annual tax
- $1,034 · $86/mo
- Projected year-2 tax
- $1,552 · $129/mo
- Expected delta
- +$518/yr (+$43/mo · 50.1%)
ⓘ Screening estimate from a state-policy table — verify with the county assessor before closing.
Climate risk First Street
- Flood 1/10 Low FEMA zone X (unshaded) · 0% chance over 30 yrs
- Wildfire 3/10 Moderate
- Heat 4/10 Moderate 7 d/yr ≥107°F today · 19 d/yr by 30 yrs out
- Wind 2/10 Low 0% chance of damaging wind over 30 yrs
- Air quality 1/10 Low 0 unhealthy d/yr today · 0 by 30 yrs out
Nearby sold comps map
Loading sold comps map…
Walkable amenities ~0.75 mi
Loading nearby amenities…
Taxation est. · year 1
- Rental income
- $21,074
- − Mortgage interest
- −$8,962
- − Property taxes
- −$1,034
- − Insurance
- −$800
- − Repairs & maintenance
- −$1,686
- − Management
- −$1,686
- − Depreciation
- −$4,655
- Taxable income
- $2,251
- Est. tax owed @ 24.0%
- −$540
- After-tax cash flow
- $4,206/yr
For passive investors: Depreciation is non-cash, so a rental often shows a tax loss while cash-flowing — sheltering income. Rental losses are passive: they offset passive income freely, and up to $25,000/yr can offset ordinary (W-2) income if you actively participate and your MAGI is under $100k (phasing out to $0 by $150k); unused losses carry forward. On sale, claimed depreciation is recaptured at up to 25%, and gains may owe capital-gains tax (a 1031 exchange can defer both). Figures are a year-1 estimate at your 24.0% rate — not tax advice; consult a CPA.
Schools (NCES district)
- District
- New Bloomfield R-III
- NCES district ID
- 2921875
- Math proficiency
- 35% ▼ -5.00%
- Reading proficiency
- 39% ▼ -6.00%
- Median HH income
- $60,892
- Composite
- 33.04/100
- National rank
- #5574
- State rank
- #165 of 324 in MO
Livability — New Bloomfield
- Score
- 63/100
- State rank
- #365
- US rank
- #16061
Category grades
Schools grade is shown separately in the Schools card above.
Census & demographics
- Census place
- New Bloomfield, MO
- City population
- 4,180
- Population (ZIP)
- 4,180
Population outlook (Callaway County) Hauer SSP2
- Today (2025)
- 45,390 people
- By 2030
- 45,493 · +0.2%
- By 2040
- 45,092 · -0.7%
- By 2050
- 44,069 · -2.9%
- By 2075
- 41,875 · -7.7%
- By 2100
- 38,094 · -16.1%
Race, ethnicity, and origin ACS 2023
- Neighborhood character
- Predominantly White (91%)
- Race & ethnicity
- White 91% Two or more races 7% Hispanic / Latino 2%
- Common ancestry
- Italian 2% Slovak 2% Lithuanian 2%
- Foreign-born
- 1%
- Languages at home
- 97% English-only · Spanish 1%
Political lean MEDSL · Callaway
- 2024 margin
- Solid R (+43.3) · D 27.6% · R 70.9% · Other 1.5%
- 2008→2024 swing
- -23.6pp toward R · 2008: -19.7pp · 2024: -43.3pp
- All cycles
- 2024: R+43.3 2020: R+42.3 2016: R+42.2 2012: R+31.1 2008: R+19.7
Not yet ingested
- Civics
- —
Market trends
- HPI YoY
- ▼ -75.75%
- Current HPI
- 206.671
- Rent YoY
- —
- Metro
- —
- State GDP YoY
- ▲ 1.84%
- F500 in state
- 20
Industry mix (Fortune 500 HQ in MO)
| Industry | F500 HQs | Revenue |
|---|---|---|
| Healthcare | 1 | $163B |
|
||
| Insurance | 1 | $21B |
|
||
| Industrial Technology | 1 | $17B |
|
||
| Retail | 1 | $16B |
|
||
| Industrial Distribution | 1 | $10B |
|
||
| Utilities | 1 | $9B |
|
||
Price history
+128.6% since first listed12 events — show timeline
- 2026-06-09 Listed $160,000 FSBO.com
- 2026-03-20 Sold (Public Records) — Public Records
- 2026-03-20 Sold (MLS) — JCMLS
- 2026-02-21 Listed $176,000 JCMLS
- 2018-12-13 Sold (Public Records) $74,000 Public Records
- 2018-12-13 Sold (MLS) — HMMLS
- 2018-12-13 Sold (MLS) — JCMLS
- 2018-10-22 Listed $73,250 HMMLS
- 2018-10-22 Listed $73,250 JCMLS
- 2014-10-10 Listed $69,999 HMMLS
- 2006-05-09 Sold (Public Records) — Public Records
- 2002-08-15 Sold (Public Records) — Public Records
Property tax history
+7.8%/yrLatest (2025): $1,034 · -1.4% YoY. Source: county tax records.
Cash-flow waterfall
monthlySold comps — $/sqft
last 12 mo · ≤1 miLoading sold comps…