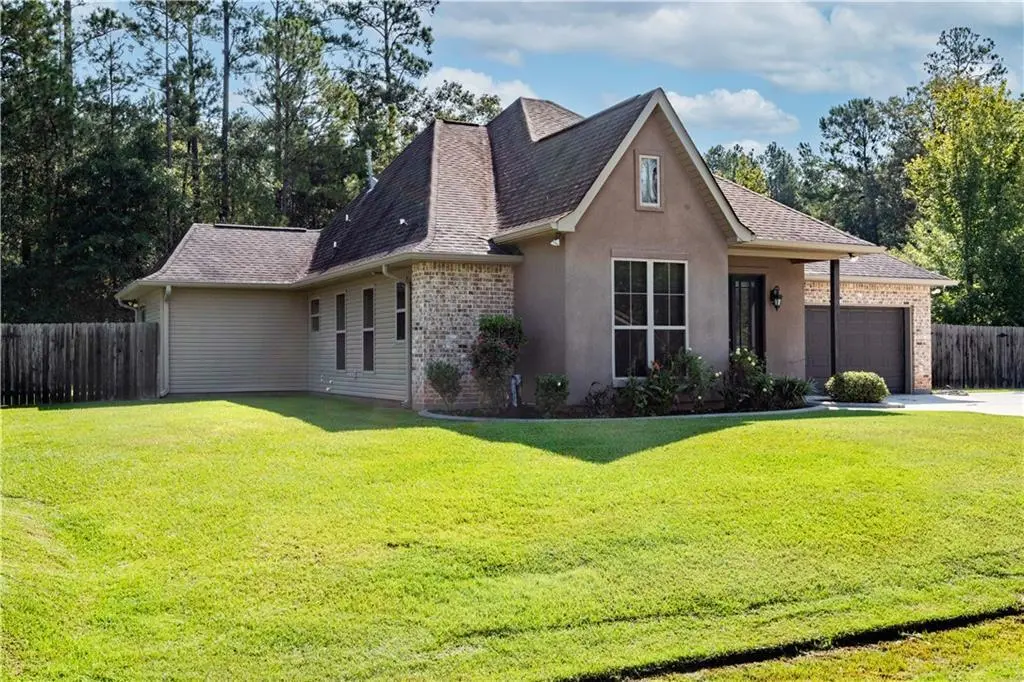
300 Summit Ct · Covington, LA
Flood risk 4/10 · Minor
- FEMA flood zone
- X
- Chance of flooding over 30 yrs
- 0.22%
- Est. flood insurance / yr
- $507 – $1,088
Fire risk 6/10 · Moderate
- Est. fire insurance / yr
- $1,269 – $2,357
Heat risk 9/10 · Severe
- Hot days now (above 109°F)
- 7 days/yr
- Hot days in 30 yrs
- 22 days/yr
Wind risk 9/10 · Severe
- Chance of severe wind over 30 yrs
- 99.0%
Air-quality risk 2/10 · Minimal
- Unhealthy air days now
- 0 days/yr
- Unhealthy air days in 30 yrs
- 1 days/yr
Risk factors via First Street. Map © Google.
Why this score? — see what drove the B- grade
The composite is a weighted blend of 9 inputs, each scored 0–100. Each bar is that input's sub-score; the figure is the points it added to the 100-point composite (weight × sub-score).
- Cash flow +27.1/30.0
- ARV discount +9.6/15.0
- DSCR +9.4/10.0
- 1% rule +6.4/10.0
- Schools +4.3/10.0
- Livability +3.8/5.0
- Rent growth +2.5/5.0
- Condition / age +2.5/5.0
- Appreciation +0.0/10.0
$275,000
🖨 Deal sheet 📄 Offer letter ✓ Due diligence
Listing remarks MLS
Welcome to Eagle Landing in Covington! This open floor plan home features polished concrete floors, a double tray ceiling in the living room, and a kitchen built for the way you actually live -- large island, granite countertops, stainless appliances, and yes, a wine rack. The dining area is filled with natural light and looks out over the large, fenced backyard. The primary suite has a tray ceiling, custom tile shower, soaking tub, and a walk-in closet that won't disappoint. Head outside to a covered back patio, extra parking pad, and a fully fenced backyard on an oversized corner lot with rear yard access -- plenty space to spread out! Easy access to I-12, top St. Tammany Schools, shopping, and restaurants. Schedule your showing today!
Key facts
- Double tray ceiling
- Wine rack
- Stainless appliances
Tags
Property features AI
Finance
- HOA & community: Homeowners association with annual fee of $300
Exterior
- Parking: Garage; Driveway
- Utilities: Public water; Public sewer
- Home design: Single-story; Corner lot; Located outside city limits; Property condition: Excellent
- Construction: Brick, stucco and vinyl siding exterior; Shake roof; Slab foundation; Built with quality construction materials
- Exterior features: Fence; Permeable paving; Covered concrete patio/porch
Interior
- Kitchen: Dishwasher; Oven; Range; Disposal; Granite counters; Pantry; Stainless steel appliances
- Bedrooms: Total rooms: 9
- Bathrooms: 2 full bathrooms
- Heating & cooling: Central heating (gas); Central air conditioning
- Interior features: Attic; Tray ceilings; Ceiling fans; Granite counters; Pantry; Pull-down attic stairs; Stainless steel appliances
Neighborhood map
What this means for you Summary
Snapshot
- This is a 3-bed/2.0-bath single-family listed at $275k.
Deal economics
- At list price, monthly cash flow is $778 ($9k/yr) — positive.
- The deal already cash-flows at list — no discount required.
- Meets the 1% rule at list price ($3k rent vs $275k).
- Cap rate 9.7% vs local median 3.9% in Covington — top-decile yield for the area; either an underpriced asset or a hidden risk that comps aren't pricing in. Stress-test before assuming the spread holds.
Location & tenants
- Location reads 75/100 on livability (#17 in LA, #3,876 nationally) — a middle-class / working-renter tenant base. Strengths: employment A+, housing A+, health & safety A+; Watch: amenities F, commute F.
- St. Tammany Parish (suburban): math 43% / reading 55% proficiency, ranked #11 of 98 in LA (top 11%) — families likely to look elsewhere, expect single-tenant / working-renter base with shorter leases.
- Zoned schools: Madisonville Elementary School (1,145 students, 27% FRL); Covington High School (math 32% / reading 44%, grade F, #90 of 265 statewide, top 34%, 1,660 students, 46% FRL) — zoned schools at 36% FRL track the district average.
- Market conditions: 365 active listings in the ZIP; 2 comparable units currently listed for rent nearby; solid renter incomes; 1,064 units permitted in St. Tammany Parish in 2024 (0 in 5+ unit buildings).
- At $3,148/mo this rent would consume 47% of the median local household income ($81k/yr) (locally 296% of renters already pay >50% of income on rent) — very limited rent-growth headroom before tenants either downsize or default.
Forward outlook
- Local home prices are declining (-3.0%/yr); year-one equity from $2k of loan paydown is wiped out by about $8k of value loss. Plan a longer hold.
- St. Tammany County population projected at +27% by 2050 — long-run rental-demand tailwind backs the buy-and-hold thesis.
- At projected returns (-3.0% appreciation + 3.0% rent growth), your $77k cash investment doubles in ~10 years — after that, you're playing with house money.
Negotiation context
- Only 3 days on market — expect competitive offers; lowballing is unlikely to land.
- 7 sale attempts since 13y ago with the ask held roughly flat each time — persistent listings suggest the price (not the market) is what's stuck; bring a comps-based counter.
- Current owner paid $210k; 31% above their basis — modest negotiation headroom, anchor on the comps not their cost.
Risks & watch-outs
- Climate carrying-cost: severe wind risk, 99% chance of damaging wind over 30y; major wildfire risk; extreme-heat days projected 7→22/yr by 2055 (HVAC capex compounding) — expect insurance premiums to compound above CPI over the hold.
Questions for the listing agent
- What does the HOA fee cover, when was the last increase, and are there any pending special assessments or reserve-fund shortfalls?
- Is there a deadline driving the sale (1031 exchange, divorce, estate, relocation)? That informs how much negotiation room exists.
- Schools are B-rated — typically a magnet for longer-tenancy family renters. What's the average tenant stay here, and is there a school-zone premium baked into asking?
- What's the average days-on-market for RENTAL listings here right now (not sales)? A rising rental-DOM trend means longer vacancies and softer asking-rent achievability than the comps imply.
- What's the recent tenant-quality profile in this submarket — average credit score on applications, eviction rate, late-payment / NSF rate, and stable-employment percentage? A property-management company in the area should have these aggregated.
- How much new for-sale + rental construction is in the pipeline within 1–3 miles? Heavy new supply typically softens prices + rents 12–24 months out; constrained supply supports both.
Investment metrics
- 1% rule
- 1.14% ✓
- Cap rate
- 9.69%
- Cash-on-cash
- 12.12%
- DSCR
- 1.54
- GRM
- 7.3
CMA / ARV
- ARV (on-the-fly)
- $288,149
- Comps found
- 12
Show comp detail 12 sales within ~0.75 mi
| Address | Dist | Beds/Ba | Sqft | Sold | Price | $/sf | Match |
|---|---|---|---|---|---|---|---|
| 208 Treetop Ct | 0.08mi | 3/2.0 | 1,479 (-1%) | 1mo | $260,000 | $176 | 94 |
| 181 Northridge Dr | 0.13mi | 3/2.0 | 1,429 (-4%) | 1mo | $280,000 | $196 | 86 |
| 134 Northridge Dr | 0.23mi | 3/2.0 | 1,543 (+3%) | 2mo | $250,000 | $162 | 82 |
| 509 Bateleur Way | 0.25mi | 3/2.0 | 1,439 (-4%) | 1mo | $265,000 | $184 | 82 |
| 175 Northridge Dr | 0.14mi | 3/2.0 | 1,517 (+2%) | 11mo | $240,000 | $158 | 82 |
| 187 Northridge Dr | 0.11mi | 3/2.0 | 1,420 (-5%) | 11mo | $250,000 | $176 | 78 |
| 552 Bateleur Way | 0.32mi | 3/2.0 | 1,498 (+0%) | 8mo | $277,000 | $185 | 78 |
| 425 Bateleur Way | 0.13mi | 3/2.0 | 1,430 (-4%) | 13mo | $277,500 | $194 | 76 |
| 579 Bateleur Way | 0.37mi | 3/2.0 | 1,545 (+4%) | 2mo | $298,000 | $193 | 75 |
| 437 Bateleur Way | 0.17mi | 3/2.0 | 1,400 (-6%) | 10mo | $280,000 | $200 | 74 |
| 113 Eagle Landing Dr | 0.05mi | 3/2.0 | 1,334 (-11%) | 10mo | $273,000 | $205 | 72 |
| 132 Eagle Landing Dr | 0.12mi | 3/2.0 | 1,352 (-9%) | 9mo | $267,000 | $197 | 71 |
Match score weights: distance 35% · size 25% · config 20% · recency 20%. Top-matched comps best support the ARV.
Projected returns pro-forma
-3.0% appreciation · 3.0% rent growth · sell at horizon
- IRR
- 1.7%
- Equity multiple
- 1.06×
- Total profit
- $4,888
- Equity at exit
- $41,003
- IRR
- 11.2%
- Equity multiple
- 1.88×
- Total profit
- $67,737
- Equity at exit
- $23,777
Cash invested: $77,000 (down + closing). Projections, not guarantees.
Landlord ↔ Tenant lean methodology
- Overall (STATE)
- 90 Strongly Landlord-Friendly
- State Louisiana
- 90 Strongly Landlord-Friendly · R+12
- County
- — inherits STATE
- City
- — inherits STATE
ZIP-level market 70435
- Home prices YoY
- -27.3%
- Active inventory
- 365
- Price-to-rent
- 7.3×
Monthly cashflow live
- Estimated rent
- $3,148 medium interval (Pro) →
- Mortgage (P&I)
- −$1,442
- Tax from tax record
- −$128 /mo · $1,532/yr
- Insurance
- −$115
- HOA
- −$25
- Vacancy / Maint / Mgmt
- −$661
- Net cashflow
- $778
Break-even live
UW: 25.0% down · 7.5% · 30yr · 1.5% tax · 5.0% vac · 8.0% maint · 8.0% mgmt
Financing live
Cash to close
- Down payment
- $68,750
- Closing costs
- $8,250
- Reserves months
- —
- Total cash needed
- —
Loan-product check · same deal, 3 products live
Conventional
25% down · 7.5% · 30yr
- Down + closing
- —
- Monthly P&I
- —
- Monthly cashflow
- —
- DSCR
- —
- Eligible?
- —
Personal DTI + credit; lowest rate.
DSCR
20% down · 8.5% · 30yr
- Down + closing
- —
- Monthly P&I
- —
- Monthly cashflow
- —
- DSCR
- —
- Eligible?
- —
No personal income docs; deal must DSCR.
Hard money
10% down · 12.0% · 12mo
- Down + closing
- —
- Monthly P&I
- —
- Monthly cashflow
- —
- DSCR
- —
- Eligible?
- —
Short-term bridge; refi at stabilization.
Rent comps 2 comps
| Address | Beds | Baths | Sqft | Rent | $/sqft | DOM | Units | Dist |
|---|---|---|---|---|---|---|---|---|
| 12099 Jones Rd Covington, LA | 3.0 | 2.0 | 1700 | $3,950 | $2.32 | 3d | 1 | 0.87mi |
| 12099 Jones Rd Covington, LA | 3.0 | 2.0 | 1700 | $3,650 | $2.15 | 11d | 1 | 0.87mi |
HOA detail
- Monthly dues
- $25 · $300/yr
Listing history 4 events
-
2026-06-18days on market $275,000 Active 3 DOM
-
2026-06-17days on market $275,000 Active 2 DOM
-
2026-06-16remarks 681-char remark
-
2026-06-16$275,000 Active 1 DOM
ⓘ Source: listings_history table (triggers on properties + properties_extension) + one-shot
backfill from property_details.listing_events for pre-trigger history.
Tax reassessment forecast LA · Resets to sale price
- Current annual tax
- $1,532 · $128/mo
- Projected year-2 tax
- $1,532 · $128/mo
- Expected delta
- $0/yr ($0/mo · 0.0%)
ⓘ Screening estimate from a state-policy table — verify with the county assessor before closing.
Climate risk First Street
- Flood 4/10 Moderate FEMA zone X · 22% chance over 30 yrs
- Wildfire 6/10 Major
- Heat 9/10 Extreme 7 d/yr ≥109°F today · 22 d/yr by 30 yrs out
- Wind 9/10 Extreme 99% chance of damaging wind over 30 yrs
- Air quality 2/10 Low 0 unhealthy d/yr today · 1 by 30 yrs out
Nearby sold comps map
Loading sold comps map…
Walkable amenities ~0.75 mi
Loading nearby amenities…
Taxation est. · year 1
- Rental income
- $37,776
- − Mortgage interest
- −$15,404
- − Property taxes
- −$1,532
- − Insurance
- −$1,375
- − Repairs & maintenance
- −$3,022
- − Management
- −$3,022
- − HOA
- −$300
- − Depreciation
- −$8,000
- Taxable income
- $5,120
- Est. tax owed @ 24.0%
- −$1,229
- After-tax cash flow
- $8,101/yr
For passive investors: Depreciation is non-cash, so a rental often shows a tax loss while cash-flowing — sheltering income. Rental losses are passive: they offset passive income freely, and up to $25,000/yr can offset ordinary (W-2) income if you actively participate and your MAGI is under $100k (phasing out to $0 by $150k); unused losses carry forward. On sale, claimed depreciation is recaptured at up to 25%, and gains may owe capital-gains tax (a 1031 exchange can defer both). Figures are a year-1 estimate at your 24.0% rate — not tax advice; consult a CPA.
Schools (NCES district)
- District
- St. Tammany Parish
- NCES district ID
- 2201650
- Math proficiency
- 43% ▼ -32.00%
- Reading proficiency
- 55% ▼ -26.00%
- Median HH income
- $61,752
- Composite
- 43.04/100
- National rank
- #3098
- State rank
- #11 of 98 in LA
Livability — Covington
- Score
- 75/100
- State rank
- #17
- US rank
- #3876
Category grades
Schools grade is shown separately in the Schools card above.
Census & demographics
- County
- Saint Tammany Parish · 228,296 people
- City population
- 64,351
- Metro
- New Orleans-Metairie, LA
- Population (ZIP)
- 22,475
- Household income
- $80,926
- Rent vs Own
- Severe rent burden
- 296.0
Population outlook (St. Tammany County) Hauer SSP2
- Today (2025)
- 286,725 people
- By 2030
- 304,175 · +6.1%
- By 2040
- 336,203 · +17.3%
- By 2050
- 364,590 · +27.2%
- By 2075
- 433,362 · +51.1%
- By 2100
- 470,333 · +64.0%
Race, ethnicity, and origin ACS 2023
- Neighborhood character
- Predominantly White (84%)
- Race & ethnicity
- White 84% Black 9% Two or more races 4% Hispanic / Latino 3% Pacific Islander 2%
- Common ancestry
- Lithuanian 15% Serbian 1% Slovak 1%
- Foreign-born
- 2% · Canada
- Languages at home
- 97% English-only · Spanish 1% French/Haitian/Cajun 1%
Political lean MEDSL · St. Tammany
- 2024 margin
- Solid R (+43.8) · D 27.3% · R 71.1% · Other 1.6%
- 2008→2024 swing
- +9.6pp toward D · 2008: -53.4pp · 2024: -43.8pp
- All cycles
- 2024: R+43.8 2020: R+44.2 2016: R+50.8 2012: R+52.2 2008: R+53.4
Not yet ingested
- Civics
- —
Market trends
- HPI YoY
- ▼ -76.03%
- Current HPI
- 202.0458
- Rent YoY
- —
- Metro
- New Orleans-Metairie, LA
- State GDP YoY
- ▲ 3.29%
- F500 in state
- 10
Industry mix (Fortune 500 HQ in LA)
| Industry | F500 HQs | Revenue |
|---|---|---|
| Telecommunications | 2 | $23B |
|
||
| Utilities | 1 | $12B |
|
||
| Wholesale / Distribution | 1 | $5B |
|
||
| Advertising | 1 | $2B |
|
||
Price history
+674.6% since first listed19 events — show timeline
- 2026-06-15 Listed $275,000 GSREIN
- 2026-06-15 Listed $275,000 AcadianaMLS
- 2024-10-08 Price Changed $294,900 AcadianaMLS
- 2024-10-08 Price Changed $294,900 GSREIN
- 2024-08-16 Listed $300,000 AcadianaMLS
- 2016-07-28 Sold (Public Records) $209,500 Public Records
- 2016-07-18 Sold (MLS) $209,500 GSREIN
- 2016-06-15 Pending — GSREIN
- 2016-06-09 Contingent — GSREIN
- 2016-06-05 Price Changed $209,500 GSREIN
- 2016-05-04 Price Changed $212,000 GSREIN
- 2016-03-30 Listed $214,900 GSREIN
- 2016-03-29 Listed $209,500 AcadianaMLS
- 2014-06-23 Sold (Public Records) $174,900 Public Records
- 2013-08-09 Sold (MLS) $25,000 GSREIN
- 2013-06-10 Listed $30,000 AcadianaMLS
- 2013-06-10 Listed $30,000 GSREIN
- 2011-05-23 Sold (Public Records) $174,500 Public Records
- 2010-06-03 Sold (Public Records) $35,500 Public Records
Property tax history
-5.3%/yrLatest (2025): $1,532 · -3.4% YoY. Source: county tax records.
Cash-flow waterfall
monthlySold comps — $/sqft
last 12 mo · ≤1 miLoading sold comps…