5504 Jib Ln · Morgan's Point Resort, TX
Flood risk 1/10 · Minimal
- FEMA flood zone
- X (unshaded)
- Chance of flooding over 30 yrs
- 0.0%
- Est. flood insurance / yr
- $507 – $1,088
Fire risk 4/10 · Minor
- Est. fire insurance / yr
- $1,222 – $2,270
Heat risk 7/10 · Major
- Hot days now (above 107°F)
- 7 days/yr
- Hot days in 30 yrs
- 24 days/yr
Wind risk 6/10 · Moderate
- Chance of severe wind over 30 yrs
- 70.0%
Air-quality risk 2/10 · Minimal
- Unhealthy air days now
- 0 days/yr
- Unhealthy air days in 30 yrs
- 1 days/yr
Risk factors via First Street. Map © Google.
Why this score? — see what drove the C grade
The composite is a weighted blend of 9 inputs, each scored 0–100. Each bar is that input's sub-score; the figure is the points it added to the 100-point composite (weight × sub-score).
- Cash flow +29.1/30.0
- DSCR +10.0/10.0
- 1% rule +7.1/10.0
- Schools +3.8/10.0
- Livability +2.5/5.0
- Condition / age +2.5/5.0
- Rent growth +2.3/5.0
- ARV discount +0.0/15.0
- Appreciation +0.0/10.0
$149,900
🖨 Deal sheet (PDF) 📄 Offer letter ✓ Due diligence
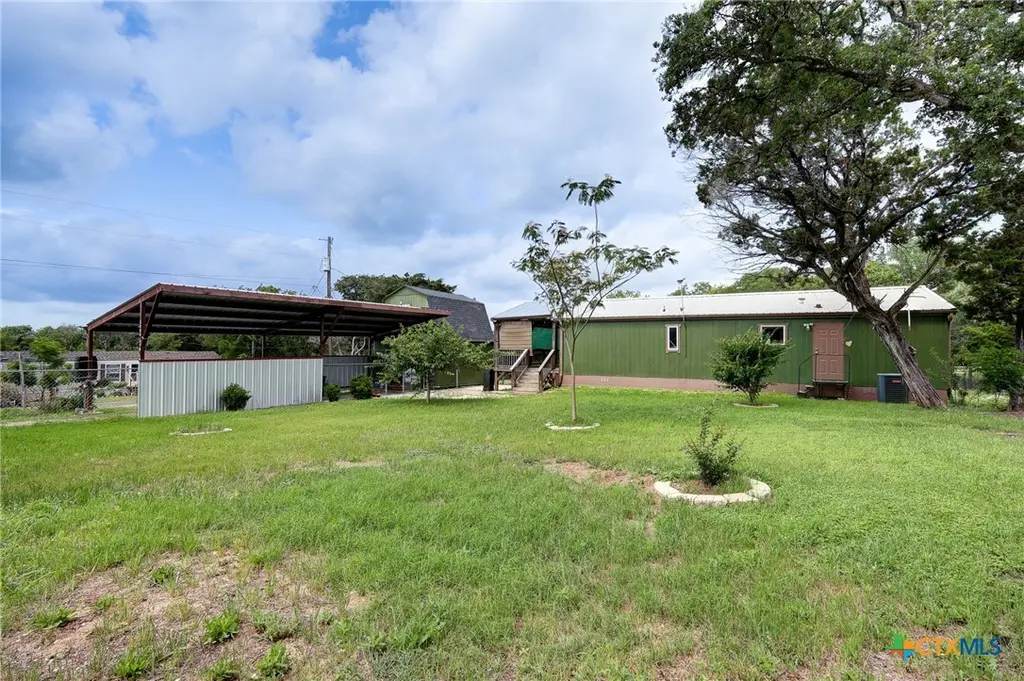
Listing remarks
Premium Hobbyist Workshop That Comes With a Move-In Ready Home Check out this unique property offering comfort, functionality, and space for work, storage, or hobbies, all located in the highly sought-after Lake Belton High School district. This home is considered real property and will go FHA or VA financing as the foundation is fixed to land. Situated on a fully fenced corner lot with 2 separate entrances, this 2018 manufactured home features 2 bedrooms, 2 full bathrooms, vaulted ceilings, and an open-concept kitchen and living area that creates a spacious and inviting feel. A custom covered wood deck entrance adds charm and a warm welcome to the home. Insulated metal roof adds to more d
Key facts
- No city taxes
- Insulated metal roof
- 0.23 acre lot
Tags
Property features AI
Finance
- HOA & community: Homeowners association (Lakeaire); Community features: boat facilities, playground, park, storage facilities
Exterior
- Parking: Carport (2 spaces); Oversized parking; Tandem parking; RV access/parking
- Utilities: Electricity available; High-speed internet available; Cable available; Trash collection (private); Community/Coop water; Public sewer and/or septic tank (not connected at lot)
- Home design: Single-story; Double wide mobile home; Pillar/post/pier foundation; Metal roof; HardiPlank exterior
- Construction: Built (year per assessor); HardiPlank-type siding; Metal roof; Pillar/post/pier foundation
- Exterior features: Covered patio; Covered deck; Porch; Patio; Storage; Outbuilding / workshop; Chain link fencing; Corner lot; Outside city limits; Less than quarter acre lot; Asphalt road access; Community pool
Interior
- Kitchen: Dishwasher; Electric range / stove; Microwave; Refrigerator; Plumbed for ice maker
- Flooring: Carpet; Linoleum
- Bathrooms: Two full bathrooms
- Heating & cooling: Central heating (electric); Central air conditioning (electric, one unit)
- Interior features: Ceiling fans; Vaulted ceilings; Walk-in closets; Tub with shower; Breakfast bar
- Laundry & utility: Laundry room / utility room; Washer hookup; Electric dryer hookup
Neighborhood map
What this means for you Summary
Snapshot
- This is a 2-bed/2.0-bath manufactured listed at $150k.
Deal economics
- At list price, monthly cash flow is $515 ($6k/yr) — positive.
- The deal already cash-flows at list — no discount required.
- Meets the 1% rule at list price ($2k rent vs $150k).
- Recommended offer: $148k (1.5% below list) — sets the bar for market timing.
- Cap rate 10.4% vs local median 2.5% in Morgan's Point Resort — top-decile yield for the area; either an underpriced asset or a hidden risk that comps aren't pricing in. Stress-test before assuming the spread holds.
Location & tenants
- Location reads: area grade C — affects rentability + tenant quality, not the cash-flow math above.
- Belton ISD (suburban): math 39% / reading 46% proficiency, ranked #285 of 826 in TX (top 34%) — families likely to look elsewhere, expect single-tenant / working-renter base with shorter leases.
- Market conditions: Rents soft (-0.8%/yr); 1114 active listings in the ZIP; 2 comparable units currently listed for rent nearby; solid renter incomes; 3,222 units permitted in Bell County in 2024 (246 in 5+ unit buildings).
Forward outlook
- Local home prices are declining (-3.0%/yr); year-one equity from $1k of loan paydown is wiped out by about $4k of value loss. Plan a longer hold.
- Bell County population projected at +21% by 2050 — long-run rental-demand tailwind backs the buy-and-hold thesis.
Negotiation context
- It's been on market 27 days — a 2% lower offer ($148k) is reasonable based on typical stale-listing flexibility.
- 5 sale attempts since 12y ago; this cycle's ask has dropped $20k (12%) from the opening price — seller is motivated, your offer sets the floor, not the list.
Risks & watch-outs
- Climate carrying-cost: major wind risk, 70% chance of damaging wind over 30y; extreme-heat days projected 7→24/yr by 2055 (HVAC capex compounding) — expect insurance premiums to compound above CPI over the hold.
Questions for the listing agent
- Is there a deadline driving the sale (1031 exchange, divorce, estate, relocation)? That informs how much negotiation room exists.
- What's the average days-on-market for RENTAL listings here right now (not sales)? A rising rental-DOM trend means longer vacancies and softer asking-rent achievability than the comps imply.
- What's the recent tenant-quality profile in this submarket — average credit score on applications, eviction rate, late-payment / NSF rate, and stable-employment percentage? A property-management company in the area should have these aggregated.
- How much new for-sale + rental construction is in the pipeline within 1–3 miles? Heavy new supply typically softens prices + rents 12–24 months out; constrained supply supports both.
Investment metrics
- 1% rule
- 1.21% ✓
- Cap rate
- 10.42%
- Cash-on-cash
- 14.73%
- DSCR
- 1.66
- GRM
- 6.9
CMA / ARV
- ARV (on-the-fly)
- $127,776
- Comps found
- 2
Show comp detail 2 sales within ~0.75 mi
| Address | Dist | Beds/Ba | Sqft | Sold | Price | $/sf | Match |
|---|---|---|---|---|---|---|---|
| 5588 Helm Ln | 0.31mi | 3/2.0 (+1) | 1,056 (0%) | 4mo | $73,500 | $70 | 77 |
| 5504 Helm Ln | 0.04mi | 2/2.0 | 952 (-10%) | 15mo | $115,000 | $121 | 69 |
Match score weights: distance 35% · size 25% · config 20% · recency 20%. Top-matched comps best support the ARV.
Projected returns pro-forma
-3.0% appreciation · 0.0% rent growth · sell at horizon
- IRR
- 2.0%
- Equity multiple
- 1.08×
- Total profit
- $3,157
- Equity at exit
- $22,351
- IRR
- 8.7%
- Equity multiple
- 1.58×
- Total profit
- $24,235
- Equity at exit
- $12,961
Cash invested: $41,972 (down + closing). Projections, not guarantees.
Landlord ↔ Tenant lean methodology
- Overall (STATE)
- 87 Strongly Landlord-Friendly
- State Texas
- 87 Strongly Landlord-Friendly · R+5
- County
- — inherits STATE
- City
- — inherits STATE
ZIP-level market 76502
- Rents YoY
- -0.8%
- Active inventory
- 1114
- Price-to-rent
- 6.9×
Monthly cashflow live
- Estimated rent
- $1,819 medium interval (Pro) →
- Mortgage (P&I)
- −$786
- Tax from tax record
- −$73 /mo · $880/yr
- Insurance
- −$62
- HOA
- −$0
- Vacancy / Maint / Mgmt
- −$382
- Net cashflow
- $515
Break-even live
Sensitivity live
| Price | -10% $600 | -5% $558 | +0% $515 | +5% $473 | +10% $430 |
|---|---|---|---|---|---|
| Rent | -10% $372 | -5% $443 | +0% $515 | +5% $587 | +10% $659 |
| Rate | -1.0pp $591 | -0.5pp $553 | base $515 | +0.5pp $476 | +1.0pp $437 |
UW: 25.0% down · 7.5% · 30yr · 1.5% tax · 5.0% vac · 8.0% maint · 8.0% mgmt
Financing live
Cash to close
- Down payment
- $37,475
- Closing costs
- $4,497
- Reserves months
- —
- Total cash needed
- —
Loan-product check · same deal, 3 products live
Conventional
25% down · 7.5% · 30yr
- Down + closing
- —
- Monthly P&I
- —
- Monthly cashflow
- —
- DSCR
- —
- Eligible?
- —
Personal DTI + credit; lowest rate.
DSCR
20% down · 8.5% · 30yr
- Down + closing
- —
- Monthly P&I
- —
- Monthly cashflow
- —
- DSCR
- —
- Eligible?
- —
No personal income docs; deal must DSCR.
Hard money
10% down · 12.0% · 12mo
- Down + closing
- —
- Monthly P&I
- —
- Monthly cashflow
- —
- DSCR
- —
- Eligible?
- —
Short-term bridge; refi at stabilization.
Rent comps 2 comps
| Address | Beds | Baths | Sqft | Rent | $/sqft | DOM | Units | Dist |
|---|---|---|---|---|---|---|---|---|
| 13550 Kuykendall Mountain Rd Temple, TX | 3.0 | 2.0 | 1008 | $2,800 | $2.78 | 44d | 1 | 0.72mi |
| 14572 Kuykendall Mountain Rd Temple, TX | 2.0 | 2.0 | 1114 | $1,200 | $1.08 | 44d | 1 | 0.83mi |
Listing history 36 events
-
2026-06-18days on market $149,900 Active 27 DOM
-
2026-06-17days on market $149,900 Active 26 DOM
-
2026-06-16days on market $149,900 Active 25 DOM
-
2026-06-15days on market $149,900 Active 24 DOM
-
2026-06-14days on market $149,900 Active 22 DOM
-
2026-06-13days on market $149,900 Active 21 DOM
-
2026-06-10pricedays on market $149,900 Active 19 DOM
-
2026-06-09days on market $159,900 Active 18 DOM
-
2026-06-08days on market $159,900 Active 17 DOM
-
2026-06-07pricedays on market $159,900 Active 16 DOM
-
2026-06-05days on market $165,500 Active 13 DOM
-
2026-06-03days on market $165,500 Active 12 DOM
-
2026-06-03price $165,500 Active 11 DOM
-
2026-06-02days on market $165,000 Active 11 DOM
-
2026-06-01days on market $165,000 Active 10 DOM
-
2026-05-31days on market $165,000 Active 9 DOM
-
2026-05-30days on market $165,000 Active 8 DOM
-
2026-05-22$170,000 Active
-
2026-04-20historical
-
2026-04-19price $174,999
-
2026-04-09price $178,288
-
2026-04-06price $178,900
-
2026-04-01price $179,488
-
2026-03-25status Active
-
2026-03-25price $179,900
-
2026-03-21historical
-
2026-03-20price $219,900
-
2026-01-29price $199,900
-
2025-12-17price $225,900
-
2025-11-11$249,900 Active
-
2025-09-24soldstatus
-
2018-02-22historical
-
2018-01-11status Pending with Option
-
2017-09-15$7,000 Active
-
2014-07-24$4,350
-
1984-06-05soldstatus
ⓘ Source: listings_history table (triggers on properties + properties_extension) + one-shot
backfill from property_details.listing_events for pre-trigger history.
Tax reassessment forecast TX · Resets to sale price
- Current annual tax
- $880 · $73/mo
- Projected year-2 tax
- $2,743 · $229/mo
- Expected delta
- +$1,864/yr (+$155/mo · 211.8%)
ⓘ Screening estimate from a state-policy table — verify with the county assessor before closing.
Climate risk First Street
- Flood 1/10 Low FEMA zone X (unshaded) · 0% chance over 30 yrs
- Wildfire 4/10 Moderate
- Heat 7/10 Severe 7 d/yr ≥107°F today · 24 d/yr by 30 yrs out
- Wind 6/10 Major 70% chance of damaging wind over 30 yrs
- Air quality 2/10 Low 0 unhealthy d/yr today · 1 by 30 yrs out
Nearby sold comps map
Loading sold comps map…
Walkable amenities ~0.75 mi
Loading nearby amenities…
Taxation est. · year 1
- Rental income
- $21,831
- − Mortgage interest
- −$8,397
- − Property taxes
- −$880
- − Insurance
- −$750
- − Repairs & maintenance
- −$1,746
- − Management
- −$1,746
- − Depreciation
- −$4,361
- Taxable income
- $3,951
- Est. tax owed @ 24.0%
- −$948
- After-tax cash flow
- $5,236/yr
For passive investors: Depreciation is non-cash, so a rental often shows a tax loss while cash-flowing — sheltering income. Rental losses are passive: they offset passive income freely, and up to $25,000/yr can offset ordinary (W-2) income if you actively participate and your MAGI is under $100k (phasing out to $0 by $150k); unused losses carry forward. On sale, claimed depreciation is recaptured at up to 25%, and gains may owe capital-gains tax (a 1031 exchange can defer both). Figures are a year-1 estimate at your 24.0% rate — not tax advice; consult a CPA.
Schools (NCES district)
- District
- Belton ISD
- NCES district ID
- 4809860
- Math proficiency
- 39% ▼ -14.00%
- Reading proficiency
- 46% ▼ -4.00%
- Median HH income
- $61,239
- Composite
- 37.62/100
- National rank
- #4378
- State rank
- #285 of 826 in TX
Livability — Morgan's Point Resort
No livability data for this city. (Only ~50 U.S. cities are tracked.)
Census & demographics
- County
- Bell County · 345,090 people
- Metro
- Killeen-Temple, TX
- Population (ZIP)
- 52,669
- Household income
- $82,088
- Rent vs Own
- Severe rent burden
- 1890.0
Population outlook (Bell County) Hauer SSP2
- Today (2025)
- 371,114 people
- By 2030
- 389,104 · +4.8%
- By 2040
- 420,592 · +13.3%
- By 2050
- 447,779 · +20.7%
- By 2075
- 499,130 · +34.5%
- By 2100
- 505,680 · +36.3%
Race, ethnicity, and origin ACS 2023
- Neighborhood character
- Diverse neighborhood (Simpson 0.59)
- Race & ethnicity
- White 58% Hispanic / Latino 26% Two or more races 15% Black 9% Asian 3%
- Hispanic origin (detail)
- Mexican 21% Puerto Rican 2%
- Common ancestry
- Italian 2% Slovak 2% Serbian 1%
- Foreign-born
- 7% · Canada, South Korea, China
- Languages at home
- 86% English-only · Spanish 10% Other Indo-European 1% Korean 1%
Political lean MEDSL · Bell
- 2024 margin
- R (+16.2) · D 41.3% · R 57.6% · Other 1.1%
- 2008→2024 swing
- -6.5pp toward R · 2008: -9.8pp · 2024: -16.2pp
- All cycles
- 2024: R+16.2 2020: R+8.5 2016: R+15.1 2012: R+16.4 2008: R+9.8
Not yet ingested
- Civics
- —
Market trends
- HPI YoY
- ▼ -216.80%
- Current HPI
- 166.927
- Rent YoY
- ▼ -0.79%
- Metro
- Killeen-Temple, TX
- State GDP YoY
- ▲ 3.95%
- F500 in state
- 110
Industry mix (Fortune 500 HQ in TX)
| Industry | F500 HQs | Revenue |
|---|---|---|
| Energy | 16 | $1,198B |
|
||
| Technology | 5 | $198B |
|
||
| Engineering / Construction | 4 | $72B |
|
||
| Energy Services | 3 | $60B |
|
||
| Utilities | 3 | $41B |
|
||
| Healthcare | 2 | $330B |
|
||
Price history
+3808.0% since first listed19 events — show timeline
- 2026-05-22 Listed $170,000 CTXMLS
- 2026-04-20 Listing Removed — CTXMLS
- 2026-04-19 Price Changed $174,999 CTXMLS
- 2026-04-09 Price Changed $178,288 CTXMLS
- 2026-04-06 Price Changed $178,900 CTXMLS
- 2026-04-01 Price Changed $179,488 CTXMLS
- 2026-03-25 Relisted — CTXMLS
- 2026-03-25 Price Changed $179,900 CTXMLS
- 2026-03-21 Listing Removed — CTXMLS
- 2026-03-20 Price Changed $219,900 CTXMLS
- 2026-01-29 Price Changed $199,900 CTXMLS
- 2025-12-17 Price Changed $225,900 CTXMLS
- 2025-11-11 Listed $249,900 CTXMLS
- 2025-09-24 Sold (Public Records) — Public Records
- 2018-02-22 Listing Removed — CTXMLS
- 2018-01-11 Pending — CTXMLS
- 2017-09-15 Listed $7,000 CTXMLS
- 2014-07-24 Listed $4,350 CTXMLS
- 1984-06-05 Sold (Public Records) — Public Records
Property tax history
+23.4%/yrLatest (2025): $880 · +2.1% YoY. Source: county tax records.
Cash-flow waterfall
monthlySold comps — $/sqft
last 12 mo · ≤1 miLoading sold comps…