 Multi-family
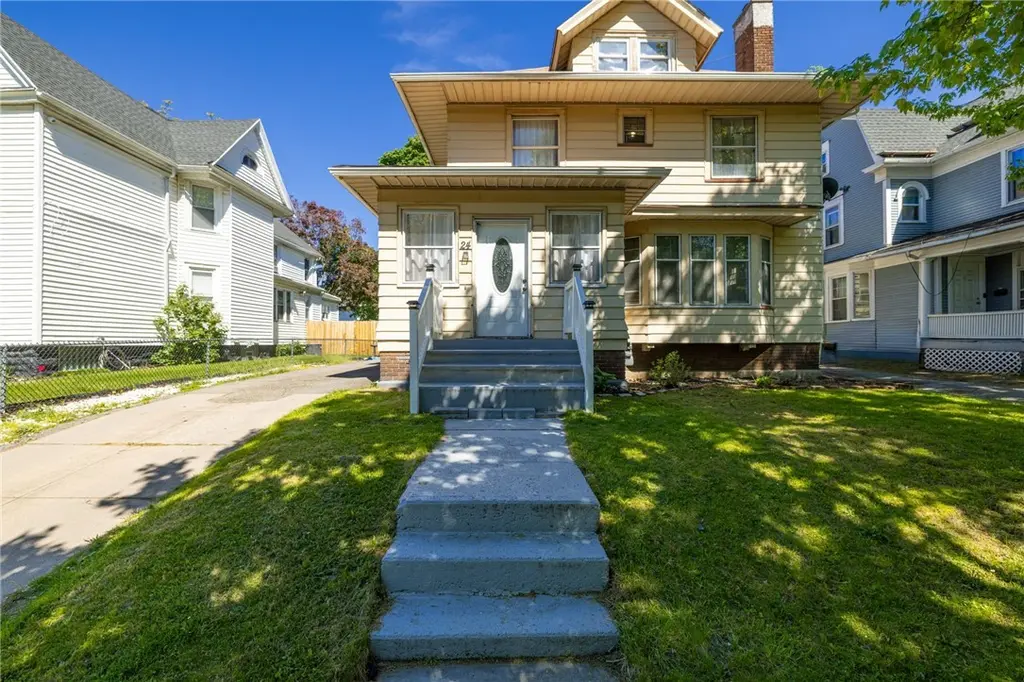
24 Kenwood Ave · Rochester, NY
Flood risk 1/10 · Minimal
- FEMA flood zone
- X (unshaded)
- Chance of flooding over 30 yrs
- 0.0%
- Est. flood insurance / yr
- $507 – $1,088
Fire risk 1/10 · Minimal
- Est. fire insurance / yr
- $691 – $1,283
Heat risk 2/10 · Minimal
- Hot days now (above 96°F)
- 7 days/yr
- Hot days in 30 yrs
- 15 days/yr
Wind risk 1/10 · Minimal
- Chance of severe wind over 30 yrs
- —
Air-quality risk 2/10 · Minimal
- Unhealthy air days now
- 1 days/yr
- Unhealthy air days in 30 yrs
- 1 days/yr
Risk factors via First Street. Map © Google.
Why this score? — see what drove the B- grade
The composite is a weighted blend of 9 inputs, each scored 0–100. Each bar is that input's sub-score; the figure is the points it added to the 100-point composite (weight × sub-score).
- Cash flow +30.0/30.0
- 1% rule +10.0/10.0
- DSCR +10.0/10.0
- Rent growth +4.1/5.0
- Livability +3.8/5.0
- Appreciation +3.5/10.0
- Condition / age +2.5/5.0
- Schools +1.9/10.0
- ARV discount +0.0/15.0
$124,900
🖨 Deal sheet 📄 Offer letter ✓ Due diligence
Multi-family units
County records classify this as Multi-Family (2-4 Unit). Listing-text estimate: 1 unit. estimate disagrees with records
Listing remarks MLS
WOW! 19th Ward Gem!! Walking distance from the University of Rochester, Strong Hospital and Brooks Landing! Investors dream with all separate utilities, 100% occupancy with positive CASH FLOW! Newer roof, hot water tank and furnace.
Key facts
- Separate furnaces
- 6,534 sq ft lot
- 2 garage spots
Tags
Property features AI
Finance
- Other: Owner pays all utilities / rent includes all utilities
- Financial info: Two separate electric meters; Two separate gas meters; Two total units; Gross income reported as $12,000; Operating expenses reported as $8,000 (includes electric, fuel, maintenance, utilities and other items noted)
Exterior
- Parking: Detached or attached garage with 2 spaces; Gravel and paved parking available; Multiple parking spaces
- Utilities: Public water connected; Sewer connected; Cable available; High-speed internet available; Circuit breaker electric system
- Home design: Two-story multiunit building; Resale property; Residential 2-unit zoning
- Construction: Built with aluminum siding, brick and frame construction; Copper plumbing; Asphalt roof; Existing (previously built)
- Exterior features: Rectangular residential lot; City street frontage
Interior
- Kitchen: Gas water heater
- Flooring: Carpet; Hardwood; Linoleum; Tile; Vinyl; Varied flooring
- Bathrooms: Two full bathrooms
- Heating & cooling: Gas forced-air heating
- Interior features: Storm windows with wood frames; Full basement
Neighborhood map
What this means for you Summary
Snapshot
- This is a 4-bed/2.0-bath multifamily listed at $125k.
Deal economics
- At list price, monthly cash flow is $2k ($19k/yr) — positive.
- The deal already cash-flows at list — no discount required.
- Meets the 1% rule at list price ($3k rent vs $125k).
- Cap rate 21.6% vs local median 9.3% in Rochester — top-decile yield for the area; either an underpriced asset or a hidden risk that comps aren't pricing in. Stress-test before assuming the spread holds.
Location & tenants
- Location reads 76/100 on livability (#222 in NY, #3,482 nationally) — a middle-class / working-renter tenant base. Strengths: commute A+, cost of living A+, housing A+; Watch: schools D+, crime F, employment F.
- Rochester City School District (urban): math 21% / reading 26% proficiency, ranked #589 of 590 in NY (top 100%) — low school quality limits family demand, transient renter base, plan for 1-2y turnover; 82% free/reduced lunch — lower-income household profile, screen leases tightly.
- Market conditions: Rents rising fast (+6.4%/yr); 78 active listings in the ZIP; 11 comparable units currently listed for rent nearby; rentals at typical pace (median 15d on market — plan ~3-4 weeks tenant-placement turnaround); lower-income renter base — watch delinquency; 1,169 units permitted in Monroe County in 2024 (591 in 5+ unit buildings).
- At $3,067/mo this rent would consume 117% of the median local household income ($31k/yr) (locally 2168% of renters already pay >50% of income on rent) — very limited rent-growth headroom before tenants either downsize or default.
Forward outlook
- Local home prices are declining (-2.9%/yr); year-one equity from $864 of loan paydown is wiped out by about $4k of value loss. Plan a longer hold.
- Monroe County population projected to shrink 6% by 2050 — rents likely to lag national; underwrite the cash flow, not the appreciation.
- At projected returns (-2.9% appreciation + 6.4% rent growth), your $35k cash investment doubles in ~3 years — after that, you're playing with house money.
Negotiation context
- Only 8 days on market — expect competitive offers; lowballing is unlikely to land.
- 6 sale attempts since 13y ago with the ask held roughly flat each time — persistent listings suggest the price (not the market) is what's stuck; bring a comps-based counter.
- Current owner paid $59k; list at $125k implies a 112% gain — meaningful room to come down on a strong offer.
Risks & watch-outs
- Watch-outs: built in 1919 — expect roof / HVAC / electrical / plumbing capex.
Questions for the listing agent
- Built in 1919 — when were the roof, HVAC, electrical panel, plumbing, and water heater last replaced?
- Is there a deadline driving the sale (1031 exchange, divorce, estate, relocation)? That informs how much negotiation room exists.
- Schools are D-rated, which usually means shorter tenancies and higher turnover. Who's the typical renter profile here, and what's been the actual vacancy rate?
- Crime grade is F in this area — have there been break-ins, vandalism, or insurance claims at this property in the last 3 years? What carrier currently insures it and at what premium?
- What's the average days-on-market for RENTAL listings here right now (not sales)? A rising rental-DOM trend means longer vacancies and softer asking-rent achievability than the comps imply.
- What's the recent tenant-quality profile in this submarket — average credit score on applications, eviction rate, late-payment / NSF rate, and stable-employment percentage? A property-management company in the area should have these aggregated.
- How much new apartment / multifamily construction is in the pipeline within 1–3 miles? Heavy new supply (>2% of stock underway) typically softens rents 12–24 months out; light construction supports rent growth.
Investment metrics
- 1% rule
- 2.46% ✓
- Cap rate
- 21.63%
- Cash-on-cash
- 54.76%
- DSCR
- 3.44
- GRM
- 3.4
CMA / ARV
- ARV (on-the-fly)
- $104,468
- Comps found
- 12
Show comp detail 12 sales within ~0.75 mi
| Address | Dist | Beds/Ba | Sqft | Sold | Price | $/sf | Match |
|---|---|---|---|---|---|---|---|
| 30 Woodbine Ave | 0.35mi | 3/2.0 (-1) | 2,000 (-0%) | 8mo | $140,000 | $70 | 72 |
| 22 Gardiner Ave | 0.59mi | 4/2.0 | 2,096 (+4%) | 4mo | $100,000 | $48 | 62 |
| 131 York St | 0.30mi | 5/3.0 (+1) | 2,246 (+12%) | 0mo | $156,000 | $69 | 57 |
| 177 Clifton St | 0.21mi | 5/3.0 (+1) | 1,768 (-12%) | 6mo | $75,000 | $42 | 56 |
| 367 Troup St | 0.44mi | 3/3.0 (-1) | 2,000 (-0%) | 17mo | $55,000 | $28 | 55 |
| 286 Kenwood Ave | 0.37mi | 5/2.0 (+1) | 2,202 (+10%) | 10mo | $160,000 | $73 | 54 |
| 127-129 Thorndale Ter | 0.39mi | 5/2.0 (+1) | 2,147 (+7%) | 17mo | $161,000 | $75 | 51 |
| 149 Warwick Ave | 0.29mi | 5/3.0 (+1) | 2,293 (+14%) | 7mo | $110,000 | $48 | 48 |
| 119-121 Thurston Rd | 0.73mi | 4/2.0 | 1,824 (-9%) | 7mo | $185,000 | $101 | 44 |
| 554 Campbell St | 0.65mi | 5/2.0 (+1) | 2,256 (+12%) | 1mo | $118,000 | $52 | 43 |
| 271 Champlain St | 0.65mi | 4/2.0 | 1,784 (-11%) | 15mo | $90,000 | $50 | 38 |
| 101 Jefferson Ave | 0.60mi | 5/2.0 (+1) | 2,258 (+12%) | 18mo | $85,000 | $38 | 31 |
Match score weights: distance 35% · size 25% · config 20% · recency 20%. Top-matched comps best support the ARV.
Projected returns pro-forma
-2.93% appreciation · 6.37% rent growth · sell at horizon
- IRR
- 56.8%
- Equity multiple
- 3.65×
- Total profit
- $92,535
- Equity at exit
- $19,005
- IRR
- 62.9%
- Equity multiple
- 8.41×
- Total profit
- $259,142
- Equity at exit
- $11,456
Cash invested: $34,972 (down + closing). Projections, not guarantees.
Landlord ↔ Tenant lean methodology
- Overall (STATE)
- 15 Strongly Tenant-Friendly
- State New York
- 15 Strongly Tenant-Friendly · D+10
- County
- — inherits STATE
- City
- — inherits STATE
ZIP-level market 14611
- Home prices YoY
- -1.1%
- Rents YoY
- 6.4%
- Active inventory
- 78
- Price-to-rent
- 6.8×
Monthly cashflow live
- Estimated rent
- $3,067 high interval (Pro) →
- Mortgage (P&I)
- −$655
- Tax from tax record
- −$120 /mo · $1,441/yr
- Insurance
- −$52
- HOA
- −$0
- Vacancy / Maint / Mgmt
- −$644
- Net cashflow
- $1,596
Break-even live
2-unit breakdown (identical units grouped — click to expand)
| Units | Beds | Baths | Est. rent |
|---|---|---|---|
| 2× units | 2 | 1 | $3,068 |
| #1 | 2 | 1 | $1,534 |
| #2 | 2 | 1 | $1,534 |
| Total (2 units) | $3,067 | ||
UW: 25.0% down · 7.5% · 30yr · 1.5% tax · 5.0% vac · 8.0% maint · 8.0% mgmt
Financing live
Cash to close
- Down payment
- $31,225
- Closing costs
- $3,747
- Reserves months
- —
- Total cash needed
- —
Loan-product check · same deal, 3 products live
Conventional
25% down · 7.5% · 30yr
- Down + closing
- —
- Monthly P&I
- —
- Monthly cashflow
- —
- DSCR
- —
- Eligible?
- —
Personal DTI + credit; lowest rate.
DSCR
20% down · 8.5% · 30yr
- Down + closing
- —
- Monthly P&I
- —
- Monthly cashflow
- —
- DSCR
- —
- Eligible?
- —
No personal income docs; deal must DSCR.
Hard money
10% down · 12.0% · 12mo
- Down + closing
- —
- Monthly P&I
- —
- Monthly cashflow
- —
- DSCR
- —
- Eligible?
- —
Short-term bridge; refi at stabilization.
Rent comps 11 comps
| Address | Beds | Baths | Sqft | Rent | $/sqft | DOM | Units | Dist |
|---|---|---|---|---|---|---|---|---|
| 48 Thorndale Ter Rochester, NY | 4.0 | 1.5 | 1700 | $1,400 | $0.82 | 14d | 1 | 0.36mi |
| 478 Tremont St Rochester, NY | 3.0 | 2.0 | 1424 | $1,500 | $1.05 | 43d | 1 | 0.54mi |
| 161 Fillmore St Rochester, NY | 4.0 | 2.0 | 1612 | $1,400 | $0.87 | 14d | 1 | 0.59mi |
| 385 Ames St Rochester, NY | 3.0 | 1.5 | 1738 | $1,500 | $0.86 | 21d | 1 | 0.68mi |
| 649 Jay St Rochester, NY | 5.0 | 2.0 | 2144 | $2,000 | $0.93 | 3d | 1 | 0.71mi |
| 249 1/2 Columbia Ave #249 Rochester, NY | 3.0 | 1.0 | 1600 | $1,300 | $0.81 | 14d | 1 | 0.79mi |
| 485 Sawyer St Rochester, NY | 3.0 | 1.0 | 1400 | $1,900 | $1.36 | 2d | 1 | 1.04mi |
| 485 Sawyer St Unit 1 Rochester, NY | 3.0 | 1.0 | 1400 | $1,900 | $1.36 | 43d | 1 | 1.04mi |
| 79 Evangeline St Rochester, NY | 3.0 | 2.0 | 1876 | $2,500 | $1.33 | 2d | 1 | 1.20mi |
| 793 Woodbine Ave Rochester, NY | 4.0 | 1.0 | 1700 | $2,200 | $1.29 | 2d | 1 | 1.32mi |
| 102 Virginia Ave Rochester, NY | 4.0 | 1.5 | 1453 | $2,150 | $1.48 | 2d | 1 | 1.44mi |
Listing history 13 events
-
2026-06-05statusdays on market $124,900 Pending 8 DOM
-
2026-06-03days on market $124,900 Active 7 DOM
-
2026-06-03days on market $124,900 Active 6 DOM
-
2026-06-01days on market $124,900 Active 5 DOM
-
2026-05-31days on market $124,900 Active 4 DOM
-
2026-05-27$124,900 Active
-
2015-08-25soldstatus $59,000 Closed Sale or Rented 232-char remark
Show marketing remark (232 chars)
WOW! 19th Ward Gem!! Walking distance from the University of Rochester, Strong Hospital and Brooks Landing! Investors dream with all separate utilities, 100% occupancy with positive CASH FLOW! Newer roof, hot water tank and furnace.
-
2015-08-21soldstatus $59,000
-
2015-04-19$59,900 232-char remark
Show marketing remark (232 chars)
WOW! 19th Ward Gem!! Walking distance from the University of Rochester, Strong Hospital and Brooks Landing! Investors dream with all separate utilities, 100% occupancy with positive CASH FLOW! Newer roof, hot water tank and furnace.
-
2014-09-27$59,900
-
2014-08-01$55,900
-
2013-09-21$59,500
-
2013-04-10$64,500
ⓘ Source: listings_history table (triggers on properties + properties_extension) + one-shot
backfill from property_details.listing_events for pre-trigger history.
Tax reassessment forecast NY · Partial reset (capped growth)
- Current annual tax
- $1,441 · $120/mo
- Projected year-2 tax
- $1,776 · $148/mo
- Expected delta
- +$335/yr (+$28/mo · 23.3%)
ⓘ Screening estimate from a state-policy table — verify with the county assessor before closing.
Climate risk First Street
- Flood 1/10 Low FEMA zone X (unshaded) · 0% chance over 30 yrs
- Wildfire 1/10 Low
- Heat 2/10 Low 7 d/yr ≥96°F today · 15 d/yr by 30 yrs out
- Wind 1/10 Low
- Air quality 2/10 Low 1 unhealthy d/yr today · 1 by 30 yrs out
Nearby sold comps map
Loading sold comps map…
Walkable amenities ~0.75 mi
Loading nearby amenities…
Taxation est. · year 1
- Rental income
- $36,804
- − Mortgage interest
- −$6,996
- − Property taxes
- −$1,441
- − Insurance
- −$624
- − Repairs & maintenance
- −$2,944
- − Management
- −$2,944
- − Depreciation
- −$3,633
- Taxable income
- $18,220
- Est. tax owed @ 24.0%
- −$4,373
- After-tax cash flow
- $14,777/yr
For passive investors: Depreciation is non-cash, so a rental often shows a tax loss while cash-flowing — sheltering income. Rental losses are passive: they offset passive income freely, and up to $25,000/yr can offset ordinary (W-2) income if you actively participate and your MAGI is under $100k (phasing out to $0 by $150k); unused losses carry forward. On sale, claimed depreciation is recaptured at up to 25%, and gains may owe capital-gains tax (a 1031 exchange can defer both). Figures are a year-1 estimate at your 24.0% rate — not tax advice; consult a CPA.
Schools (NCES district)
- District
- Rochester City School District
- NCES district ID
- 3624750
- Math proficiency
- 21% ▬ 0.00%
- Reading proficiency
- 26% ▲ 4.00%
- Median HH income
- $30,923
- Composite
- 18.98/100
- National rank
- #8850
- State rank
- #589 of 590 in NY
Livability — Rochester
- Score
- 76/100
- State rank
- #222
- US rank
- #3482
Category grades
Schools grade is shown separately in the Schools card above.
Census & demographics
- Census place
- Rochester, NY
- County
- Monroe County · 674,131 people
- City population
- 432,803
- Metro
- Rochester, NY
- Population (ZIP)
- 17,145
- Household income
- $31,376
- Rent vs Own
- Severe rent burden
- 2168.0
Population outlook (Monroe County) Hauer SSP2
- Today (2025)
- 759,460 people
- By 2030
- 757,154 · -0.3%
- By 2040
- 740,644 · -2.5%
- By 2050
- 714,443 · -5.9%
- By 2075
- 645,883 · -15.0%
- By 2100
- 547,084 · -28.0%
Race, ethnicity, and origin ACS 2023
- Neighborhood character
- Diverse neighborhood (Simpson 0.61)
- Race & ethnicity
- Black 55% White 22% Hispanic / Latino 18% Two or more races 13% Asian 1%
- Hispanic origin (detail)
- Puerto Rican 14% Dominican 2%
- Common ancestry
- Romanian 1% Lithuanian 1% Slovak 1%
- Foreign-born
- 3% · Canada
- Languages at home
- 85% English-only · Spanish 12% French/Haitian/Cajun 1% Other Indo-European 1%
Political lean MEDSL · Monroe
- 2024 margin
- D (+19.1) · D 59.5% · R 40.5%
- 2008→2024 swing
- +1.4pp toward D · 2008: 17.7pp · 2024: 19.1pp
- All cycles
- 2024: D+19.1 2020: D+21.0 2016: D+14.1 2012: D+17.4 2008: D+17.7
Not yet ingested
- Civics
- —
Market trends
- HPI YoY
- ▼ -2.93%
- Current HPI
- 262.1549
- Rent YoY
- ▲ 6.37%
- Metro
- Rochester, NY
- State GDP YoY
- ▲ 2.60%
- F500 in state
- 92
Industry mix (Fortune 500 HQ in NY)
| Industry | F500 HQs | Revenue |
|---|---|---|
| Financial Services | 10 | $950B |
|
||
| Consumer Goods | 9 | $162B |
|
||
| Insurance | 4 | $225B |
|
||
| Telecommunications | 2 | $144B |
|
||
| Pharmaceuticals | 2 | $112B |
|
||
| Media / Entertainment | 2 | $69B |
|
||
Price history
+93.6% since first listed8 events — show timeline
- 2026-05-27 Listed $124,900 UNYREIS
- 2015-08-25 Sold (MLS) $59,000 UNYREIS
- 2015-08-21 Sold (Public Records) $59,000 Public Records
- 2015-04-19 Listed $59,900 UNYREIS
- 2014-09-27 Listed $59,900 UNYREIS
- 2014-08-01 Listed $55,900 UNYREIS
- 2013-09-21 Listed $59,500 UNYREIS
- 2013-04-10 Listed $64,500 UNYREIS
Property tax history
+5.4%/yrLatest (2025): $1,441 · +0.0% YoY. Source: county tax records.
Cash-flow waterfall
monthlySold comps — $/sqft
last 12 mo · ≤1 miLoading sold comps…