 🏗️ New Construction
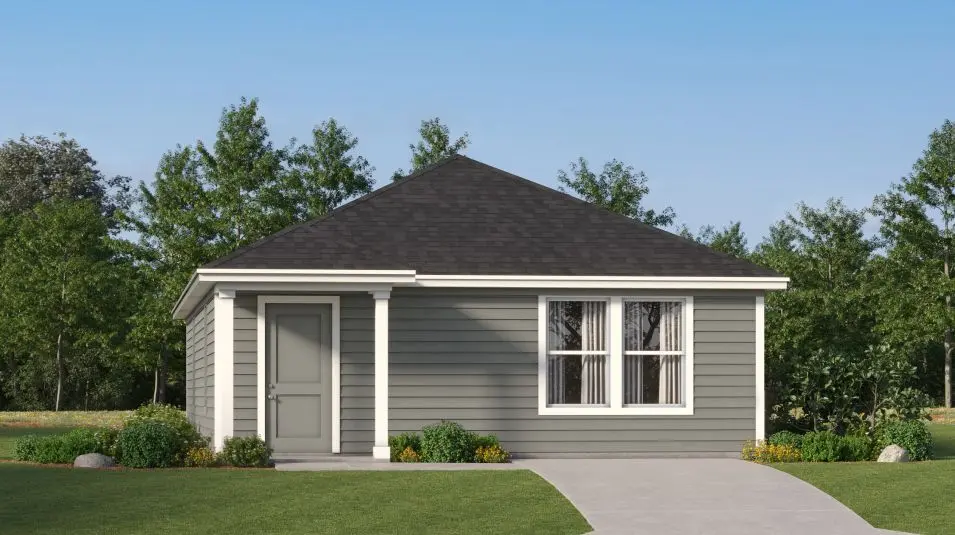
Chappell Plan · San Antonio, TX
Flood risk 1/10 · Minimal
- FEMA flood zone
- X (unshaded)
- Chance of flooding over 30 yrs
- 0.0%
- Est. flood insurance / yr
- $507 – $1,088
Fire risk 5/10 · Moderate
- Est. fire insurance / yr
- $1,222 – $2,270
Heat risk 8/10 · Major
- Hot days now (above 109°F)
- 7 days/yr
- Hot days in 30 yrs
- 23 days/yr
Wind risk 8/10 · Major
- Chance of severe wind over 30 yrs
- 80.0%
Air-quality risk 2/10 · Minimal
- Unhealthy air days now
- 0 days/yr
- Unhealthy air days in 30 yrs
- 1 days/yr
Risk factors via First Street. Map © Google.
Why this score? — see what drove the F grade
The composite is a weighted blend of 9 inputs, each scored 0–100. Each bar is that input's sub-score; the figure is the points it added to the 100-point composite (weight × sub-score).
- ARV discount +7.5/15.0
- Cash flow +7.3/30.0
- Appreciation +6.0/10.0
- Livability +4.0/5.0
- 1% rule +2.1/10.0
- Schools +1.8/10.0
- DSCR +1.5/10.0
- Condition / age +1.0/5.0
- Rent growth +0.7/5.0
$181,999
🖨 Deal sheet (PDF) 📄 Offer letter ✓ Due diligence
Listing remarks MLS
This single-level home opens into a shared living space between the kitchen, dining area and family room for easy entertaining. An owner's suite enjoys a private location in a rear corner of the home, complemented by an en-suite bathroom and walk-in closet. There are two secondary bedrooms at the front of the home, which are comfortable spaces for household members and overnight guests.
Key facts
- Listed 617 days
Neighborhood map
What this means for you Summary
Snapshot
- This is a 3-bed/2.0-bath single-family listed at $182k. Condition is rated poor.
Deal economics
- At list price, monthly cash flow is $-298 ($-4k/yr) — negative.
- To cash-flow at today's rent, offer at most $181k (0.4% below list).
- To meet the 1% rule (rent ≥ 1% of price), the offer needs to be $159k (12.9% below list).
- Recommended offer: $159k (12.9% below list) — sets the bar for 1% rule.
- Cap rate 4.7% vs local median 3.8% in San Antonio — meaningfully above typical; check what's discounted (condition, days-on-market, listing class) to confirm the premium yield is real.
Location & tenants
- Location reads 80/100 on livability (#31 in TX, #1,616 nationally) — a professional / high-income tenant draw. Strengths: amenities A+, commute A+, cost of living A+; Watch: schools C-, crime F.
- Southside ISD (rural): math 16% / reading 25% proficiency, ranked #771 of 826 in TX (top 93%) — low school quality limits family demand, transient renter base, plan for 1-2y turnover; 76% free/reduced lunch — lower-income household profile, screen leases tightly.
- Market conditions: Rents falling (-7.2%/yr); 369 active listings in the ZIP; 21 comparable units currently listed for rent nearby; rentals at typical pace (median 23d on market — plan ~3-4 weeks tenant-placement turnaround); 8,308 units permitted in Bexar County in 2024 (2,506 in 5+ unit buildings).
Forward outlook
- In year one you build about $6k of equity ($2k loan paydown + $5k appreciation (2.0% local appreciation)).
- Bexar County population projected at +50% by 2050 — long-run rental-demand tailwind backs the buy-and-hold thesis.
- By year 6, paydown + projected appreciation supports a ~$33k cash-out refi (75% LTV) — recoverable capital for the next deal without selling this one.
Negotiation context
- It's been on market 618 days — a 12% lower offer ($160k) is reasonable based on typical stale-listing flexibility.
- 3 sale attempts since 2y ago; this cycle's ask has dropped $33k (15%) from the opening price — seller is motivated, your offer sets the floor, not the list.
Risks & watch-outs
- Climate carrying-cost: severe wind risk, 80% chance of damaging wind over 30y; moderate wildfire risk; extreme-heat days projected 7→23/yr by 2055 (HVAC capex compounding) — expect insurance premiums to compound above CPI over the hold.
Questions for the listing agent
- What do current leases actually rent for vs. the listed asking? Can we see a recent rent roll and the last 12 months of T-12 income?
- It's been on market 618 days. Have you received any prior offers? Is the seller open to a 13% concession, seller financing, or rate buy-down credit?
- Have any recent inspections been done? Can we get a copy of the seller's disclosures and any deferred-maintenance estimates?
- Why hasn't it sold? Are there any deal-killer items the seller is aware of (foundation, flood, title, zoning, code violations)?
- Is there a deadline driving the sale (1031 exchange, divorce, estate, relocation)? That informs how much negotiation room exists.
- Crime grade is F in this area — have there been break-ins, vandalism, or insurance claims at this property in the last 3 years? What carrier currently insures it and at what premium?
- The area grade is low — what's the realistic commute time and amenity access for the typical tenant pool here? Any planned neighborhood developments (good or bad) we should know about?
- What's the average days-on-market for RENTAL listings here right now (not sales)? A rising rental-DOM trend means longer vacancies and softer asking-rent achievability than the comps imply.
- What's the recent tenant-quality profile in this submarket — average credit score on applications, eviction rate, late-payment / NSF rate, and stable-employment percentage? A property-management company in the area should have these aggregated.
- How much new for-sale + rental construction is in the pipeline within 1–3 miles? Heavy new supply typically softens prices + rents 12–24 months out; constrained supply supports both.
Investment metrics
- 1% rule
- 0.71% ✗
- Cap rate
- 4.70%
- Cash-on-cash
- -5.69%
- DSCR
- 0.75
- GRM
- 11.8
CMA / ARV
- ARV (median comp)
- $224,421
- List price
- $181,999
- Delta
- -18.90%
- Verdict
- UNDERPRICED
- Comps
- 20 within 1.0 mi
Show comp detail 12 sales within ~0.75 mi
| Address | Dist | Beds/Ba | Sqft | Sold | Price | $/sf | Match |
|---|---|---|---|---|---|---|---|
| 10647 Fannin Way | 0.64mi | 3/2.0 | 1,208 (+1%) | 3mo | $186,999 | $155 | 67 |
| 10627 Fannin Way | 0.66mi | 3/2.0 | 1,208 (+1%) | 2mo | $160,999 | $133 | 66 |
| 10663 Fannin Way | 0.61mi | 3/2.0 | 1,208 (+1%) | 5mo | $189,999 | $157 | 66 |
| 10640 Fannin Way | 0.67mi | 3/2.0 | 1,208 (+1%) | 2mo | $170,999 | $142 | 66 |
| 1926 Alcalde Cv | 0.70mi | 3/2.0 | 1,208 (+1%) | 1mo | $160,999 | $133 | 66 |
| 10607 Fannin Way | 0.68mi | 3/2.0 | 1,192 (-1%) | 2mo | $149,999 | $126 | 66 |
| 10643 Fannin Way | 0.65mi | 3/2.0 | 1,192 (-1%) | 4mo | $154,999 | $130 | 65 |
| 10652 Fannin Way | 0.66mi | 3/2.0 | 1,208 (+1%) | 5mo | $187,999 | $156 | 64 |
| 1938 Alcalde Cv | 0.71mi | 3/2.0 | 1,208 (+1%) | 5mo | $175,999 | $146 | 61 |
| 10659 Fannin Way | 0.61mi | 3/2.0 | 1,049 (-13%) | 6mo | $158,999 | $152 | 45 |
| 10648 Fannin Way | 0.66mi | 3/2.0 | 1,049 (-13%) | 4mo | $162,999 | $155 | 44 |
| 10632 Fannin Way | 0.68mi | 4/2.0 (+1) | 1,375 (+15%) | 4mo | $163,999 | $119 | 36 |
Match score weights: distance 35% · size 25% · config 20% · recency 20%. Top-matched comps best support the ARV.
Projected returns pro-forma
2.03% appreciation · 0.0% rent growth · sell at horizon
- IRR
- -2.4%
- Equity multiple
- 0.87×
- Total profit
- $-7,896
- Equity at exit
- $88,863
- IRR
- 0.9%
- Equity multiple
- 1.12×
- Total profit
- $7,764
- Equity at exit
- $128,230
Cash invested: $62,838 (down + closing). Projections, not guarantees.
Landlord ↔ Tenant lean methodology
- Overall (STATE)
- 87 Strongly Landlord-Friendly
- State Texas
- 87 Strongly Landlord-Friendly · R+5
- County
- — inherits STATE
- City
- — inherits STATE
ZIP-level market 78221
- Home prices YoY
- 0.8%
- Rents YoY
- -7.2%
- Active inventory
- 369
- Price-to-rent
- 9.6×
Monthly cashflow live
- Estimated rent
- $1,586 high interval (Pro) →
- Mortgage (P&I)
- −$1,177
- Tax est. 1.5%
- −$281 /mo · $3,366/yr
- Insurance
- −$94
- HOA
- −$0
- Vacancy / Maint / Mgmt
- −$333
- Net cashflow
- $-298
Break-even live
Sensitivity live
| Price | -10% $-143 | -5% $-221 | +0% $-298 | +5% $-376 | +10% $-453 |
|---|---|---|---|---|---|
| Rent | -10% $-423 | -5% $-361 | +0% $-298 | +5% $-235 | +10% $-173 |
| Rate | -1.0pp $-185 | -0.5pp $-241 | base $-298 | +0.5pp $-356 | +1.0pp $-415 |
UW: 25.0% down · 7.5% · 30yr · 1.5% tax · 5.0% vac · 8.0% maint · 8.0% mgmt
Financing live
Cash to close
- Down payment
- $56,105
- Closing costs
- $6,733
- Reserves months
- —
- Total cash needed
- —
Loan-product check · same deal, 3 products live
Conventional
25% down · 7.5% · 30yr
- Down + closing
- —
- Monthly P&I
- —
- Monthly cashflow
- —
- DSCR
- —
- Eligible?
- —
Personal DTI + credit; lowest rate.
DSCR
20% down · 8.5% · 30yr
- Down + closing
- —
- Monthly P&I
- —
- Monthly cashflow
- —
- DSCR
- —
- Eligible?
- —
No personal income docs; deal must DSCR.
Hard money
10% down · 12.0% · 12mo
- Down + closing
- —
- Monthly P&I
- —
- Monthly cashflow
- —
- DSCR
- —
- Eligible?
- —
Short-term bridge; refi at stabilization.
Rent comps 21 comps
| Address | Beds | Baths | Sqft | Rent | $/sqft | DOM | Units | Dist |
|---|---|---|---|---|---|---|---|---|
| 1119 Jordan Xing San Antonio, TX | 3.0 | 2.0 | 1276 | $1,795 | $1.41 | 44d | 1 | 0.21mi |
| 12910 Clubhouse Blvd San Antonio, TX | 1.0–3.0 | 1.0–2.0 | 920 | $1,384 | $1.50 | 2d | 27 | 0.44mi |
| 1327 Mission Grande Unit 710 San Antonio, TX | 2.0 | 2.0 | 945 | $1,081 | $1.14 | 3d | 1 | 0.65mi |
| 1015 Catalonia Pass San Antonio, TX | 3.0 | 2.0 | 1280 | $1,600 | $1.25 | 5d | 1 | 0.81mi |
| 1011 Catalonia Pass San Antonio, TX | 3.0 | 2.5 | 1470 | $1,700 | $1.16 | 24d | 1 | 0.82mi |
| 12030 Picard Bnd San Antonio, TX | 3.0 | 2.0 | 1450 | $1,495 | $1.03 | 4d | 1 | 0.92mi |
| 1803 Marshall Cross Unit 710 San Antonio, TX | 2.0 | 2.0 | 849 | $807 | $0.95 | 16d | 1 | 0.96mi |
| 718 Albatross Way San Antonio, TX | 3.0 | 2.0 | 1436 | $1,650 | $1.15 | 13d | 1 | 0.98mi |
| 10628 Aqueduct Crk San Antonio, TX | 4.0 | 2.0 | 1500 | $1,700 | $1.13 | 44d | 1 | 0.99mi |
| 1343 Art Wall Way San Antonio, TX | 3.0 | 2.0 | 1440 | $1,395 | $0.97 | 44d | 1 | 0.99mi |
| 1622 Saenz San Antonio, TX | 3.0 | 2.0 | 1298 | $1,475 | $1.14 | 22d | 1 | 1.00mi |
| 12055 Links Pkwy San Antonio, TX | 3.0 | 2.0 | 1479 | $1,625 | $1.10 | 24d | 1 | 1.01mi |
| 1803 Marshall Cross San Antonio, TX | 1.0–3.0 | 1.0–2.0 | 942 | $1,425 | $1.51 | 2d | 38 | 1.02mi |
| 11963 Sand Wedge Way San Antonio, TX | 3.0 | 3.5 | 1474 | $1,575 | $1.07 | 5d | 1 | 1.06mi |
| 13222 Dutra Rd San Antonio, TX | 3.0 | 2.0 | 1266 | $1,595 | $1.26 | 24d | 1 | 1.20mi |
| 2203 Cielo Rio, Lot 102 San Antonio, TX | 2.0–4.0 | 2.0–2.5 | 1574 | $2,360 | $1.50 | 2d | 152 | 1.31mi |
| 1019 Magrum Way San Antonio, TX | 3.0 | 2.0 | 1300 | $1,445 | $1.11 | 11d | 1 | 1.32mi |
| 907 Stricker Path San Antonio, TX | 3.0 | 2.0 | 1129 | $1,500 | $1.33 | 24d | 1 | 1.32mi |
| 1038 Janzen Rd San Antonio, TX | 3.0 | 2.0 | 1125 | $1,725 | $1.53 | 22d | 1 | 1.34mi |
| 1115 Janzen Rd San Antonio, TX | 3.0 | 2.0 | 1300 | $1,595 | $1.23 | 44d | 1 | 1.37mi |
| 1019 Snedeker Dr San Antonio, TX | 3.0 | 2.0 | 1200 | $1,449 | $1.21 | 24d | 1 | 1.44mi |
Listing history 7 events
-
2025-02-08status Active 389-char remark
Show marketing remark (389 chars)
This single-level home opens into a shared living space between the kitchen, dining area and family room for easy entertaining. An owner's suite enjoys a private location in a rear corner of the home, complemented by an en-suite bathroom and walk-in closet. There are two secondary bedrooms at the front of the home, which are comfortable spaces for household members and overnight guests.
-
2025-02-07historical 389-char remark
Show marketing remark (389 chars)
This single-level home opens into a shared living space between the kitchen, dining area and family room for easy entertaining. An owner's suite enjoys a private location in a rear corner of the home, complemented by an en-suite bathroom and walk-in closet. There are two secondary bedrooms at the front of the home, which are comfortable spaces for household members and overnight guests.
-
2024-11-17price $181,999 389-char remark
Show marketing remark (389 chars)
This single-level home opens into a shared living space between the kitchen, dining area and family room for easy entertaining. An owner's suite enjoys a private location in a rear corner of the home, complemented by an en-suite bathroom and walk-in closet. There are two secondary bedrooms at the front of the home, which are comfortable spaces for household members and overnight guests.
-
2024-09-21status Active 389-char remark
Show marketing remark (389 chars)
This single-level home opens into a shared living space between the kitchen, dining area and family room for easy entertaining. An owner's suite enjoys a private location in a rear corner of the home, complemented by an en-suite bathroom and walk-in closet. There are two secondary bedrooms at the front of the home, which are comfortable spaces for household members and overnight guests.
-
2024-09-21price $184,999 389-char remark
Show marketing remark (389 chars)
This single-level home opens into a shared living space between the kitchen, dining area and family room for easy entertaining. An owner's suite enjoys a private location in a rear corner of the home, complemented by an en-suite bathroom and walk-in closet. There are two secondary bedrooms at the front of the home, which are comfortable spaces for household members and overnight guests.
-
2024-03-19historical 389-char remark
Show marketing remark (389 chars)
This single-level home opens into a shared living space between the kitchen, dining area and family room for easy entertaining. An owner's suite enjoys a private location in a rear corner of the home, complemented by an en-suite bathroom and walk-in closet. There are two secondary bedrooms at the front of the home, which are comfortable spaces for household members and overnight guests.
-
2024-03-12$214,999 Active 389-char remark
Show marketing remark (389 chars)
This single-level home opens into a shared living space between the kitchen, dining area and family room for easy entertaining. An owner's suite enjoys a private location in a rear corner of the home, complemented by an en-suite bathroom and walk-in closet. There are two secondary bedrooms at the front of the home, which are comfortable spaces for household members and overnight guests.
ⓘ Source: listings_history table (triggers on properties + properties_extension) + one-shot
backfill from property_details.listing_events for pre-trigger history.
Climate risk First Street
- Flood 1/10 Low FEMA zone X (unshaded) · 0% chance over 30 yrs
- Wildfire 5/10 Major
- Heat 8/10 Severe 7 d/yr ≥109°F today · 23 d/yr by 30 yrs out
- Wind 8/10 Severe 80% chance of damaging wind over 30 yrs
- Air quality 2/10 Low 0 unhealthy d/yr today · 1 by 30 yrs out
Nearby sold comps map
Loading sold comps map…
Walkable amenities ~0.75 mi
Loading nearby amenities…
Taxation est. · year 1
- Rental income
- $19,031
- − Mortgage interest
- −$12,571
- − Property taxes
- −$3,366
- − Insurance
- −$1,122
- − Repairs & maintenance
- −$1,522
- − Management
- −$1,522
- − Depreciation
- −$6,529
- Taxable loss
- −$7,602
- Est. tax savings @ 24.0%
- +$1,825
- After-tax cash flow
- $-1,752/yr
For passive investors: Depreciation is non-cash, so a rental often shows a tax loss while cash-flowing — sheltering income. Rental losses are passive: they offset passive income freely, and up to $25,000/yr can offset ordinary (W-2) income if you actively participate and your MAGI is under $100k (phasing out to $0 by $150k); unused losses carry forward. On sale, claimed depreciation is recaptured at up to 25%, and gains may owe capital-gains tax (a 1031 exchange can defer both). Figures are a year-1 estimate at your 24.0% rate — not tax advice; consult a CPA.
Condition & rehab AI · 0 photos
This single-family home requires extensive repairs and updates to bring it up to a livable condition. Significant work is needed in the kitchen, bathrooms, flooring, and exterior, among other areas.
Repairs flagged
- Major Kitchen countertops — Significant wear and damage observed.
- Major Kitchen cabinets — Visible wear and damage.
- Major Bathroom fixtures — Damaged and in need of replacement.
- Major Flooring — Worn and in need of replacement.
- Major Painting — Significant paint wear and discoloration.
- Major Roof — Visible damage and potential water damage.
- Major Exterior siding — Peeling and in need of repainting or replacement.
- Major Windows — Old and possibly damaged.
- Major Foundation — Signs of settling and potential structural issues.
- Major HVAC system — Appears old and may need replacement or repair.
Value-add opportunities
- Resale Kitchen renovation — A new kitchen will attract buyers and increase the home's value.
- Resale Bathroom updates — Modern bathrooms will appeal to potential buyers and increase the home's value.
- Resale Flooring replacement — New flooring will improve the home's appearance and increase its value.
- Resale Painting — Fresh paint will make the home more appealing and increase its value.
- Resale Roof repair/replacement — A new roof will address potential water damage and increase the home's value.
- Resale Exterior siding repair/replacement — A new exterior will improve the home's curb appeal and increase its value.
- Resale Window replacement — New windows will improve energy efficiency and increase the home's value.
- Resale Foundation repair — Addressing structural issues will increase the home's value and safety.
- Resale HVAC system replacement — A new HVAC system will improve comfort and energy efficiency and increase the home's value.
Renovation cost estimate screening
| Repair item | Severity | Est. cost |
|---|---|---|
| Kitchen countertops · Significant wear and damage observed. | Major | $15,000–50,000 |
| Kitchen cabinets · Visible wear and damage. | Major | $15,000–50,000 |
| Bathroom fixtures · Damaged and in need of replacement. | Major | $15,000–50,000 |
| Flooring · Worn and in need of replacement. | Major | $15,000–50,000 |
| Painting · Significant paint wear and discoloration. | Major | $15,000–50,000 |
| Roof · Visible damage and potential water damage. | Major | $15,000–50,000 |
| Exterior siding · Peeling and in need of repainting or replacement. | Major | $15,000–50,000 |
| Windows · Old and possibly damaged. | Major | $15,000–50,000 |
| Foundation · Signs of settling and potential structural issues. | Major | $15,000–50,000 |
| HVAC system · Appears old and may need replacement or repair. | Major | $15,000–50,000 |
| Total estimated repair cost · 10 items | $150,000–500,000 |
Value-add ROI direction
- Resale Kitchen renovation — A new kitchen will attract buyers and increase the home's value. ↑
- Resale Bathroom updates — Modern bathrooms will appeal to potential buyers and increase the home's value. ↑
- Resale Flooring replacement — New flooring will improve the home's appearance and increase its value. ↑
- Resale Painting — Fresh paint will make the home more appealing and increase its value. ↑
- Resale Roof repair/replacement — A new roof will address potential water damage and increase the home's value. ↑
- Resale Exterior siding repair/replacement — A new exterior will improve the home's curb appeal and increase its value. ↑
- Resale Window replacement — New windows will improve energy efficiency and increase the home's value. ↑
- Resale Foundation repair — Addressing structural issues will increase the home's value and safety. ↑
- Resale HVAC system replacement — A new HVAC system will improve comfort and energy efficiency and increase the home's value. ↑
ⓘ Cost ranges are severity-bucket heuristics (US national rule-of-thumb). Get contractor quotes + a written scope before underwriting a rehab budget.
Schools (NCES district)
- District
- Southside ISD
- NCES district ID
- 4840920
- Math proficiency
- 16% ▼ -15.00%
- Reading proficiency
- 25% ▼ -2.00%
- Median HH income
- $43,526
- Composite
- 17.68/100
- National rank
- #9027
- State rank
- #771 of 826 in TX
Livability — San Antonio
- Score
- 80/100
- State rank
- #31
- US rank
- #1616
Category grades
Schools grade is shown separately in the Schools card above.
Census & demographics
- Census place
- San Antonio, TX
- County
- Bexar County · 1,990,555 people
- City population
- 1,806,925
- Metro
- San Antonio-New Braunfels, TX
- Population (ZIP)
- 42,178
- Household income
- $63,811
- Rent vs Own
- Severe rent burden
- 1180.0
Population outlook (Bexar County) Hauer SSP2
- Today (2025)
- 2,336,851 people
- By 2030
- 2,560,728 · +9.6%
- By 2040
- 3,020,569 · +29.3%
- By 2050
- 3,493,522 · +49.5%
- By 2075
- 4,668,459 · +99.8%
- By 2100
- 5,533,242 · +136.8%
Race, ethnicity, and origin ACS 2023
- Neighborhood character
- Predominantly Hispanic (89%)
- Race & ethnicity
- Hispanic / Latino 89% Two or more races 28% White 9% Native American 2%
- Hispanic origin (detail)
- Mexican 74%
- Common ancestry
- Lithuanian 1% Romanian 1%
- Foreign-born
- 16% · Canada
- Languages at home
- 45% English-only · Spanish 54%
Political lean MEDSL · Bexar
- 2024 margin
- Lean D (+9.8) · D 54.3% · R 44.6% · Other 1.1%
- 2008→2024 swing
- +4.2pp toward D · 2008: 5.6pp · 2024: 9.8pp
- All cycles
- 2024: D+9.8 2020: D+18.2 2016: D+13.5 2012: D+4.6 2008: D+5.6
Not yet ingested
- Civics
- —
Market trends
- HPI YoY
- ▲ 2.03%
- Current HPI
- 251.1635
- Rent YoY
- ▼ -7.21%
- Metro
- San Antonio-New Braunfels, TX
- State GDP YoY
- ▲ 3.95%
- F500 in state
- 110
Industry mix (Fortune 500 HQ in TX)
| Industry | F500 HQs | Revenue |
|---|---|---|
| Energy | 16 | $1,198B |
|
||
| Technology | 5 | $198B |
|
||
| Engineering / Construction | 4 | $72B |
|
||
| Energy Services | 3 | $60B |
|
||
| Utilities | 3 | $41B |
|
||
| Healthcare | 2 | $330B |
|
||
Price history
-15.3% since first listed7 events — show timeline
- 2025-02-08 Relisted — Zillow
- 2025-02-07 Delisted — Zillow
- 2024-11-17 Price Changed $181,999 Zillow
- 2024-09-21 Relisted — Zillow
- 2024-09-21 Price Changed $184,999 Zillow
- 2024-03-19 Delisted — Zillow
- 2024-03-12 Listed $214,999 Zillow
Cash-flow waterfall
monthlySold comps — $/sqft
last 12 mo · ≤1 miLoading sold comps…