 Fourplex
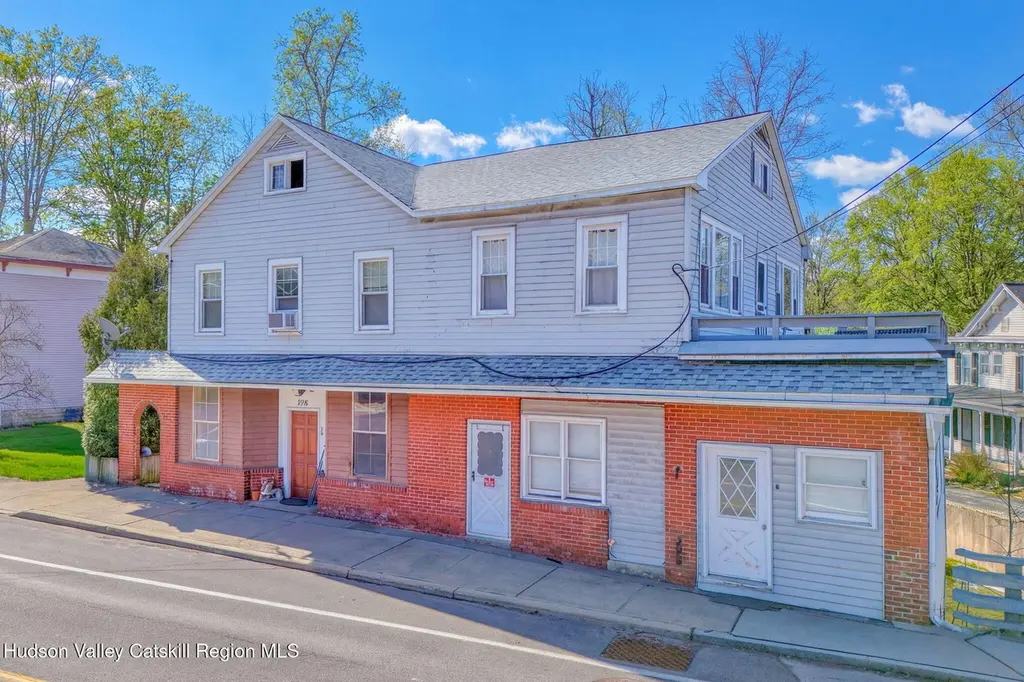
579 Main St · Cairo, NY
Flood risk 10/10 · Severe
- FEMA flood zone
- X (unshaded)
- Chance of flooding over 30 yrs
- 0.99%
- Est. flood insurance / yr
- $473 – $860
Fire risk 4/10 · Minor
- Est. fire insurance / yr
- $691 – $1,283
Heat risk 4/10 · Minor
- Hot days now (above 96°F)
- 7 days/yr
- Hot days in 30 yrs
- 17 days/yr
Wind risk 3/10 · Minor
- Chance of severe wind over 30 yrs
- 6.0%
Air-quality risk 2/10 · Minimal
- Unhealthy air days now
- 0 days/yr
- Unhealthy air days in 30 yrs
- 1 days/yr
Risk factors via First Street. Map © Google.
Why this score? — see what drove the B+ grade
The composite is a weighted blend of 9 inputs, each scored 0–100. Each bar is that input's sub-score; the figure is the points it added to the 100-point composite (weight × sub-score).
- Cash flow +30.0/30.0
- 1% rule +10.0/10.0
- DSCR +10.0/10.0
- Appreciation +10.0/10.0
- ARV discount +7.5/15.0
- Schools +3.8/10.0
- Livability +3.2/5.0
- Rent growth +2.5/5.0
- Condition / age +2.5/5.0
$345,000
🖨 Deal sheet 📄 Offer letter ✓ Due diligence
Multi-family units
County records classify this as Multi-Family (5+ Unit). Listing-text estimate: 4 units. estimate disagrees with records
5+ unit building — per-unit beds/baths from public records are typically unavailable; the breakdown below (if shown) is an estimate from the listing text.
Listing remarks
Rare opportunity to own a fully occupied 4-unit multifamily in the heart of Cairo, offering immediate income. Perfectly positioned along a scenic creek with Catskill Mountain views, this property combines strong cash flow with lifestyle appeal--an ideal formula for long-term investment success. The building features four apartments with bright interiors, generous layouts, and strong tenant appeal. A large elevated deck overlooks the creek, providing a unique outdoor space for two of the 2nd floor apartments. A dedicated off-street parking lot offers added convenience for residents--an increasingly valuable feature that supports long-term occupancy and ease of living. Set within the village,
Key facts
- 0.32 acre lot
- Built 1968
- Listed 73 days
Property features AI
Finance
- Other: Lot approximately 0.32 acres; Zoned residential
- HOA & community: Neighborhood features include street lights and sidewalks
Exterior
- Parking: Off-site parking lot
- Utilities: Public water; Public sewer; Electricity connected (circuit breakers); Phone connected
- Home design: Multi-family property; Two levels; Residential income property; Vinyl siding exterior
- Construction: Built with block and frame construction; Block foundation; Asphalt roof
- Exterior features: Private entrance; Deck; Has a view; Paved road access; Street lights and sidewalks in the neighborhood
Interior
- Flooring: Combination of flooring types; Laminate; Vinyl; Wood
- Heating & cooling: Electric heating; No central cooling
- Interior features: Combination of flooring types; Laminate flooring; Vinyl flooring; Wood flooring
- Laundry & utility: Laundry in basement
Neighborhood map
What this means for you Summary
Snapshot
- This is a 4 × 2-bed/1.5-bath units multifamily listed at $345k.
Deal economics
- At list price, monthly cash flow is $2k ($25k/yr) — positive. Per door: $525/mo.
- The deal already cash-flows at list — no discount required.
- Meets the 1% rule at list price ($6k rent vs $345k).
- Recommended offer: $324k (6.0% below list) — sets the bar for market timing.
- Cap rate 13.8% vs local median 2.9% in Cairo — top-decile yield for the area; either an underpriced asset or a hidden risk that comps aren't pricing in. Stress-test before assuming the spread holds.
Location & tenants
- Location reads 64/100 on livability (#755 in NY) — a middle-class / working-renter tenant base. Strengths: crime A+, housing A+, cost of living B+; Watch: schools D-, amenities F, commute F.
- Cairo-Durham Central School District (rural): math 41% / reading 48% proficiency, ranked #470 of 590 in NY (top 80%) — families likely to look elsewhere, expect single-tenant / working-renter base with shorter leases.
- Market conditions: 62 active listings in the ZIP; 97 units permitted in Greene County in 2024 (0 in 5+ unit buildings).
Forward outlook
- In year one you build about $37k of equity ($2k loan paydown + $34k appreciation (10.0% local appreciation)).
- Greene County population projected at -22% by 2050 — secular population decline; favor cash flow + early exit over multi-decade hold.
- At projected returns (10.0% appreciation + 3.0% rent growth), your $97k cash investment doubles in ~2 years — after that, you're playing with house money.
- By year 2, paydown + projected appreciation supports a ~$59k cash-out refi (75% LTV) — recoverable capital for the next deal without selling this one.
Negotiation context
- It's been on market 73 days — a 6% lower offer ($324k) is reasonable based on typical stale-listing flexibility.
- 5 sale attempts since 9y ago with the ask held roughly flat each time — persistent listings suggest the price (not the market) is what's stuck; bring a comps-based counter.
- Current owner paid $280k; 23% above their basis — modest negotiation headroom, anchor on the comps not their cost.
Risks & watch-outs
- Watch-outs: flood insurance adds $56/mo.
- Climate carrying-cost: severe flood risk — expect insurance premiums to compound above CPI over the hold.
Questions for the listing agent
- It's been on market 73 days. Have you received any prior offers? Is the seller open to a 6% concession, seller financing, or rate buy-down credit?
- Can we see the unit-by-unit rent roll, current vacancy, and any below-market leases? What's the average tenancy length?
- What capital expenditures (roof, boiler, parking lot, exteriors) have been made in the last 5 years, and what's planned in the next 2?
- Built in 1968 — when were the roof, HVAC, electrical panel, plumbing, and water heater last replaced?
- What's the actual annual flood-insurance premium (NFIP or private), and is the property in a SFHA with mandatory coverage?
- Why hasn't it sold? Are there any deal-killer items the seller is aware of (foundation, flood, title, zoning, code violations)?
- Is there a deadline driving the sale (1031 exchange, divorce, estate, relocation)? That informs how much negotiation room exists.
- Schools are D-rated, which usually means shorter tenancies and higher turnover. Who's the typical renter profile here, and what's been the actual vacancy rate?
- What's the average days-on-market for RENTAL listings here right now (not sales)? A rising rental-DOM trend means longer vacancies and softer asking-rent achievability than the comps imply.
- What's the recent tenant-quality profile in this submarket — average credit score on applications, eviction rate, late-payment / NSF rate, and stable-employment percentage? A property-management company in the area should have these aggregated.
- How much new apartment / multifamily construction is in the pipeline within 1–3 miles? Heavy new supply (>2% of stock underway) typically softens rents 12–24 months out; light construction supports rent growth.
Investment metrics
- 1% rule
- 1.71% ✓
- Cap rate
- 13.80%
- Cash-on-cash
- 26.80%
- DSCR
- 2.19
- GRM
- 4.9
CMA / ARV
No comps found within radius.
Projected returns pro-forma
10.0% appreciation · 3.0% rent growth · sell at horizon
- IRR
- 44.0%
- Equity multiple
- 4.33×
- Total profit
- $321,960
- Equity at exit
- $310,803
- IRR
- 38.1%
- Equity multiple
- 9.73×
- Total profit
- $843,227
- Equity at exit
- $670,259
Cash invested: $96,600 (down + closing). Projections, not guarantees.
Landlord ↔ Tenant lean methodology
- Overall (STATE)
- 15 Strongly Tenant-Friendly
- State New York
- 15 Strongly Tenant-Friendly · D+10
- County
- — inherits STATE
- City
- — inherits STATE
ZIP-level market 12413
- Active inventory
- 62
- Price-to-rent
- 19.5×
Monthly cashflow live
- Estimated rent
- $5,892 medium interval (Pro) →
- Mortgage (P&I)
- −$1,809
- Tax from tax record
- −$544 /mo · $6,531/yr
- Insurance
- −$144
- Flood insurance flood zone
- −$56 /mo · $666/yr
- HOA
- −$0
- Vacancy / Maint / Mgmt
- −$1,237
- Net cashflow
- $2,102
Break-even live
4-unit breakdown (identical units grouped — click to expand)
| Units | Beds | Baths | Est. rent |
|---|---|---|---|
| 4× units | 2 | 1.5 | $5,892 |
| #1 | 2 | 1.5 | $1,473 |
| #2 | 2 | 1.5 | $1,473 |
| #3 | 2 | 1.5 | $1,473 |
| #4 | 2 | 1.5 | $1,473 |
| Total (4 units) | $5,892 | ||
UW: 25.0% down · 7.5% · 30yr · 1.5% tax · 5.0% vac · 8.0% maint · 8.0% mgmt
Financing live
Cash to close
- Down payment
- $86,250
- Closing costs
- $10,350
- Reserves months
- —
- Total cash needed
- —
Loan-product check · same deal, 3 products live
Conventional
25% down · 7.5% · 30yr
- Down + closing
- —
- Monthly P&I
- —
- Monthly cashflow
- —
- DSCR
- —
- Eligible?
- —
Personal DTI + credit; lowest rate.
DSCR
20% down · 8.5% · 30yr
- Down + closing
- —
- Monthly P&I
- —
- Monthly cashflow
- —
- DSCR
- —
- Eligible?
- —
No personal income docs; deal must DSCR.
Hard money
10% down · 12.0% · 12mo
- Down + closing
- —
- Monthly P&I
- —
- Monthly cashflow
- —
- DSCR
- —
- Eligible?
- —
Short-term bridge; refi at stabilization.
Listing history 21 events
-
2026-06-14statusdays on market $345,000 Pending 73 DOM
-
2026-06-10days on market $345,000 Active Under Contract 70 DOM
-
2026-06-09days on market $345,000 Active Under Contract 69 DOM
-
2026-06-08days on market $345,000 Active Under Contract 68 DOM
-
2026-06-07days on market $345,000 Active Under Contract 67 DOM
-
2026-06-05days on market $345,000 Active Under Contract 64 DOM
-
2026-06-03days on market $345,000 Active Under Contract 63 DOM
-
2026-06-02days on market $345,000 Active Under Contract 62 DOM
-
2026-06-01days on market $345,000 Active Under Contract 61 DOM
-
2026-05-31days on market $345,000 Active Under Contract 60 DOM
-
2026-05-31days on market $345,000 Active Under Contract 59 DOM
-
2026-04-13historical Active Under Contract
-
2026-03-31$345,000 Active
-
2022-06-13soldstatus $280,000
-
2021-08-25$299,000
-
2020-08-22$335,000
-
2018-10-05soldstatus $215,000
-
2018-10-04soldstatus $215,000
-
2017-07-10$225,000
-
2017-07-10$225,000
-
2004-04-15soldstatus $90,400
ⓘ Source: listings_history table (triggers on properties + properties_extension) + one-shot
backfill from property_details.listing_events for pre-trigger history.
Tax reassessment forecast NY · Partial reset (capped growth)
- Current annual tax
- $6,531 · $544/mo
- Projected year-2 tax
- $6,531 · $544/mo
- Expected delta
- $0/yr ($0/mo · 0.0%)
ⓘ Screening estimate from a state-policy table — verify with the county assessor before closing.
Climate risk First Street
- Flood 10/10 Extreme FEMA zone X (unshaded) · 99% chance over 30 yrs
- Wildfire 4/10 Moderate
- Heat 4/10 Moderate 7 d/yr ≥96°F today · 17 d/yr by 30 yrs out
- Wind 3/10 Moderate 6% chance of damaging wind over 30 yrs
- Air quality 2/10 Low 0 unhealthy d/yr today · 1 by 30 yrs out
Nearby sold comps map
Loading sold comps map…
Walkable amenities ~0.75 mi
Loading nearby amenities…
Taxation est. · year 1
- Rental income
- $70,704
- − Mortgage interest
- −$19,325
- − Property taxes
- −$6,531
- − Insurance
- −$2,392
- − Repairs & maintenance
- −$5,656
- − Management
- −$5,656
- − Depreciation
- −$10,036
- Taxable income
- $21,107
- Est. tax owed @ 24.0%
- −$5,066
- After-tax cash flow
- $20,157/yr
For passive investors: Depreciation is non-cash, so a rental often shows a tax loss while cash-flowing — sheltering income. Rental losses are passive: they offset passive income freely, and up to $25,000/yr can offset ordinary (W-2) income if you actively participate and your MAGI is under $100k (phasing out to $0 by $150k); unused losses carry forward. On sale, claimed depreciation is recaptured at up to 25%, and gains may owe capital-gains tax (a 1031 exchange can defer both). Figures are a year-1 estimate at your 24.0% rate — not tax advice; consult a CPA.
Schools (NCES district)
- District
- Cairo-Durham Central School District
- NCES district ID
- 3606160
- Math proficiency
- 41% ▼ -3.00%
- Reading proficiency
- 48% ▲ 8.00%
- Median HH income
- $46,192
- Composite
- 37.84/100
- National rank
- #4330
- State rank
- #470 of 590 in NY
Livability — Cairo
- Score
- 64/100
- State rank
- #755
- US rank
- #14433
Category grades
Schools grade is shown separately in the Schools card above.
Census & demographics
- Census place
- Cairo, NY
- City population
- 3,406
- Population (ZIP)
- 3,406
Population outlook (Greene County) Hauer SSP2
- Today (2025)
- 44,963 people
- By 2030
- 43,126 · -4.1%
- By 2040
- 38,756 · -13.8%
- By 2050
- 34,913 · -22.4%
- By 2075
- 28,156 · -37.4%
- By 2100
- 22,296 · -50.4%
Race, ethnicity, and origin ACS 2023
- Neighborhood character
- Predominantly White (91%)
- Race & ethnicity
- White 91% Two or more races 7% Hispanic / Latino 6%
- Hispanic origin (detail)
- Puerto Rican 5%
- Common ancestry
- Iranian 4% Romanian 4% Slovak 1%
- Foreign-born
- 2% · Canada
- Languages at home
- 94% English-only · Spanish 4% Other Indo-European 2%
Political lean MEDSL · Greene
- 2024 margin
- R (+17.0) · D 41.5% · R 58.5%
- 2008→2024 swing
- -7.1pp toward R · 2008: -9.9pp · 2024: -17.0pp
- All cycles
- 2024: R+17.0 2020: R+15.6 2016: R+27.4 2012: R+11.1 2008: R+9.9
Not yet ingested
- Civics
- —
Market trends
- HPI YoY
- ▲ 140.58%
- Current HPI
- 406.4299
- Rent YoY
- —
- Metro
- —
- State GDP YoY
- ▲ 2.60%
- F500 in state
- 92
Industry mix (Fortune 500 HQ in NY)
| Industry | F500 HQs | Revenue |
|---|---|---|
| Financial Services | 10 | $950B |
|
||
| Consumer Goods | 9 | $162B |
|
||
| Insurance | 4 | $225B |
|
||
| Telecommunications | 2 | $144B |
|
||
| Pharmaceuticals | 2 | $112B |
|
||
| Media / Entertainment | 2 | $69B |
|
||
Price history
+281.6% since first listed10 events — show timeline
- 2026-04-13 Contingent — HVCRMLS
- 2026-03-31 Listed $345,000 HVCRMLS
- 2022-06-13 Sold (Public Records) $280,000 Public Records
- 2021-08-25 Listed $299,000 HVCRMLS
- 2020-08-22 Listed $335,000 HVCRMLS
- 2018-10-05 Sold (Public Records) $215,000 Public Records
- 2018-10-04 Sold (MLS) $215,000 HVCRMLS
- 2017-07-10 Listed $225,000 HVCRMLS
- 2017-07-10 Listed $225,000 HVCRMLS
- 2004-04-15 Sold (Public Records) $90,400 Public Records
Property tax history
+7.5%/yrLatest (2025): $6,531 · +4.1% YoY. Source: county tax records.
Cash-flow waterfall
monthlySold comps — $/sqft
last 12 mo · ≤1 miLoading sold comps…