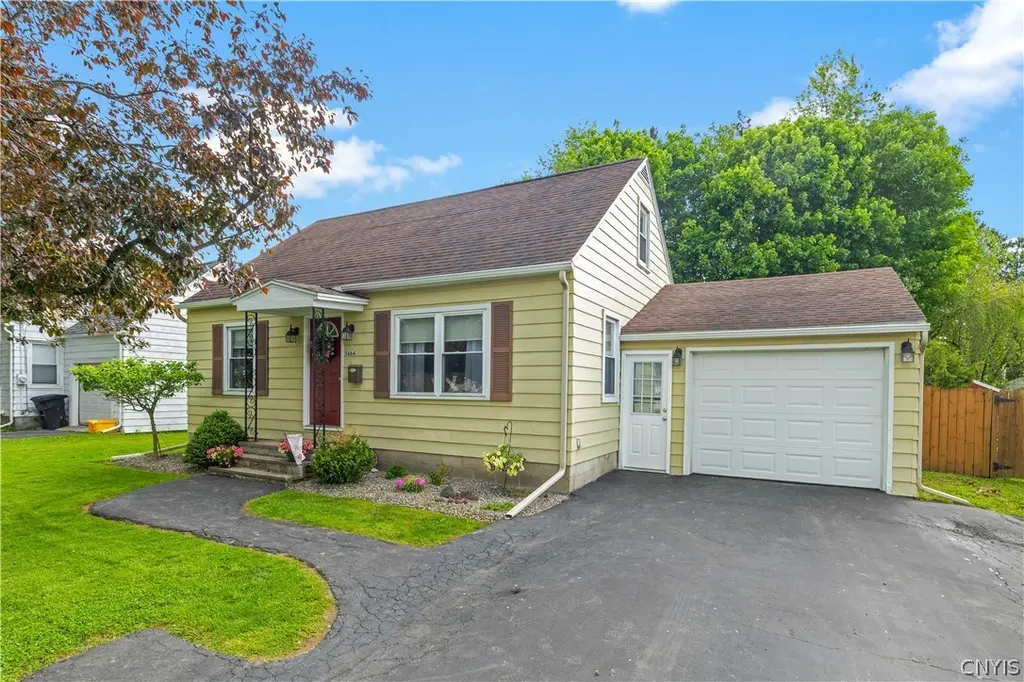
5464 Kenwood Rd · Utica, NY
Flood risk 1/10 · Minimal
- FEMA flood zone
- X (unshaded)
- Chance of flooding over 30 yrs
- 0.0%
- Est. flood insurance / yr
- $473 – $860
Fire risk 1/10 · Minimal
- Est. fire insurance / yr
- $691 – $1,283
Heat risk 3/10 · Minor
- Hot days now (above 97°F)
- 7 days/yr
- Hot days in 30 yrs
- 16 days/yr
Wind risk 2/10 · Minimal
- Chance of severe wind over 30 yrs
- 1.0%
Air-quality risk 2/10 · Minimal
- Unhealthy air days now
- 0 days/yr
- Unhealthy air days in 30 yrs
- 1 days/yr
Risk factors via First Street. Map © Google.
Why this score? — see what drove the D- grade
The composite is a weighted blend of 9 inputs, each scored 0–100. Each bar is that input's sub-score; the figure is the points it added to the 100-point composite (weight × sub-score).
- Appreciation +10.0/10.0
- Cash flow +7.4/30.0
- Schools +5.6/10.0
- Livability +4.0/5.0
- Rent growth +2.5/5.0
- Condition / age +2.5/5.0
- 1% rule +1.9/10.0
- DSCR +1.6/10.0
- ARV discount +0.0/15.0
$244,900
🖨 Deal sheet 📄 Offer letter ✓ Due diligence
Listing remarks
Immerse yourself in the charm of this Cape Cod-style home in the Whitesboro school district. Modern, neutral colors and hardwood floors create a homey environment. The property features a first-floor bedroom and bathroom for convenience. An adaptable office space, overlooking the deck, could also serve as a formal dining room. The kitchen is complete with stainless steel Whirlpool appliances. Enjoy the comfort of central air on those hot summer days. A clean, dry basement for additional storage space. Spacious, private fenced yard with storage shed. Close proximity to shopping centers and everyday amenities adds to its convenience.
Key facts
- First-floor bedroom
- First-floor bathroom
- Central air
Tags
Property features AI
Exterior
- Parking: Attached garage with garage door opener (1 car)
- Utilities: Public water connected; Sewer connected; Cable available; High-speed internet available; Circuit breaker electrical
- Home design: Single-story home; Resale property; Shingle roof; Attic/crawl hatchway(s) insulated; Faces city street
- Construction: Aluminum siding; Block foundation; Existing construction
- Exterior features: Covered porch; Deck; Fully fenced yard; Blacktop driveway; Shed/storage
Interior
- Kitchen: Electric oven; Electric range; Dishwasher; Disposal; Refrigerator; Eat-in kitchen
- Bedrooms: One main-level bedroom
- Flooring: Carpet; Hardwood; Vinyl; Varies
- Bathrooms: One full bathroom (main level)
- Heating & cooling: Gas forced-air heating; Central air conditioning
- Interior features: Den; Eat-in kitchen; Separate/formal living room; Sliding glass doors; Thermal windows; Bedroom on main level
- Laundry & utility: Washer and dryer (in basement); Electric water heater
Neighborhood map
What this means for you Summary
Snapshot
- This is a 4-bed/1.0-bath single-family listed at $245k.
Deal economics
- At list price, monthly cash flow is $-312 ($-4k/yr) — negative.
- To cash-flow at today's rent, offer at most $190k (22.5% below list).
- To meet the 1% rule (rent ≥ 1% of price), the offer needs to be $169k (31.0% below list).
- Recommended offer: $169k (31.0% below list) — sets the bar for 1% rule.
- Cap rate 4.8% vs local median 7.7% in Utica — below-typical yield; the buyer is paying a premium for something (appreciation thesis, condition, location) that the cap rate doesn't capture.
Location & tenants
- Location reads 80/100 on livability (#104 in NY, #1,589 nationally) — a professional / high-income tenant draw. Strengths: commute A+, cost of living A+, housing A+; Watch: employment D, schools D-, crime F.
- Whitesboro Central School District (suburban): math 68% / reading 61% proficiency, ranked #174 of 590 in NY (top 30%) — acceptable for families but not a draw, mixed tenant base, ~2y average lease.
- Market conditions: 23 active listings in the ZIP; 204 units permitted in Oneida County in 2024 (68 in 5+ unit buildings).
Forward outlook
- In year one you build about $26k of equity ($2k loan paydown + $24k appreciation (10.0% local appreciation)).
- Oneida County population projected at -12% by 2050 — secular population decline; favor cash flow + early exit over multi-decade hold.
- By year 2, paydown + projected appreciation supports a ~$42k cash-out refi (75% LTV) — recoverable capital for the next deal without selling this one.
Negotiation context
- Only 4 days on market — expect competitive offers; lowballing is unlikely to land.
- Current owner paid $128k; list at $245k implies a 92% gain — meaningful room to come down on a strong offer.
Risks & watch-outs
- Watch-outs: built in 1949 — expect roof / HVAC / electrical / plumbing capex.
Questions for the listing agent
- What do current leases actually rent for vs. the listed asking? Can we see a recent rent roll and the last 12 months of T-12 income?
- Built in 1949 — when were the roof, HVAC, electrical panel, plumbing, and water heater last replaced?
- Is there a deadline driving the sale (1031 exchange, divorce, estate, relocation)? That informs how much negotiation room exists.
- Schools are D-rated, which usually means shorter tenancies and higher turnover. Who's the typical renter profile here, and what's been the actual vacancy rate?
- Crime grade is F in this area — have there been break-ins, vandalism, or insurance claims at this property in the last 3 years? What carrier currently insures it and at what premium?
- The area grade is low — what's the realistic commute time and amenity access for the typical tenant pool here? Any planned neighborhood developments (good or bad) we should know about?
- What's the average days-on-market for RENTAL listings here right now (not sales)? A rising rental-DOM trend means longer vacancies and softer asking-rent achievability than the comps imply.
- What's the recent tenant-quality profile in this submarket — average credit score on applications, eviction rate, late-payment / NSF rate, and stable-employment percentage? A property-management company in the area should have these aggregated.
- How much new for-sale + rental construction is in the pipeline within 1–3 miles? Heavy new supply typically softens prices + rents 12–24 months out; constrained supply supports both.
Investment metrics
- 1% rule
- 0.69% ✗
- Cap rate
- 4.77%
- Cash-on-cash
- -5.45%
- DSCR
- 0.76
- GRM
- 12.1
CMA / ARV
- ARV (on-the-fly)
- $199,800
- Comps found
- 11
Show comp detail 11 sales within ~0.75 mi
| Address | Dist | Beds/Ba | Sqft | Sold | Price | $/sf | Match |
|---|---|---|---|---|---|---|---|
| 421 Spruce St | 0.13mi | 3/1.5 (-1) | 1,008 (-7%) | 2mo | $170,000 | $169 | 74 |
| 409 Cosby Rd | 0.53mi | 3/1.0 (-1) | 1,146 (+6%) | 2mo | $212,500 | $185 | 58 |
| 619 Cosby Rd | 0.61mi | 3/1.0 (-1) | 1,132 (+5%) | 10mo | $185,000 | $163 | 50 |
| 517 Buchanan Rd | 0.60mi | 3/1.5 (-1) | 1,105 (+2%) | 14mo | $221,450 | $200 | 50 |
| 615 Cosby Rd | 0.60mi | 3/1.5 (-1) | 984 (-9%) | 10mo | $189,100 | $192 | 42 |
| 704 Locust Dr | 0.62mi | 3/1.0 (-1) | 1,043 (-3%) | 23mo | $238,000 | $228 | 41 |
| 187 Wilbur St | 0.67mi | 3/2.0 (-1) | 1,128 (+4%) | 19mo | $245,000 | $217 | 36 |
| 602 Cosby Rd | 0.60mi | 3/1.0 (-1) | 960 (-11%) | 16mo | $164,000 | $171 | 36 |
| 515 Locust Dr | 0.50mi | 3/1.0 (-1) | 1,224 (+13%) | 24mo | $210,000 | $172 | 29 |
| 188 Wilbur St | 0.67mi | 3/1.0 (-1) | 973 (-10%) | 22mo | $203,000 | $209 | 29 |
| 707 Buchanan Rd | 0.70mi | 3/1.0 (-1) | 936 (-13%) | 17mo | $165,000 | $176 | 26 |
Match score weights: distance 35% · size 25% · config 20% · recency 20%. Top-matched comps best support the ARV.
Projected returns pro-forma
10.0% appreciation · 3.0% rent growth · sell at horizon
- IRR
- 20.4%
- Equity multiple
- 2.66×
- Total profit
- $113,529
- Equity at exit
- $220,625
- IRR
- 18.6%
- Equity multiple
- 6.10×
- Total profit
- $349,927
- Equity at exit
- $475,787
Cash invested: $68,572 (down + closing). Projections, not guarantees.
Landlord ↔ Tenant lean methodology
- Overall (STATE)
- 15 Strongly Tenant-Friendly
- State New York
- 15 Strongly Tenant-Friendly · D+10
- County
- — inherits STATE
- City
- — inherits STATE
ZIP-level market 13403
- Home prices YoY
- 21.3%
- Active inventory
- 23
- Price-to-rent
- 12.1×
Monthly cashflow live
- Estimated rent
- $1,690 medium interval (Pro) →
- Mortgage (P&I)
- −$1,284
- Tax from tax record
- −$261 /mo · $3,130/yr
- Insurance
- −$102
- HOA
- −$0
- Vacancy / Maint / Mgmt
- −$355
- Net cashflow
- $-312
Break-even live
UW: 25.0% down · 7.5% · 30yr · 1.5% tax · 5.0% vac · 8.0% maint · 8.0% mgmt
Financing live
Cash to close
- Down payment
- $61,225
- Closing costs
- $7,347
- Reserves months
- —
- Total cash needed
- —
Loan-product check · same deal, 3 products live
Conventional
25% down · 7.5% · 30yr
- Down + closing
- —
- Monthly P&I
- —
- Monthly cashflow
- —
- DSCR
- —
- Eligible?
- —
Personal DTI + credit; lowest rate.
DSCR
20% down · 8.5% · 30yr
- Down + closing
- —
- Monthly P&I
- —
- Monthly cashflow
- —
- DSCR
- —
- Eligible?
- —
No personal income docs; deal must DSCR.
Hard money
10% down · 12.0% · 12mo
- Down + closing
- —
- Monthly P&I
- —
- Monthly cashflow
- —
- DSCR
- —
- Eligible?
- —
Short-term bridge; refi at stabilization.
Listing history 4 events
-
2026-05-20$244,900 Active
-
2017-10-20soldstatus $127,500
-
2013-08-26soldstatus $116,600
-
1998-04-28soldstatus $51,000
ⓘ Source: listings_history table (triggers on properties + properties_extension) + one-shot
backfill from property_details.listing_events for pre-trigger history.
Tax reassessment forecast NY · Partial reset (capped growth)
- Current annual tax
- $3,130 · $261/mo
- Projected year-2 tax
- $3,634 · $303/mo
- Expected delta
- +$505/yr (+$42/mo · 16.1%)
ⓘ Screening estimate from a state-policy table — verify with the county assessor before closing.
Climate risk First Street
- Flood 1/10 Low FEMA zone X (unshaded) · 0% chance over 30 yrs
- Wildfire 1/10 Low
- Heat 3/10 Moderate 7 d/yr ≥97°F today · 16 d/yr by 30 yrs out
- Wind 2/10 Low 100% chance of damaging wind over 30 yrs
- Air quality 2/10 Low 0 unhealthy d/yr today · 1 by 30 yrs out
Nearby sold comps map
Loading sold comps map…
Walkable amenities ~0.75 mi
Loading nearby amenities…
Taxation est. · year 1
- Rental income
- $20,286
- − Mortgage interest
- −$13,718
- − Property taxes
- −$3,130
- − Insurance
- −$1,224
- − Repairs & maintenance
- −$1,623
- − Management
- −$1,623
- − Depreciation
- −$7,124
- Taxable loss
- −$8,156
- Est. tax savings @ 24.0%
- +$1,958
- After-tax cash flow
- $-1,782/yr
For passive investors: Depreciation is non-cash, so a rental often shows a tax loss while cash-flowing — sheltering income. Rental losses are passive: they offset passive income freely, and up to $25,000/yr can offset ordinary (W-2) income if you actively participate and your MAGI is under $100k (phasing out to $0 by $150k); unused losses carry forward. On sale, claimed depreciation is recaptured at up to 25%, and gains may owe capital-gains tax (a 1031 exchange can defer both). Figures are a year-1 estimate at your 24.0% rate — not tax advice; consult a CPA.
Schools (NCES district)
- District
- Whitesboro Central School District
- NCES district ID
- 3631320
- Math proficiency
- 68% ▼ -7.00%
- Reading proficiency
- 61% ▼ -2.00%
- Median HH income
- $59,732
- Composite
- 55.77/100
- National rank
- #1217
- State rank
- #174 of 590 in NY
Livability — Utica
- Score
- 80/100
- State rank
- #104
- US rank
- #1589
Category grades
Schools grade is shown separately in the Schools card above.
Census & demographics
- City population
- 72,968
- Population (ZIP)
- 7,133
Population outlook (Oneida County) Hauer SSP2
- Today (2025)
- 225,223 people
- By 2030
- 220,384 · -2.1%
- By 2040
- 209,071 · -7.2%
- By 2050
- 197,920 · -12.1%
- By 2075
- 175,541 · -22.1%
- By 2100
- 148,491 · -34.1%
Race, ethnicity, and origin ACS 2023
- Neighborhood character
- Predominantly White (80%)
- Race & ethnicity
- White 80% Black 11% Hispanic / Latino 7% Two or more races 2% Asian 1%
- Hispanic origin (detail)
- Puerto Rican 1%
- Common ancestry
- Romanian 24% Lithuanian 3% Slovak 1%
- Foreign-born
- 5% · Canada
- Languages at home
- 90% English-only · Spanish 4% Russian/Polish/Slavic 4% Other Asian/Pacific 1%
Political lean MEDSL · Oneida
- 2024 margin
- Strong R (+21.3) · D 39.4% · R 60.6%
- 2008→2024 swing
- -15.2pp toward R · 2008: -6.1pp · 2024: -21.3pp
- All cycles
- 2024: R+21.3 2020: R+15.5 2016: R+21.1 2012: R+5.3 2008: R+6.1
Not yet ingested
- Civics
- —
Market trends
- HPI YoY
- ▲ 54.39%
- Current HPI
- 309.4119
- Rent YoY
- —
- Metro
- —
- State GDP YoY
- ▲ 2.60%
- F500 in state
- 92
Industry mix (Fortune 500 HQ in NY)
| Industry | F500 HQs | Revenue |
|---|---|---|
| Financial Services | 10 | $950B |
|
||
| Consumer Goods | 9 | $162B |
|
||
| Insurance | 4 | $225B |
|
||
| Telecommunications | 2 | $144B |
|
||
| Pharmaceuticals | 2 | $112B |
|
||
| Media / Entertainment | 2 | $69B |
|
||
Price history
+380.2% since first listed4 events — show timeline
- 2026-05-20 Listed $244,900 CNYIS
- 2017-10-20 Sold (Public Records) $127,500 Public Records
- 2013-08-26 Sold (Public Records) $116,600 Public Records
- 1998-04-28 Sold (Public Records) $51,000 Public Records
Property tax history
+2.9%/yrLatest (2025): $3,130 · +3.9% YoY. Source: county tax records.
Cash-flow waterfall
monthlySold comps — $/sqft
last 12 mo · ≤1 miLoading sold comps…