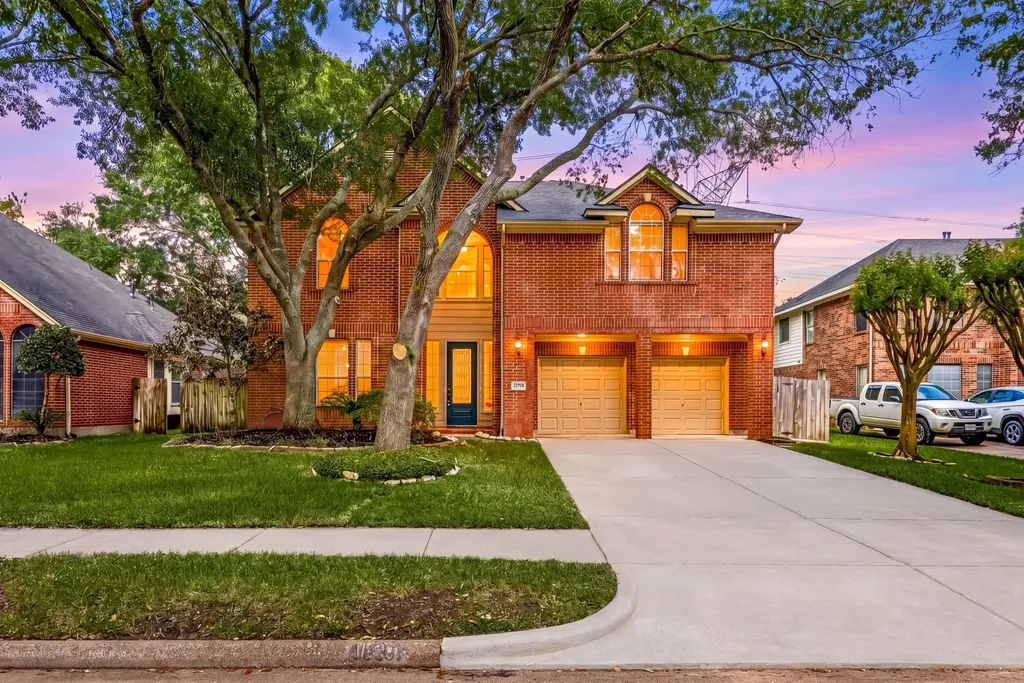
4030 Harwood Dr · Sugar Land, TX
Flood risk 1/10 · Minimal
- FEMA flood zone
- X
- Chance of flooding over 30 yrs
- 0.0%
- Est. flood insurance / yr
- $507 – $1,088
Fire risk 1/10 · Minimal
- Est. fire insurance / yr
- $1,222 – $2,270
Heat risk 9/10 · Severe
- Hot days now (above 110°F)
- 6 days/yr
- Hot days in 30 yrs
- 20 days/yr
Wind risk 9/10 · Severe
- Chance of severe wind over 30 yrs
- 99.0%
Air-quality risk 2/10 · Minimal
- Unhealthy air days now
- 1 days/yr
- Unhealthy air days in 30 yrs
- 2 days/yr
Risk factors via First Street. Map © Google.
Why this score? — see what drove the C- grade
The composite is a weighted blend of 9 inputs, each scored 0–100. Each bar is that input's sub-score; the figure is the points it added to the 100-point composite (weight × sub-score).
- Cash flow +18.7/30.0
- ARV discount +6.3/15.0
- 1% rule +6.0/10.0
- DSCR +5.9/10.0
- Schools +4.5/10.0
- Livability +4.0/5.0
- Rent growth +2.7/5.0
- Condition / age +2.5/5.0
- Appreciation +0.0/10.0
$378,000
🖨 Deal sheet (PDF) 📄 Offer letter ✓ Due diligence
Listing remarks MLS
Rare chance to enjoy a greenbelt setting in New Territory! This inviting 2-story Ryland home offers a bright, spacious layout w/ a soaring 2-story den, dramatic windows, art & TV niches, gaslog fireplace, private study w/ double glass doors, large gameroom up w/ computer nook, & a well-designed kitchen featuring Silestone counters, abundant cabinetry, tile flooring, & a curved breakfast bar that opens to the breakfast area & family room. The oversized primary suite features a bright sitting area by the picture window, while a secondary bedroom down sits beside a full bath for added flexibility. Major updates add standout value, including a new roof & water heater in Aug 2025 plus all bathrooms remodeled/updated in Sept 2024. Out back, enjoy a covered patio/deck, sprinkler system, mature landscaping, & no rear neighbors as the home backs to a park. Also close to the elementary school, tennis courts, & community pool.
Key facts
- 0.25 acre lot
- 2 garage spots
- Community pool
Neighborhood map
What this means for you Summary
Snapshot
- This is a 4-bed/3.0-bath single-family listed at $378k.
Deal economics
- At list price, monthly cash flow is $372 ($4k/yr) — positive.
- The deal already cash-flows at list — no discount required.
- Meets the 1% rule at list price ($4k rent vs $378k).
- Recommended offer: $367k (3.0% below list) — sets the bar for market timing.
- Cap rate 7.5% vs local median 2.6% in Sugar Land — top-decile yield for the area; either an underpriced asset or a hidden risk that comps aren't pricing in. Stress-test before assuming the spread holds.
Location & tenants
- Location reads 80/100 on livability (#38 in TX, #1,758 nationally) — a professional / high-income tenant draw. Strengths: crime A+, employment A+, housing A+; Watch: cost of living D, commute F.
- Fort Bend ISD (suburban): math 44% / reading 53% proficiency, ranked #140 of 826 in TX (top 17%) — families likely to look elsewhere, expect single-tenant / working-renter base with shorter leases.
- Market conditions: Rents flat; 553 active listings in the ZIP; 3 comparable units currently listed for rent nearby; rentals leasing fast (median 13d on market — plan ~1-2 weeks tenant-placement turnaround); high-income renter base; 12,093 units permitted in Fort Bend County in 2024 (815 in 5+ unit buildings).
- This rent runs 32% of the median local income ($157k/yr) — at the standard rent-burdened threshold; future hikes will face affordability resistance.
Forward outlook
- Local home prices are declining (-3.0%/yr); year-one equity from $3k of loan paydown is wiped out by about $11k of value loss. Plan a longer hold.
- Fort Bend County population projected at +75% by 2050 — long-run rental-demand tailwind backs the buy-and-hold thesis.
Negotiation context
- It's been on market 55 days — a 3% lower offer ($367k) is reasonable based on typical stale-listing flexibility.
- 3 sale attempts since 14y ago with the ask held roughly flat each time — persistent listings suggest the price (not the market) is what's stuck; bring a comps-based counter.
- Current owner paid $181k; list at $378k implies a 109% gain — meaningful room to come down on a strong offer.
Risks & watch-outs
- Climate carrying-cost: severe wind risk, 99% chance of damaging wind over 30y; extreme-heat days projected 6→20/yr by 2055 (HVAC capex compounding) — expect insurance premiums to compound above CPI over the hold.
Questions for the listing agent
- It's been on market 55 days. Have you received any prior offers? Is the seller open to a 3% concession, seller financing, or rate buy-down credit?
- What does the HOA fee cover, when was the last increase, and are there any pending special assessments or reserve-fund shortfalls?
- Is there a deadline driving the sale (1031 exchange, divorce, estate, relocation)? That informs how much negotiation room exists.
- Schools are A-rated — typically a magnet for longer-tenancy family renters. What's the average tenant stay here, and is there a school-zone premium baked into asking?
- What's the average days-on-market for RENTAL listings here right now (not sales)? A rising rental-DOM trend means longer vacancies and softer asking-rent achievability than the comps imply.
- What's the recent tenant-quality profile in this submarket — average credit score on applications, eviction rate, late-payment / NSF rate, and stable-employment percentage? A property-management company in the area should have these aggregated.
- How much new for-sale + rental construction is in the pipeline within 1–3 miles? Heavy new supply typically softens prices + rents 12–24 months out; constrained supply supports both.
Investment metrics
- 1% rule
- 1.10% ✓
- Cap rate
- 7.47%
- Cash-on-cash
- 4.22%
- DSCR
- 1.19
- GRM
- 7.6
CMA / ARV
- ARV (median comp)
- $368,265
- List price
- $378,000
- Delta
- 2.64%
- Verdict
- FAIR
- Comps
- 20 within 1.0 mi
Show comp detail 12 sales within ~0.75 mi
| Address | Dist | Beds/Ba | Sqft | Sold | Price | $/sf | Match |
|---|---|---|---|---|---|---|---|
| 4138 N New Meadows Dr | 0.27mi | 4/2.5 | 2,621 (-1%) | 7mo | $349,999 | $134 | 78 |
| 219 Rolling Plains Dr | 0.19mi | 5/3.5 (+1) | 2,876 (+8%) | 6mo | $344,900 | $120 | 65 |
| 318 High Meadows Dr | 0.16mi | 3/2.0 (-1) | 2,416 (-9%) | 6mo | $370,000 | $153 | 64 |
| 4007 Perry Knoll Ct | 0.46mi | 5/2.5 (+1) | 2,510 (-5%) | 2mo | $435,000 | $173 | 61 |
| 4211 W Meadows Dr | 0.20mi | 3/2.5 (-1) | 2,286 (-14%) | 3mo | $339,500 | $149 | 58 |
| 126 Selkirk Dr | 0.28mi | 3/2.5 (-1) | 2,286 (-14%) | 0mo | $350,000 | $153 | 57 |
| 4211 Margate Dr | 0.27mi | 3/2.5 (-1) | 2,286 (-14%) | 2mo | $365,000 | $160 | 56 |
| 4415 Casey Cir | 0.41mi | 4/2.5 | 2,336 (-12%) | 4mo | $388,000 | $166 | 56 |
| 4134 Foxbrush Ln | 0.52mi | 4/3.5 | 2,877 (+8%) | 7mo | $414,900 | $144 | 53 |
| 139 Skycrest Dr | 0.33mi | 5/4.0 (+1) | 2,333 (-12%) | 4mo | $345,000 | $148 | 52 |
| 102 Lindencrest Ct | 0.48mi | 4/2.5 | 2,273 (-14%) | 1mo | $350,000 | $154 | 51 |
| 715 Tyler Run Run | 0.34mi | 3/2.0 (-1) | 2,268 (-14%) | 8mo | $349,000 | $154 | 45 |
Match score weights: distance 35% · size 25% · config 20% · recency 20%. Top-matched comps best support the ARV.
Projected returns pro-forma
-3.0% appreciation · 0.82% rent growth · sell at horizon
- IRR
- -12.4%
- Equity multiple
- 0.56×
- Total profit
- $-46,232
- Equity at exit
- $56,361
- IRR
- -7.3%
- Equity multiple
- 0.59×
- Total profit
- $-43,800
- Equity at exit
- $32,683
Cash invested: $105,840 (down + closing). Projections, not guarantees.
Landlord ↔ Tenant lean methodology
- Overall (STATE)
- 87 Strongly Landlord-Friendly
- State Texas
- 87 Strongly Landlord-Friendly · R+5
- County
- — inherits STATE
- City
- — inherits STATE
ZIP-level market 77479
- Home prices YoY
- -34.9%
- Rents YoY
- 0.8%
- Active inventory
- 553
- Price-to-rent
- 7.6×
Monthly cashflow live
- Estimated rent
- $4,158 medium interval (Pro) →
- Mortgage (P&I)
- −$1,982
- Tax from tax record
- −$669 /mo · $8,031/yr
- Insurance
- −$158
- HOA
- −$104
- Vacancy / Maint / Mgmt
- −$873
- Net cashflow
- $372
Break-even live
Sensitivity live
| Price | -10% $586 | -5% $479 | +0% $372 | +5% $265 | +10% $158 |
|---|---|---|---|---|---|
| Rent | -10% $44 | -5% $208 | +0% $372 | +5% $536 | +10% $701 |
| Rate | -1.0pp $562 | -0.5pp $468 | base $372 | +0.5pp $274 | +1.0pp $175 |
UW: 25.0% down · 7.5% · 30yr · 1.5% tax · 5.0% vac · 8.0% maint · 8.0% mgmt
Financing live
Cash to close
- Down payment
- $94,500
- Closing costs
- $11,340
- Reserves months
- —
- Total cash needed
- —
Loan-product check · same deal, 3 products live
Conventional
25% down · 7.5% · 30yr
- Down + closing
- —
- Monthly P&I
- —
- Monthly cashflow
- —
- DSCR
- —
- Eligible?
- —
Personal DTI + credit; lowest rate.
DSCR
20% down · 8.5% · 30yr
- Down + closing
- —
- Monthly P&I
- —
- Monthly cashflow
- —
- DSCR
- —
- Eligible?
- —
No personal income docs; deal must DSCR.
Hard money
10% down · 12.0% · 12mo
- Down + closing
- —
- Monthly P&I
- —
- Monthly cashflow
- —
- DSCR
- —
- Eligible?
- —
Short-term bridge; refi at stabilization.
Rent comps 3 comps
| Address | Beds | Baths | Sqft | Rent | $/sqft | DOM | Units | Dist |
|---|---|---|---|---|---|---|---|---|
| 4315 Trailwood Dr Sugar Land, TX | 4.0 | 2.5 | 2250 | $5,800 | $2.58 | 13d | 1 | 0.13mi |
| 107 High Meadows Dr Sugar Land, TX | 4.0 | 3.0 | 2619 | $2,600 | $0.99 | 44d | 1 | 0.28mi |
| 5510 Cedaredge Ct Sugar Land, TX | 4.0 | 2.5 | 3078 | $2,950 | $0.96 | 5d | 1 | 0.72mi |
HOA detail
- Monthly dues
- $104 · $1,248/yr
- Likely covers
- watergaslandscapingpool
Listing history 25 events
-
2026-06-18days on market $378,000 Active 55 DOM
-
2026-06-17days on market $378,000 Active 54 DOM
-
2026-06-16days on market $378,000 Active 53 DOM
-
2026-06-15days on market $378,000 Active 52 DOM
-
2026-06-13days on market $378,000 Active 50 DOM
-
2026-06-09days on market $378,000 Active 46 DOM
-
2026-06-08days on market $378,000 Active 45 DOM
-
2026-06-07days on market $378,000 Active 44 DOM
-
2026-06-04days on market $378,000 Active 41 DOM
-
2026-06-03days on market $378,000 Active 40 DOM
-
2026-06-02days on market $378,000 Active 39 DOM
-
2026-06-01days on market $378,000 Active 38 DOM
-
2026-05-31days on market $378,000 Active 37 DOM
-
2026-04-25$389,500 Active 957-char remark
Show marketing remark (957 chars)
Rare chance to enjoy a greenbelt setting in New Territory! This inviting 2-story Ryland home offers a bright, spacious layout w/ a soaring 2-story den, dramatic windows, art & TV niches, gaslog fireplace, private study w/ double glass doors, large gameroom up w/ computer nook, & a well-designed kitchen featuring Silestone counters, abundant cabinetry, tile flooring, & a curved breakfast bar that opens to the breakfast area & family room. The oversized primary suite features a bright sitting area by the picture window, while a secondary bedroom down sits beside a full bath for added flexibility. Major updates add standout value, including a new roof & water heater in Aug 2025 plus all bathrooms remodeled/updated in Sept 2024. Out back, enjoy a covered patio/deck, sprinkler system, mature landscaping, & no rear neighbors as the home backs to a park. Also close to the elementary school, tennis courts, & community pool.
-
2026-04-22historical $389,500 957-char remark
Show marketing remark (957 chars)
Rare chance to enjoy a greenbelt setting in New Territory! This inviting 2-story Ryland home offers a bright, spacious layout w/ a soaring 2-story den, dramatic windows, art & TV niches, gaslog fireplace, private study w/ double glass doors, large gameroom up w/ computer nook, & a well-designed kitchen featuring Silestone counters, abundant cabinetry, tile flooring, & a curved breakfast bar that opens to the breakfast area & family room. The oversized primary suite features a bright sitting area by the picture window, while a secondary bedroom down sits beside a full bath for added flexibility. Major updates add standout value, including a new roof & water heater in Aug 2025 plus all bathrooms remodeled/updated in Sept 2024. Out back, enjoy a covered patio/deck, sprinkler system, mature landscaping, & no rear neighbors as the home backs to a park. Also close to the elementary school, tennis courts, & community pool.
-
2025-11-12historical $2,550
-
2025-09-10$2,800
-
2012-10-04soldstatus
-
2012-10-01soldstatus 504-char remark
Show marketing remark (504 chars)
Fabulous 2 story Ryland home situated in the popular New Territory neighborhood. Lovely gourment kitchen with silestone counters and spacious breakfast bar. Soaring 2-story den with art & T. V niches and feature fireplace. Spacious master with bright picture window and seat. Large family gameroom with computer nook. Recent upgraded carpet throughout and fresh paint 2012. Roof has new shingles 2009. Hot water heater was replaced in 2008. Both A/C units replaced 2007. Don't miss out on this one!
-
2012-08-23historical 504-char remark
Show marketing remark (504 chars)
Fabulous 2 story Ryland home situated in the popular New Territory neighborhood. Lovely gourment kitchen with silestone counters and spacious breakfast bar. Soaring 2-story den with art & T. V niches and feature fireplace. Spacious master with bright picture window and seat. Large family gameroom with computer nook. Recent upgraded carpet throughout and fresh paint 2012. Roof has new shingles 2009. Hot water heater was replaced in 2008. Both A/C units replaced 2007. Don't miss out on this one!
-
2012-06-14$213,000 504-char remark
Show marketing remark (504 chars)
Fabulous 2 story Ryland home situated in the popular New Territory neighborhood. Lovely gourment kitchen with silestone counters and spacious breakfast bar. Soaring 2-story den with art & T. V niches and feature fireplace. Spacious master with bright picture window and seat. Large family gameroom with computer nook. Recent upgraded carpet throughout and fresh paint 2012. Roof has new shingles 2009. Hot water heater was replaced in 2008. Both A/C units replaced 2007. Don't miss out on this one!
-
2004-07-01soldstatus
-
2002-05-16soldstatus
-
2002-04-01soldstatus
-
1997-06-04soldstatus $180,547
ⓘ Source: listings_history table (triggers on properties + properties_extension) + one-shot
backfill from property_details.listing_events for pre-trigger history.
Tax reassessment forecast TX · Resets to sale price
- Current annual tax
- $8,031 · $669/mo
- Projected year-2 tax
- $8,031 · $669/mo
- Expected delta
- $0/yr ($0/mo · 0.0%)
ⓘ Screening estimate from a state-policy table — verify with the county assessor before closing.
Climate risk First Street
- Flood 1/10 Low FEMA zone X · 0% chance over 30 yrs
- Wildfire 1/10 Low
- Heat 9/10 Extreme 6 d/yr ≥110°F today · 20 d/yr by 30 yrs out
- Wind 9/10 Extreme 99% chance of damaging wind over 30 yrs
- Air quality 2/10 Low 1 unhealthy d/yr today · 2 by 30 yrs out
Nearby sold comps map
Loading sold comps map…
Walkable amenities ~0.75 mi
Loading nearby amenities…
Taxation est. · year 1
- Rental income
- $49,901
- − Mortgage interest
- −$21,174
- − Property taxes
- −$8,031
- − Insurance
- −$1,890
- − Repairs & maintenance
- −$3,992
- − Management
- −$3,992
- − HOA
- −$1,248
- − Depreciation
- −$10,996
- Taxable loss
- −$1,423
- Est. tax savings @ 24.0%
- +$341
- After-tax cash flow
- $4,807/yr
For passive investors: Depreciation is non-cash, so a rental often shows a tax loss while cash-flowing — sheltering income. Rental losses are passive: they offset passive income freely, and up to $25,000/yr can offset ordinary (W-2) income if you actively participate and your MAGI is under $100k (phasing out to $0 by $150k); unused losses carry forward. On sale, claimed depreciation is recaptured at up to 25%, and gains may owe capital-gains tax (a 1031 exchange can defer both). Figures are a year-1 estimate at your 24.0% rate — not tax advice; consult a CPA.
Schools (NCES district)
- District
- Fort Bend ISD
- NCES district ID
- 4819650
- Math proficiency
- 44% ▼ -15.00%
- Reading proficiency
- 53% ▼ -4.00%
- Median HH income
- $82,360
- Composite
- 44.61/100
- National rank
- #2779
- State rank
- #140 of 826 in TX
Livability — Sugar Land
- Score
- 80/100
- State rank
- #38
- US rank
- #1758
Category grades
Schools grade is shown separately in the Schools card above.
Census & demographics
- Census place
- Sugar Land, TX
- County
- Fort Bend County · 836,777 people
- City population
- 168,209
- Metro
- Houston-The Woodlands-Sugar Land, TX
- Population (ZIP)
- 92,221
- Household income
- $156,735
- Rent vs Own
- Severe rent burden
- 1207.0
Population outlook (Fort Bend County) Hauer SSP2
- Today (2025)
- 1,004,526 people
- By 2030
- 1,153,104 · +14.8%
- By 2040
- 1,453,718 · +44.7%
- By 2050
- 1,753,781 · +74.6%
- By 2075
- 2,455,772 · +144.5%
- By 2100
- 2,930,528 · +191.7%
Race, ethnicity, and origin ACS 2023
- Neighborhood character
- Diverse neighborhood (Simpson 0.67)
- Race & ethnicity
- Asian 47% White 30% Hispanic / Latino 10% Black 8% Two or more races 8%
- Hispanic origin (detail)
- Mexican 5%
- Common ancestry
- Lithuanian 2% Romanian 1% Slovak 1%
- Foreign-born
- 42% · China, Canada, Vietnam
- Languages at home
- 52% English-only · Other Indo-European 16% Chinese 13% Spanish 6%
Political lean MEDSL · Fort Bend
- 2024 margin
- Toss-up / Even · D 49.5% · R 47.9% · Other 2.6%
- 2008→2024 swing
- +4.0pp toward D · 2008: -2.4pp · 2024: 1.6pp
- All cycles
- 2024: D+1.6 2020: D+10.6 2016: D+6.6 2012: R+6.8 2008: R+2.4
Not yet ingested
- Civics
- —
Market trends
- HPI YoY
- ▼ -121.96%
- Current HPI
- 227.7544
- Rent YoY
- ▲ 0.82%
- Metro
- Houston-The Woodlands-Sugar Land, TX
- State GDP YoY
- ▲ 3.95%
- F500 in state
- 110
Industry mix (Fortune 500 HQ in TX)
| Industry | F500 HQs | Revenue |
|---|---|---|
| Energy | 16 | $1,198B |
|
||
| Technology | 5 | $198B |
|
||
| Engineering / Construction | 4 | $72B |
|
||
| Energy Services | 3 | $60B |
|
||
| Utilities | 3 | $41B |
|
||
| Healthcare | 2 | $330B |
|
||
Price history
+115.7% since first listed12 events — show timeline
- 2026-04-25 Listed $389,500 HARMLS
- 2026-04-22 Coming Soon $389,500 HARMLS
- 2025-11-12 Rental Removed $2,550 TURBOTENANT
- 2025-09-10 Listed for Rent $2,800 TURBOTENANT
- 2012-10-04 Sold (Public Records) — Public Records
- 2012-10-01 Sold (MLS) — HARMLS
- 2012-08-23 Listing Removed — HARMLS
- 2012-06-14 Listed $213,000 HARMLS
- 2004-07-01 Sold (Public Records) — Public Records
- 2002-05-16 Sold (Public Records) — Public Records
- 2002-04-01 Sold (Public Records) — Public Records
- 1997-06-04 Sold (Public Records) $180,547 Public Records
Property tax history
+3.6%/yrLatest (2025): $8,031 · +10.8% YoY. Source: county tax records.
Cash-flow waterfall
monthlySold comps — $/sqft
last 12 mo · ≤1 miLoading sold comps…