 Multi-family
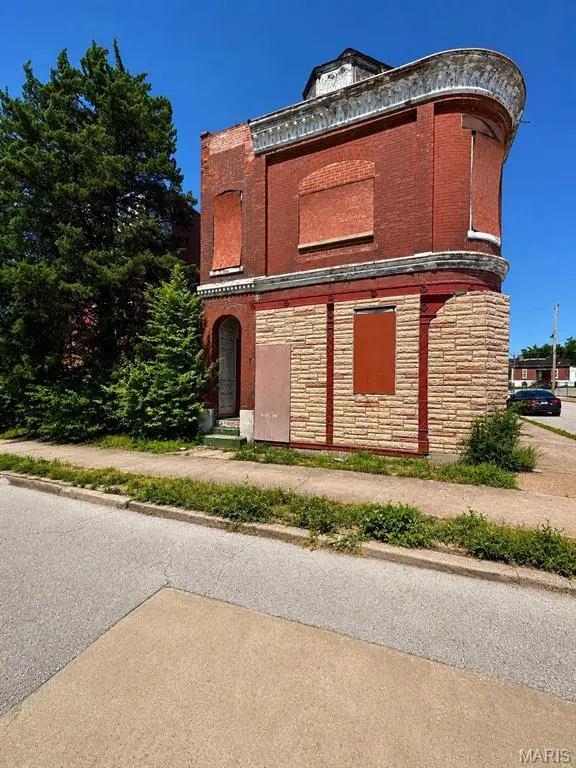
1927 Annie Malone Dr · St. Louis, MO
Flood risk 1/10 · Minimal
- FEMA flood zone
- X (unshaded)
- Chance of flooding over 30 yrs
- 0.0%
- Est. flood insurance / yr
- $473 – $860
Fire risk 1/10 · Minimal
- Est. fire insurance / yr
- $1,054 – $1,958
Heat risk 5/10 · Moderate
- Hot days now (above 107°F)
- 7 days/yr
- Hot days in 30 yrs
- 20 days/yr
Wind risk 2/10 · Minimal
- Chance of severe wind over 30 yrs
- 1.0%
Air-quality risk 4/10 · Minor
- Unhealthy air days now
- 5 days/yr
- Unhealthy air days in 30 yrs
- 6 days/yr
Risk factors via First Street. Map © Google.
Why this score? — see what drove the D+ grade
The composite is a weighted blend of 9 inputs, each scored 0–100. Each bar is that input's sub-score; the figure is the points it added to the 100-point composite (weight × sub-score).
- Cash flow +15.0/30.0
- ARV discount +7.5/15.0
- 1% rule +5.0/10.0
- DSCR +5.0/10.0
- Appreciation +3.9/10.0
- Rent growth +2.5/5.0
- Livability +2.5/5.0
- Condition / age +2.5/5.0
- Schools +1.2/10.0
$25,000
🖨 Deal sheet 📄 Offer letter ✓ Due diligence
Multi-family units
County records classify this as Multi-Family (2-4 Unit). Listing-text estimate: 1 unit. estimate disagrees with records
Listing remarks
Great investment opportunity, located on a quiet street with strong upside potential. Ideal for an investor looking to rehab and rent or rehab and resell. Property is vacant + ready for renovation. Priced aggressively to reflect condition. Bring your vision and TLC to unlock the potential. Property being sold as is, seller will not do any inspections, repairs or warranties. your showing today.
Key facts
- 6,499 sq ft lot
- Built 1890
- Listed 14 days
Property features AI
Exterior
- Utilities: Electric service by Ameren
- Home design: Single-family residential; Two and a half levels; Residential property
- Construction: Brick and other construction materials
- Exterior features: Corner lot; Near public transit; Public water; Public sewer
Interior
- Bedrooms: No bedrooms listed
- Bathrooms: 2 full bathrooms total; 1 full bathroom on the main level; 1 full bathroom on the upper level
- Heating & cooling: Forced air heating (natural gas); No central cooling listed
- Interior features: Partially finished basement; 12 total rooms
Neighborhood map
What this means for you Summary
Snapshot
- This is a ?-bed/2.0-bath multifamily listed at $25k.
Deal economics
- At list price, monthly cash flow is $2k ($19k/yr) — positive.
- The deal already cash-flows at list — no discount required.
- Meets the 1% rule at list price ($2k rent vs $25k).
- Cap rate 80.4% vs local median 5.0% in St. Louis — top-decile yield for the area; either an underpriced asset or a hidden risk that comps aren't pricing in. Stress-test before assuming the spread holds.
Location & tenants
- Location reads: area grade D — affects rentability + tenant quality, not the cash-flow math above.
- St. Louis City (urban): math 10% / reading 18% proficiency, ranked #312 of 324 in MO (top 96%) — low school quality limits family demand, transient renter base, plan for 1-2y turnover; 80% free/reduced lunch — lower-income household profile, screen leases tightly.
- Zoned schools: Sumner High (math 2% / reading 2%, grade F, #520 of 521 statewide, top 100%, 264 students, 99% FRL) — zoned schools average 99% FRL vs 80% district-wide (18 pts higher); higher-poverty schools than district average — tighter screening recommended.
- Market conditions: 58 active listings in the ZIP; 10 comparable units currently listed for rent nearby; rentals lingering (median 44d on market — plan ~5-8 weeks vacancy on turnover, expect pricing pressure); 60% of comp listings sitting > 30 days — soft ceiling on asking rent; 294 units permitted in St. Louis city in 2024 (227 in 5+ unit buildings).
Forward outlook
- Local home prices are declining (-2.1%/yr); year-one equity from $173 of loan paydown is wiped out by about $536 of value loss. Plan a longer hold.
- St. Louis County population projected to shrink 6% by 2050 — rents likely to lag national; underwrite the cash flow, not the appreciation.
- At projected returns (-2.1% appreciation + 3.0% rent growth), your $7k cash investment doubles in ~1 year — after that, you're playing with house money.
Negotiation context
- Only 14 days on market — expect competitive offers; lowballing is unlikely to land.
Risks & watch-outs
- Watch-outs: built in 1890 — expect roof / HVAC / electrical / plumbing capex.
- Climate carrying-cost: extreme-heat days projected 7→20/yr by 2055 (HVAC capex compounding) — expect insurance premiums to compound above CPI over the hold.
Questions for the listing agent
- Built in 1890 — when were the roof, HVAC, electrical panel, plumbing, and water heater last replaced?
- Is there a deadline driving the sale (1031 exchange, divorce, estate, relocation)? That informs how much negotiation room exists.
- The area grade is low — what's the realistic commute time and amenity access for the typical tenant pool here? Any planned neighborhood developments (good or bad) we should know about?
- What's the average days-on-market for RENTAL listings here right now (not sales)? A rising rental-DOM trend means longer vacancies and softer asking-rent achievability than the comps imply.
- What's the recent tenant-quality profile in this submarket — average credit score on applications, eviction rate, late-payment / NSF rate, and stable-employment percentage? A property-management company in the area should have these aggregated.
- How much new apartment / multifamily construction is in the pipeline within 1–3 miles? Heavy new supply (>2% of stock underway) typically softens rents 12–24 months out; light construction supports rent growth.
Investment metrics
- 1% rule
- 8.62% ✓
- Cap rate
- 80.43%
- Cash-on-cash
- 264.78%
- DSCR
- 12.78
- GRM
- 1.0
CMA / ARV
- ARV (on-the-fly)
- $66,924
- Comps found
- 11
Show comp detail 11 sales within ~0.75 mi
| Address | Dist | Beds/Ba | Sqft | Sold | Price | $/sf | Match |
|---|---|---|---|---|---|---|---|
| 4258 East St Louis Ave | 0.33mi | 4/2.0 | 2,850 (+11%) | 1mo | $55,000 | $19 | 66 |
| 4123 Labadie Ave | 0.47mi | 4/2.0 | 2,460 (-4%) | 11mo | $125,000 | $51 | 61 |
| 4254 E Saint Louis Ave | 0.33mi | 8/3.0 | 2,850 (+11%) | 4mo | $35,000 | $12 | 60 |
| 4234 Cook Ave | 0.51mi | 2/2.0 | 2,496 (-3%) | 15mo | $50,000 | $20 | 59 |
| 3843 Saint Ferdinand Ave | 0.60mi | 6/2.0 | 2,788 (+8%) | 1mo | $325,000 | $117 | 58 |
| 3932 Cook Ave | 0.68mi | 4/— | 2,736 (+6%) | 4mo | $70,000 | $26 | 55 |
| 3860 Evans Ave | 0.67mi | 5/2.0 | 2,596 (+1%) | 22mo | $39,900 | $15 | 50 |
| 3939 Greer Ave | 0.69mi | —/— | 2,756 (+7%) | 10mo | $89,900 | $33 | 48 |
| 4028 Sullivan Ave | 0.64mi | 2/1.0 | 2,550 (-1%) | 23mo | $80,000 | $31 | 46 |
| 3840 Saint Louis Ave | 0.69mi | 5/3.0 | 2,880 (+12%) | 11mo | $55,000 | $19 | 35 |
| 4448 Ashland Ave | 0.73mi | 1/1.0 | 2,892 (+12%) | 15mo | $75,000 | $26 | 29 |
Match score weights: distance 35% · size 25% · config 20% · recency 20%. Top-matched comps best support the ARV.
Projected returns pro-forma
-2.14% appreciation · 3.0% rent growth · sell at horizon
- IRR
- —
- Equity multiple
- 14.61×
- Total profit
- $95,250
- Equity at exit
- $4,691
- IRR
- —
- Equity multiple
- 31.07×
- Total profit
- $210,510
- Equity at exit
- $3,854
Cash invested: $7,000 (down + closing). Projections, not guarantees.
Landlord ↔ Tenant lean methodology
- Overall (STATE)
- 81 Strongly Landlord-Friendly
- State Missouri
- 81 Strongly Landlord-Friendly · R+10
- County
- — inherits STATE
- City
- — inherits STATE
ZIP-level market 63113
- Home prices YoY
- -2.0%
- Active inventory
- 58
- Price-to-rent
- 1.0×
Monthly cashflow live
- Estimated rent
- $2,156 high interval (Pro) →
- Mortgage (P&I)
- −$131
- Tax from tax record
- −$17 /mo · $205/yr
- Insurance
- −$10
- HOA
- −$0
- Vacancy / Maint / Mgmt
- −$453
- Net cashflow
- $1,545
Break-even live
UW: 25.0% down · 7.5% · 30yr · 1.5% tax · 5.0% vac · 8.0% maint · 8.0% mgmt
Financing live
Cash to close
- Down payment
- $6,250
- Closing costs
- $750
- Reserves months
- —
- Total cash needed
- —
Loan-product check · same deal, 3 products live
Conventional
25% down · 7.5% · 30yr
- Down + closing
- —
- Monthly P&I
- —
- Monthly cashflow
- —
- DSCR
- —
- Eligible?
- —
Personal DTI + credit; lowest rate.
DSCR
20% down · 8.5% · 30yr
- Down + closing
- —
- Monthly P&I
- —
- Monthly cashflow
- —
- DSCR
- —
- Eligible?
- —
No personal income docs; deal must DSCR.
Hard money
10% down · 12.0% · 12mo
- Down + closing
- —
- Monthly P&I
- —
- Monthly cashflow
- —
- DSCR
- —
- Eligible?
- —
Short-term bridge; refi at stabilization.
Rent comps 10 comps
| Address | Beds | Baths | Sqft | Rent | $/sqft | DOM | Units | Dist |
|---|---|---|---|---|---|---|---|---|
| 3127 Clay Ave Unit B St. Louis, MO | 1.0 | 1.0 | 3536 | $950 | $0.27 | 43d | 1 | 0.62mi |
| 1416 N Euclid Ave Saint Louis, MO | 2.0 | 2.0 | 2702 | $1,200 | $0.44 | 43d | 1 | 1.08mi |
| 404 N Sarah St Saint Louis, MO | 3.0 | 2.5 | 1772 | $2,600 | $1.47 | 43d | 1 | 1.17mi |
| 3717-3721 Westminster Pl St. Louis, MO | 3.0 | 1.0–3.0 | 1343 | $2,098 | $1.56 | 16d | 4 | 1.31mi |
| 3701 Lindell Blvd Saint Louis, MO | 3.0 | 1.0–3.0 | 1073 | $1,966 | $1.83 | 16d | 81 | 1.36mi |
| 3701 Lindell Blvd Saint Louis, MO | 3.0 | 1.0–3.0 | 1073 | $1,963 | $1.83 | 1d | 128 | 1.36mi |
| 3681 Lindell Blvd Saint Louis, MO | 3.0 | 1.0–2.5 | 1292 | $2,818 | $2.18 | 1d | 62 | 1.38mi |
| 4868 Farlin Ave Unit 2 St. Louis, MO | 2.0 | 1.0 | 2690 | $1,100 | $0.41 | 43d | 1 | 1.41mi |
| 5096 Minerva Ave Unit C St. Louis, MO | 3.0 | 1.0 | 1800 | $1,395 | $0.78 | 43d | 1 | 1.47mi |
| 4133 Laclede Ave Unit 1 St. Louis, MO | 3.0 | 1.5 | 2775 | $1,999 | $0.72 | 43d | 1 | 1.48mi |
Listing history 10 events
-
2026-06-18days on market $25,000 Active 14 DOM
-
2026-06-17days on market $25,000 Active 13 DOM
-
2026-06-16days on market $25,000 Active 12 DOM
-
2026-06-15days on market $25,000 Active 11 DOM
-
2026-06-13days on market $25,000 Active 9 DOM
-
2026-06-09days on market $25,000 Active 5 DOM
-
2026-06-08days on market $25,000 Active 4 DOM
-
2026-06-07days on market $25,000 Active 3 DOM
-
2026-06-05remarks 396-char remark
-
2026-06-05$25,000 Active 1 DOM
ⓘ Source: listings_history table (triggers on properties + properties_extension) + one-shot
backfill from property_details.listing_events for pre-trigger history.
Tax reassessment forecast MO · Resets to sale price
- Current annual tax
- $205 · $17/mo
- Projected year-2 tax
- $242 · $20/mo
- Expected delta
- +$37/yr (+$3/mo · 18.2%)
ⓘ Screening estimate from a state-policy table — verify with the county assessor before closing.
Climate risk First Street
- Flood 1/10 Low FEMA zone X (unshaded) · 0% chance over 30 yrs
- Wildfire 1/10 Low
- Heat 5/10 Major 7 d/yr ≥107°F today · 20 d/yr by 30 yrs out
- Wind 2/10 Low 100% chance of damaging wind over 30 yrs
- Air quality 4/10 Moderate 5 unhealthy d/yr today · 6 by 30 yrs out
Nearby sold comps map
Loading sold comps map…
Walkable amenities ~0.75 mi
Loading nearby amenities…
Taxation est. · year 1
- Rental income
- $25,870
- − Mortgage interest
- −$1,400
- − Property taxes
- −$205
- − Insurance
- −$125
- − Repairs & maintenance
- −$2,070
- − Management
- −$2,070
- − Depreciation
- −$727
- Taxable income
- $19,273
- Est. tax owed @ 24.0%
- −$4,626
- After-tax cash flow
- $13,909/yr
For passive investors: Depreciation is non-cash, so a rental often shows a tax loss while cash-flowing — sheltering income. Rental losses are passive: they offset passive income freely, and up to $25,000/yr can offset ordinary (W-2) income if you actively participate and your MAGI is under $100k (phasing out to $0 by $150k); unused losses carry forward. On sale, claimed depreciation is recaptured at up to 25%, and gains may owe capital-gains tax (a 1031 exchange can defer both). Figures are a year-1 estimate at your 24.0% rate — not tax advice; consult a CPA.
Schools (NCES district)
- District
- St. Louis City
- NCES district ID
- 2929280
- Math proficiency
- 10% ▼ -6.00%
- Reading proficiency
- 18% ▼ -3.00%
- Median HH income
- $35,685
- Composite
- 11.54/100
- National rank
- #9699
- State rank
- #312 of 324 in MO
Livability — St. Louis
No livability data for this city. (Only ~50 U.S. cities are tracked.)
Census & demographics
- Census place
- St. Louis, MO
- City population
- 283,259
- Population (ZIP)
- 11,610
Population outlook (St. Louis County) Hauer SSP2
- Today (2025)
- 315,737 people
- By 2030
- 313,865 · -0.6%
- By 2040
- 305,439 · -3.3%
- By 2050
- 296,529 · -6.1%
- By 2075
- 271,028 · -14.2%
- By 2100
- 255,359 · -19.1%
Race, ethnicity, and origin ACS 2023
- Neighborhood character
- Predominantly Black (91%)
- Race & ethnicity
- Black 91% White 6% Two or more races 2% Hispanic / Latino 1%
- Foreign-born
- 2% · Canada
Political lean MEDSL · St. Louis
- 2024 margin
- Solid D (+64.7) · D 81.4% · R 16.7% · Other 2.0%
- 2008→2024 swing
- -3.5pp toward R · 2008: 68.2pp · 2024: 64.7pp
- All cycles
- 2024: D+64.7 2020: D+66.2 2016: D+63.7 2012: D+66.6 2008: D+68.2
Not yet ingested
- Civics
- —
Market trends
- HPI YoY
- ▼ -2.14%
- Current HPI
- 107.1335
- Rent YoY
- —
- Metro
- —
- State GDP YoY
- ▲ 1.84%
- F500 in state
- 20
Industry mix (Fortune 500 HQ in MO)
| Industry | F500 HQs | Revenue |
|---|---|---|
| Healthcare | 1 | $163B |
|
||
| Insurance | 1 | $21B |
|
||
| Industrial Technology | 1 | $17B |
|
||
| Retail | 1 | $16B |
|
||
| Industrial Distribution | 1 | $10B |
|
||
| Utilities | 1 | $9B |
|
||
Price history
1 event — show timeline
- 2026-06-04 Listed $25,000 MARIS as Distributed by MLS Grid
Cash-flow waterfall
monthlySold comps — $/sqft
last 12 mo · ≤1 miLoading sold comps…