 🏷️ Likely Rental
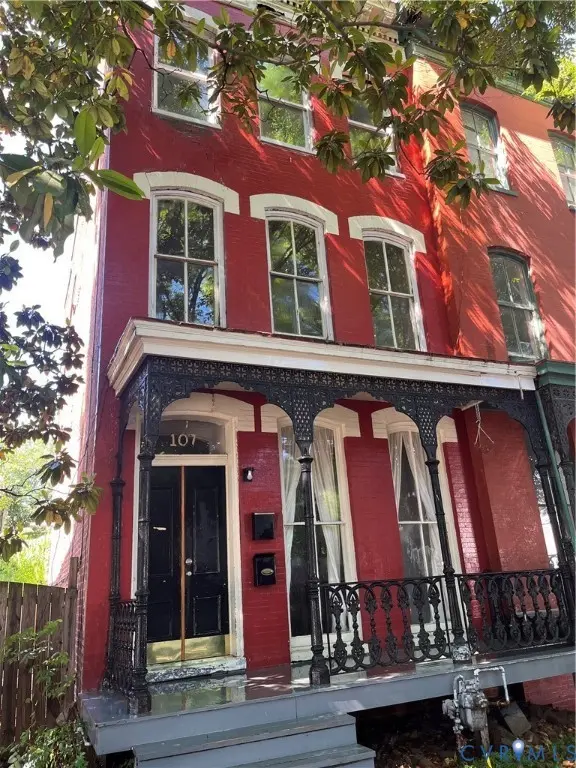
107 W Clay St · Richmond, VA
Flood risk 1/10 · Minimal
- FEMA flood zone
- X (unshaded)
- Chance of flooding over 30 yrs
- 0.0%
- Est. flood insurance / yr
- $507 – $1,088
Fire risk 1/10 · Minimal
- Est. fire insurance / yr
- $666 – $1,236
Heat risk 8/10 · Major
- Hot days now (above 105°F)
- 7 days/yr
- Hot days in 30 yrs
- 16 days/yr
Wind risk 6/10 · Moderate
- Chance of severe wind over 30 yrs
- 27.0%
Air-quality risk 2/10 · Minimal
- Unhealthy air days now
- 1 days/yr
- Unhealthy air days in 30 yrs
- 2 days/yr
Risk factors via First Street. Map © Google.
Why this score? — see what drove the C grade
The composite is a weighted blend of 9 inputs, each scored 0–100. Each bar is that input's sub-score; the figure is the points it added to the 100-point composite (weight × sub-score).
- Cash flow +18.2/30.0
- ARV discount +15.0/15.0
- DSCR +5.7/10.0
- 1% rule +4.2/10.0
- Livability +4.2/5.0
- Rent growth +4.1/5.0
- Schools +3.3/10.0
- Condition / age +2.5/5.0
- Appreciation +0.0/10.0
$457,950
🖨 Deal sheet 📄 Offer letter ✓ Due diligence
Multi-family units
County records classify this as Multi-Family (2-4 Unit). Listing-text estimate: 2 units. confirmed
Listing remarks MLS
2 bedroom apartment in rear, last rent for $550/mo
Key facts
- 2,787 sq ft lot
- Built 1875
- Listed 7 days
Property features AI
Finance
- Financial info: Property contains two rental units with listed rents: one unit at $850 and one unit at $2,000
Exterior
- Parking: Alley access; On-street parking
- Utilities: Public water; Public sewer
- Home design: 3-story building; Multi-family property (2 total units); Brick and plaster construction; Shingle roof; Zoned R-6
- Construction: Built (year listed as actual); Brick and plaster exterior; Shingle roof
- Exterior features: Front porch; Fenced backyard; Level lot
Interior
- Kitchen: Dishwasher; Refrigerator; Eat-in kitchen / breakfast area
- Bedrooms: Two 2-bedroom units; One 4-bedroom unit
- Bathrooms: Units include full bathrooms (1 bath in 2-bed unit; 2 baths in 4-bed unit)
- Heating & cooling: Central air; 3+ zoned heating and 3+ zoned air conditioning; Electric heat and heat pump in one unit
- Interior features: Built-in bookcases; Breakfast area / eat-in kitchen; High ceilings; Laminate counters
- Laundry & utility: Gas water heater
Neighborhood map
What this means for you Summary
Snapshot
- This is a 2 × 3-bed/1.5-bath units multifamily listed at $458k.
Deal economics
- At list price, monthly cash flow is $415 ($5k/yr) — positive. Per door: $207/mo.
- The deal already cash-flows at list — no discount required.
- To meet the 1% rule (rent ≥ 1% of price), the offer needs to be $422k (7.9% below list).
- Recommended offer: $422k (7.9% below list) — sets the bar for 1% rule.
- Cap rate 7.4% vs local median 3.3% in Richmond — top-decile yield for the area; either an underpriced asset or a hidden risk that comps aren't pricing in. Stress-test before assuming the spread holds.
Location & tenants
- Location reads 84/100 on livability (#33 in VA, #793 nationally) — a professional / high-income tenant draw. Strengths: amenities A+, commute A+, health & safety A+; Watch: crime D-.
- Richmond City Public School District (urban): math 32% / reading 47% proficiency, ranked #123 of 131 in VA (top 94%) — families likely to look elsewhere, expect single-tenant / working-renter base with shorter leases; 74% free/reduced lunch — lower-income household profile, screen leases tightly.
- Market conditions: Rents rising fast (+6.5%/yr); 170 active listings in the ZIP; 6 comparable units currently listed for rent nearby; rentals lingering (median 44d on market — plan ~5-8 weeks vacancy on turnover, expect pricing pressure); 67% of comp listings sitting > 30 days — soft ceiling on asking rent; 2,540 units permitted in Richmond city in 2024 (2,077 in 5+ unit buildings).
- At $4,219/mo this rent would consume 82% of the median local household income ($61k/yr) (locally 2962% of renters already pay >50% of income on rent) — very limited rent-growth headroom before tenants either downsize or default.
Forward outlook
- Local home prices are declining (-3.0%/yr); year-one equity from $3k of loan paydown is wiped out by about $14k of value loss. Plan a longer hold.
- Richmond County population projected at +40% by 2050 — long-run rental-demand tailwind backs the buy-and-hold thesis.
Negotiation context
- Only 7 days on market — expect competitive offers; lowballing is unlikely to land.
- 5 sale attempts since 21y ago with the ask held roughly flat each time — persistent listings suggest the price (not the market) is what's stuck; bring a comps-based counter.
- Current owner paid $238k; list at $458k implies a 92% gain — meaningful room to come down on a strong offer.
Risks & watch-outs
- Watch-outs: built in 1875 — expect roof / HVAC / electrical / plumbing capex.
- Climate carrying-cost: major wind risk, 27% chance of damaging wind over 30y; extreme-heat days projected 7→16/yr by 2055 (HVAC capex compounding) — expect insurance premiums to compound above CPI over the hold.
Questions for the listing agent
- Can we see the unit-by-unit rent roll, current vacancy, and any below-market leases? What's the average tenancy length?
- What capital expenditures (roof, boiler, parking lot, exteriors) have been made in the last 5 years, and what's planned in the next 2?
- Built in 1875 — when were the roof, HVAC, electrical panel, plumbing, and water heater last replaced?
- Is there a deadline driving the sale (1031 exchange, divorce, estate, relocation)? That informs how much negotiation room exists.
- Schools are A-rated — typically a magnet for longer-tenancy family renters. What's the average tenant stay here, and is there a school-zone premium baked into asking?
- Crime grade is D in this area — have there been break-ins, vandalism, or insurance claims at this property in the last 3 years? What carrier currently insures it and at what premium?
- What's the average days-on-market for RENTAL listings here right now (not sales)? A rising rental-DOM trend means longer vacancies and softer asking-rent achievability than the comps imply.
- What's the recent tenant-quality profile in this submarket — average credit score on applications, eviction rate, late-payment / NSF rate, and stable-employment percentage? A property-management company in the area should have these aggregated.
- How much new apartment / multifamily construction is in the pipeline within 1–3 miles? Heavy new supply (>2% of stock underway) typically softens rents 12–24 months out; light construction supports rent growth.
Investment metrics
- 1% rule
- 0.92% ✗
- Cap rate
- 7.38%
- Cash-on-cash
- 3.88%
- DSCR
- 1.17
- GRM
- 9.0
CMA / ARV
- ARV (median comp)
- $582,978
- List price
- $457,950
- Delta
- -21.45%
- Verdict
- UNDERPRICED
- Comps
- 20 within 1.0 mi
Show comp detail 2 sales within ~0.75 mi
| Address | Dist | Beds/Ba | Sqft | Sold | Price | $/sf | Match |
|---|---|---|---|---|---|---|---|
| 308 W Marshall St | 0.13mi | 4/3.0 (-1) | 2,940 (+4%) | 2mo | $649,950 | $221 | 82 |
| 218 W Main St | 0.35mi | 4/2.0 (-1) | 2,494 (-12%) | 0mo | $575,000 | $231 | 54 |
Match score weights: distance 35% · size 25% · config 20% · recency 20%. Top-matched comps best support the ARV.
Projected returns pro-forma
-3.0% appreciation · 6.54% rent growth · sell at horizon
- IRR
- -6.6%
- Equity multiple
- 0.75×
- Total profit
- $-32,325
- Equity at exit
- $68,282
- IRR
- 6.7%
- Equity multiple
- 1.58×
- Total profit
- $74,184
- Equity at exit
- $39,595
Cash invested: $128,226 (down + closing). Projections, not guarantees.
Landlord ↔ Tenant lean methodology
- Overall (STATE)
- 55 Moderately Landlord-Leaning
- State Virginia
- 55 Moderately Landlord-Leaning · D+2
- County
- — inherits STATE
- City
- — inherits STATE
ZIP-level market 23220
- Rents YoY
- 6.5%
- Active inventory
- 170
- Price-to-rent
- 18.1×
Monthly cashflow live
- Estimated rent
- $4,219 high interval (Pro) →
- Mortgage (P&I)
- −$2,402
- Tax from tax record
- −$326 /mo · $3,912/yr
- Insurance
- −$191
- HOA
- −$0
- Vacancy / Maint / Mgmt
- −$886
- Net cashflow
- $415
Break-even live
2-unit breakdown (identical units grouped — click to expand)
| Units | Beds | Baths | Est. rent |
|---|---|---|---|
| 2× units | 3 | 1.5 | $4,218 |
| #1 | 3 | 1.5 | $2,109 |
| #2 | 3 | 1.5 | $2,109 |
| Total (2 units) | $4,219 | ||
UW: 25.0% down · 7.5% · 30yr · 1.5% tax · 5.0% vac · 8.0% maint · 8.0% mgmt
Financing live
Cash to close
- Down payment
- $114,488
- Closing costs
- $13,738
- Reserves months
- —
- Total cash needed
- —
Loan-product check · same deal, 3 products live
Conventional
25% down · 7.5% · 30yr
- Down + closing
- —
- Monthly P&I
- —
- Monthly cashflow
- —
- DSCR
- —
- Eligible?
- —
Personal DTI + credit; lowest rate.
DSCR
20% down · 8.5% · 30yr
- Down + closing
- —
- Monthly P&I
- —
- Monthly cashflow
- —
- DSCR
- —
- Eligible?
- —
No personal income docs; deal must DSCR.
Hard money
10% down · 12.0% · 12mo
- Down + closing
- —
- Monthly P&I
- —
- Monthly cashflow
- —
- DSCR
- —
- Eligible?
- —
Short-term bridge; refi at stabilization.
Rent comps 6 comps
| Address | Beds | Baths | Sqft | Rent | $/sqft | DOM | Units | Dist |
|---|---|---|---|---|---|---|---|---|
| 615 S Laurel St Richmond, VA | 4.0 | 3.0 | 2110 | $3,500 | $1.66 | 23d | 1 | 0.91mi |
| 1260 Parkwood Ave Richmond, VA | 6.0 | 3.0 | 2180 | $4,800 | $2.20 | 23d | 1 | 0.92mi |
| 2053 W Moore St Richmond, VA | 5.0 | 5.5 | 2640 | $4,200 | $1.59 | 43d | 1 | 1.24mi |
| 1616 Kemper St Richmond, VA | 5.0 | 3.5 | 3176 | $3,400 | $1.07 | 43d | 1 | 1.28mi |
| 2034 W Grace St Unit A Richmond, VA | 4.0 | 2.0 | 2450 | $2,950 | $1.20 | 43d | 1 | 1.29mi |
| 2034 W Grace St Unit B Richmond, VA | 4.0 | 2.0 | 2500 | $3,200 | $1.28 | 43d | 1 | 1.29mi |
Listing history 12 events
-
2026-05-02historical $457,950 921-char remark
-
2006-03-03soldstatus $238,000 50-char remark
Show marketing remark (50 chars)
2 bedroom apartment in rear, last rent for $550/mo
-
2006-03-03soldstatus $238,000
Show marketing remark (50 chars)
2 bedroom apartment in rear, last rent for $550/mo
-
2006-03-03soldstatus $238,000
Show marketing remark (50 chars)
2 bedroom apartment in rear, last rent for $550/mo
-
2005-09-30historical
-
2005-09-30historical
-
2005-09-15$265,500
-
2005-09-15$265,500
-
2005-09-06$259,500 50-char remark
Show marketing remark (50 chars)
2 bedroom apartment in rear, last rent for $550/mo
-
2005-09-06$259,500
Show marketing remark (50 chars)
2 bedroom apartment in rear, last rent for $550/mo
-
1998-04-13soldstatus $73,000
-
1997-03-06soldstatus $120,000
ⓘ Source: listings_history table (triggers on properties + properties_extension) + one-shot
backfill from property_details.listing_events for pre-trigger history.
Tax reassessment forecast VA · Resets to sale price
- Current annual tax
- $3,912 · $326/mo
- Projected year-2 tax
- $3,912 · $326/mo
- Expected delta
- $0/yr ($0/mo · 0.0%)
ⓘ Screening estimate from a state-policy table — verify with the county assessor before closing.
Climate risk First Street
- Flood 1/10 Low FEMA zone X (unshaded) · 0% chance over 30 yrs
- Wildfire 1/10 Low
- Heat 8/10 Severe 7 d/yr ≥105°F today · 16 d/yr by 30 yrs out
- Wind 6/10 Major 27% chance of damaging wind over 30 yrs
- Air quality 2/10 Low 1 unhealthy d/yr today · 2 by 30 yrs out
Nearby sold comps map
Loading sold comps map…
Walkable amenities ~0.75 mi
Loading nearby amenities…
Taxation est. · year 1
- Rental income
- $50,628
- − Mortgage interest
- −$25,652
- − Property taxes
- −$3,912
- − Insurance
- −$2,290
- − Repairs & maintenance
- −$4,050
- − Management
- −$4,050
- − Depreciation
- −$13,322
- Taxable loss
- −$2,649
- Est. tax savings @ 24.0%
- +$636
- After-tax cash flow
- $5,612/yr
For passive investors: Depreciation is non-cash, so a rental often shows a tax loss while cash-flowing — sheltering income. Rental losses are passive: they offset passive income freely, and up to $25,000/yr can offset ordinary (W-2) income if you actively participate and your MAGI is under $100k (phasing out to $0 by $150k); unused losses carry forward. On sale, claimed depreciation is recaptured at up to 25%, and gains may owe capital-gains tax (a 1031 exchange can defer both). Figures are a year-1 estimate at your 24.0% rate — not tax advice; consult a CPA.
Schools (NCES district)
- District
- Richmond City Public School District
- NCES district ID
- 5103240
- Math proficiency
- 32% ▼ -24.00%
- Reading proficiency
- 47% ▼ -9.00%
- Median HH income
- $40,276
- Composite
- 33.09/100
- National rank
- #5564
- State rank
- #123 of 131 in VA
Livability — Richmond
- Score
- 84/100
- State rank
- #33
- US rank
- #793
Category grades
Schools grade is shown separately in the Schools card above.
Census & demographics
- Census place
- Richmond, VA
- County
- Richmond City · 178,280 people
- City population
- 287,109
- Metro
- Richmond, VA
- Population (ZIP)
- 34,671
- Household income
- $61,381
- Rent vs Own
- Severe rent burden
- 2962.0
Population outlook (Richmond County) Hauer SSP2
- Today (2025)
- 262,263 people
- By 2030
- 284,503 · +8.5%
- By 2040
- 327,353 · +24.8%
- By 2050
- 367,946 · +40.3%
- By 2075
- 449,560 · +71.4%
- By 2100
- 500,301 · +90.8%
Race, ethnicity, and origin ACS 2023
- Neighborhood character
- Diverse neighborhood (Simpson 0.60)
- Race & ethnicity
- White 54% Black 31% Two or more races 7% Hispanic / Latino 6% Asian 4%
- Hispanic origin (detail)
- Mexican 1%
- Common ancestry
- Slovak 2% Romanian 2% Italian 2%
- Foreign-born
- 6% · Canada, China
- Languages at home
- 91% English-only · Spanish 4% Other Indo-European 1% Chinese 1%
Political lean MEDSL · Richmond
- 2024 margin
- Solid D (+66.3) · D 82.0% · R 15.8% · Other 2.2%
- 2008→2024 swing
- +7.2pp toward D · 2008: 59.1pp · 2024: 66.3pp
- All cycles
- 2024: D+66.3 2020: D+68.0 2016: D+63.8 2012: D+55.7 2008: D+59.1
Not yet ingested
- Civics
- —
Market trends
- HPI YoY
- ▼ -772.63%
- Current HPI
- 348.5085
- Rent YoY
- ▲ 6.54%
- Metro
- Richmond, VA
- State GDP YoY
- ▲ 2.40%
- F500 in state
- 50
Industry mix (Fortune 500 HQ in VA)
| Industry | F500 HQs | Revenue |
|---|---|---|
| Aerospace / Defense | 4 | $236B |
|
||
| Technology / Defense | 3 | $32B |
|
||
| Financial Services | 2 | $176B |
|
||
| Utilities | 2 | $27B |
|
||
| Insurance | 2 | $25B |
|
||
| Technology | 2 | $15B |
|
||
Price history
+281.6% since first listed14 events — show timeline
- 2026-05-28 Pending — CVRMLS
- 2026-05-21 Listed $457,950 CVRMLS
- 2026-05-02 Coming Soon $457,950 CVRMLS
- 2006-03-03 Sold (Public Records) $238,000 Public Records
- 2006-03-03 Sold (MLS) $238,000 CVRMLS
- 2006-03-03 Sold (MLS) $238,000 CVRMLS
- 2005-09-30 Listing Removed — CVRMLS
- 2005-09-30 Listing Removed — CVRMLS
- 2005-09-15 Listed $265,500 CVRMLS
- 2005-09-15 Listed $265,500 CVRMLS
- 2005-09-06 Listed $259,500 CVRMLS
- 2005-09-06 Listed $259,500 CVRMLS
- 1998-04-13 Sold (Public Records) $73,000 Public Records
- 1997-03-06 Sold (Public Records) $120,000 Public Records
Property tax history
+3.9%/yrLatest (2022): $3,912 · +26.4% YoY. Source: county tax records.
Cash-flow waterfall
monthlySold comps — $/sqft
last 12 mo · ≤1 miLoading sold comps…