108 Riverview Dr · St. Rose, LA
Flood risk 5/10 · Moderate
- FEMA flood zone
- X (shaded)
- Chance of flooding over 30 yrs
- 0.23%
- Est. flood insurance / yr
- $507 – $1,088
Fire risk 1/10 · Minimal
- Est. fire insurance / yr
- $1,269 – $2,357
Heat risk 9/10 · Severe
- Hot days now (above 108°F)
- 7 days/yr
- Hot days in 30 yrs
- 21 days/yr
Wind risk 9/10 · Severe
- Chance of severe wind over 30 yrs
- 99.0%
Air-quality risk 3/10 · Minor
- Unhealthy air days now
- 2 days/yr
- Unhealthy air days in 30 yrs
- 3 days/yr
Risk factors via First Street. Map © Google.
Why this score? — see what drove the C+ grade
The composite is a weighted blend of 9 inputs, each scored 0–100. Each bar is that input's sub-score; the figure is the points it added to the 100-point composite (weight × sub-score).
- Cash flow +23.0/30.0
- ARV discount +15.0/15.0
- DSCR +7.4/10.0
- 1% rule +5.5/10.0
- Schools +4.0/10.0
- Rent growth +2.5/5.0
- Livability +2.5/5.0
- Condition / age +2.5/5.0
- Appreciation +0.0/10.0
$185,000
🖨 Deal sheet 📄 Offer letter ✓ Due diligence
Listing remarks MLS
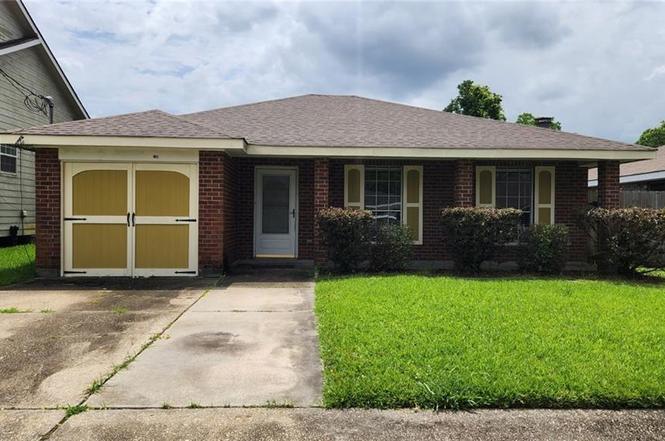
All-brick home with a wonderful open floor plan and great potential! The spacious living room features vaulted ceilings and a cozy wood-burning fireplace, while the large kitchen opens through sliding glass doors to a covered patio, perfect for entertaining. This home could use some updating but offers solid bones and an excellent opportunity for buyers looking to add their personal touches and build equity. Never flooded and located in a preferred X flood zone. Living square footage does not include enclosed garage area.
Key facts
- Open floor plan
- Covered patio
- Parking
Tags
Property features AI
Exterior
- Parking: Driveway
- Utilities: Public water; Public sewer
- Home design: One-story brick home; Slab foundation; Asphalt shingle roof
- Construction: Built with brick construction
- Exterior features: Fenced yard; Covered porch/patio; Shed(s) on the property; City lot with rectangular shape (50 x 100)
Interior
- Bathrooms: 2 full bathrooms
- Heating & cooling: Central heating; Central air conditioning
- Interior features: Wood-burning fireplace; Total of 5 rooms; Average condition
Neighborhood map
What this means for you Summary
Snapshot
- This is a 3-bed/2.0-bath single-family listed at $185k.
Deal economics
- At list price, monthly cash flow is $330 ($4k/yr) — positive.
- The deal already cash-flows at list — no discount required.
- Meets the 1% rule at list price ($2k rent vs $185k).
Location & tenants
- Location reads: area grade C — affects rentability + tenant quality, not the cash-flow math above.
- St. Charles Parish (suburban): math 40% / reading 51% proficiency, ranked #14 of 98 in LA (top 14%) — families likely to look elsewhere, expect single-tenant / working-renter base with shorter leases.
- Market conditions: 20 active listings in the ZIP; 1 comparable units currently listed for rent nearby; 74 units permitted in St. Charles Parish in 2024 (0 in 5+ unit buildings).
Forward outlook
- Local home prices are declining (-3.0%/yr); year-one equity from $1k of loan paydown is wiped out by about $6k of value loss. Plan a longer hold.
- St. Charles County population projected to shrink 7% by 2050 — rents likely to lag national; underwrite the cash flow, not the appreciation.
Negotiation context
- Only 3 days on market — expect competitive offers; lowballing is unlikely to land.
- 11 sale attempts since 26y ago with the ask held roughly flat each time — persistent listings suggest the price (not the market) is what's stuck; bring a comps-based counter.
Risks & watch-outs
- Climate carrying-cost: moderate flood risk; severe wind risk, 99% chance of damaging wind over 30y; extreme-heat days projected 7→21/yr by 2055 (HVAC capex compounding) — expect insurance premiums to compound above CPI over the hold.
Questions for the listing agent
- Is there a deadline driving the sale (1031 exchange, divorce, estate, relocation)? That informs how much negotiation room exists.
- What's the average days-on-market for RENTAL listings here right now (not sales)? A rising rental-DOM trend means longer vacancies and softer asking-rent achievability than the comps imply.
- What's the recent tenant-quality profile in this submarket — average credit score on applications, eviction rate, late-payment / NSF rate, and stable-employment percentage? A property-management company in the area should have these aggregated.
- How much new for-sale + rental construction is in the pipeline within 1–3 miles? Heavy new supply typically softens prices + rents 12–24 months out; constrained supply supports both.
Investment metrics
- 1% rule
- 1.05% ✓
- Cap rate
- 8.43%
- Cash-on-cash
- 7.64%
- DSCR
- 1.34
- GRM
- 7.9
CMA / ARV
- ARV (on-the-fly)
- $232,286
- Comps found
- 7
Show comp detail 7 sales within ~0.75 mi
| Address | Dist | Beds/Ba | Sqft | Sold | Price | $/sf | Match |
|---|---|---|---|---|---|---|---|
| 139 Riverview Dr | 0.15mi | 3/2.0 | 1,552 (-2%) | 8mo | $205,000 | $132 | 82 |
| 115 Riverview Dr | 0.04mi | 3/2.0 | 1,715 (+8%) | 20mo | $179,000 | $104 | 68 |
| 14 Pinto Ln | 0.46mi | 3/2.5 | 1,796 (+13%) | 3mo | $262,000 | $146 | 53 |
| 240 Dianne Dr | 0.72mi | 3/2.0 | 1,520 (-4%) | 22mo | $205,000 | $135 | 40 |
| 266 Dianne Dr | 0.74mi | 4/2.0 (+1) | 1,406 (-12%) | 7mo | $225,000 | $160 | 35 |
| 153 Janet Dr | 0.68mi | 3/2.0 | 1,373 (-14%) | 14mo | $250,000 | $182 | 34 |
| 227 Janet Dr | 0.69mi | 3/2.0 | 1,434 (-10%) | 22mo | $245,000 | $171 | 33 |
Match score weights: distance 35% · size 25% · config 20% · recency 20%. Top-matched comps best support the ARV.
Projected returns pro-forma
-3.0% appreciation · 3.0% rent growth · sell at horizon
- IRR
- -4.6%
- Equity multiple
- 0.83×
- Total profit
- $-8,990
- Equity at exit
- $27,584
- IRR
- 5.0%
- Equity multiple
- 1.37×
- Total profit
- $19,164
- Equity at exit
- $15,995
Cash invested: $51,800 (down + closing). Projections, not guarantees.
Landlord ↔ Tenant lean methodology
- Overall (STATE)
- 90 Strongly Landlord-Friendly
- State Louisiana
- 90 Strongly Landlord-Friendly · R+12
- County
- — inherits STATE
- City
- — inherits STATE
ZIP-level market 70087
- Home prices YoY
- -11.0%
- Active inventory
- 20
- Price-to-rent
- 7.9×
Monthly cashflow live
- Estimated rent
- $1,950 medium interval (Pro) →
- Mortgage (P&I)
- −$970
- Tax from tax record
- −$164 /mo · $1,962/yr
- Insurance
- −$77
- HOA
- −$0
- Vacancy / Maint / Mgmt
- −$410
- Net cashflow
- $330
Break-even live
UW: 25.0% down · 7.5% · 30yr · 1.5% tax · 5.0% vac · 8.0% maint · 8.0% mgmt
Financing live
Cash to close
- Down payment
- $46,250
- Closing costs
- $5,550
- Reserves months
- —
- Total cash needed
- —
Loan-product check · same deal, 3 products live
Conventional
25% down · 7.5% · 30yr
- Down + closing
- —
- Monthly P&I
- —
- Monthly cashflow
- —
- DSCR
- —
- Eligible?
- —
Personal DTI + credit; lowest rate.
DSCR
20% down · 8.5% · 30yr
- Down + closing
- —
- Monthly P&I
- —
- Monthly cashflow
- —
- DSCR
- —
- Eligible?
- —
No personal income docs; deal must DSCR.
Hard money
10% down · 12.0% · 12mo
- Down + closing
- —
- Monthly P&I
- —
- Monthly cashflow
- —
- DSCR
- —
- Eligible?
- —
Short-term bridge; refi at stabilization.
Rent comps 1 comps
| Address | Beds | Baths | Sqft | Rent | $/sqft | DOM | Units | Dist |
|---|---|---|---|---|---|---|---|---|
| 511 Dell St Saint Rose, LA | 3.0 | 2.0 | 1220 | $1,950 | $1.60 | 17d | 1 | 1.48mi |
Listing history 4 events
-
2026-06-18days on market $185,000 Active 3 DOM
-
2026-06-17days on market $185,000 Active 2 DOM
-
2026-06-16remarks 527-char remark
-
2026-06-16$185,000 Active 1 DOM
ⓘ Source: listings_history table (triggers on properties + properties_extension) + one-shot
backfill from property_details.listing_events for pre-trigger history.
Tax reassessment forecast LA · Resets to sale price
- Current annual tax
- $1,962 · $164/mo
- Projected year-2 tax
- $1,962 · $164/mo
- Expected delta
- $0/yr ($0/mo · -0.0%)
ⓘ Screening estimate from a state-policy table — verify with the county assessor before closing.
Climate risk First Street
- Flood 5/10 Major FEMA zone X (shaded) · 23% chance over 30 yrs
- Wildfire 1/10 Low
- Heat 9/10 Extreme 7 d/yr ≥108°F today · 21 d/yr by 30 yrs out
- Wind 9/10 Extreme 99% chance of damaging wind over 30 yrs
- Air quality 3/10 Moderate 2 unhealthy d/yr today · 3 by 30 yrs out
Nearby sold comps map
Loading sold comps map…
Walkable amenities ~0.75 mi
Loading nearby amenities…
Taxation est. · year 1
- Rental income
- $23,400
- − Mortgage interest
- −$10,363
- − Property taxes
- −$1,962
- − Insurance
- −$925
- − Repairs & maintenance
- −$1,872
- − Management
- −$1,872
- − Depreciation
- −$5,382
- Taxable income
- $1,024
- Est. tax owed @ 24.0%
- −$246
- After-tax cash flow
- $3,711/yr
For passive investors: Depreciation is non-cash, so a rental often shows a tax loss while cash-flowing — sheltering income. Rental losses are passive: they offset passive income freely, and up to $25,000/yr can offset ordinary (W-2) income if you actively participate and your MAGI is under $100k (phasing out to $0 by $150k); unused losses carry forward. On sale, claimed depreciation is recaptured at up to 25%, and gains may owe capital-gains tax (a 1031 exchange can defer both). Figures are a year-1 estimate at your 24.0% rate — not tax advice; consult a CPA.
Schools (NCES district)
- District
- St. Charles Parish
- NCES district ID
- 2201440
- Math proficiency
- 40% ▼ -38.00%
- Reading proficiency
- 51% ▼ -32.00%
- Median HH income
- $60,261
- Composite
- 40.0/100
- National rank
- #3830
- State rank
- #14 of 98 in LA
Livability — St. Rose
No livability data for this city. (Only ~50 U.S. cities are tracked.)
Census & demographics
- Census place
- St. Rose, LA
- Population (ZIP)
- 6,939
Population outlook (St. Charles County) Hauer SSP2
- Today (2025)
- 53,296 people
- By 2030
- 53,030 · -0.5%
- By 2040
- 51,646 · -3.1%
- By 2050
- 49,771 · -6.6%
- By 2075
- 46,993 · -11.8%
- By 2100
- 44,473 · -16.6%
Race, ethnicity, and origin ACS 2023
- Neighborhood character
- Diverse neighborhood (Simpson 0.66)
- Race & ethnicity
- Black 43% White 35% Hispanic / Latino 18% Two or more races 5%
- Hispanic origin (detail)
- Common ancestry
- Lithuanian 9% Italian 1%
- Foreign-born
- 11% · Canada
- Languages at home
- 82% English-only · Spanish 17% Other Asian/Pacific 1%
Political lean MEDSL · St. Charles
- 2024 margin
- Solid R (+32.4) · D 33.0% · R 65.4% · Other 1.6%
- 2008→2024 swing
- -1.1pp toward R · 2008: -31.2pp · 2024: -32.4pp
- All cycles
- 2024: R+32.4 2020: R+29.6 2016: R+30.8 2012: R+27.8 2008: R+31.2
Not yet ingested
- Civics
- —
Market trends
- HPI YoY
- ▼ -27.55%
- Current HPI
- 222.4641
- Rent YoY
- —
- Metro
- —
- State GDP YoY
- ▲ 3.29%
- F500 in state
- 10
Industry mix (Fortune 500 HQ in LA)
| Industry | F500 HQs | Revenue |
|---|---|---|
| Telecommunications | 2 | $23B |
|
||
| Utilities | 1 | $12B |
|
||
| Wholesale / Distribution | 1 | $5B |
|
||
| Advertising | 1 | $2B |
|
||
Price history
+115.1% since first listed22 events — show timeline
- 2026-06-15 Listed $185,000 AcadianaMLS
- 2026-06-15 Listed $185,000 GSREIN
- 2018-04-10 Sold (Public Records) $162,500 Public Records
- 2018-03-28 Sold (MLS) $162,500 GSREIN
- 2018-02-27 Pending — GSREIN
- 2018-02-24 Price Changed $168,500 GSREIN
- 2018-02-24 Price Changed $169,500 GSREIN
- 2018-02-11 Relisted — GSREIN
- 2018-02-10 Contingent — GSREIN
- 2018-01-28 Listed $168,500 AcadianaMLS
- 2018-01-28 Listed $172,500 GSREIN
- 2008-10-01 Sold (Public Records) $162,000 Public Records
- 2008-09-26 Sold (MLS) $162,000 GSREIN
- 2008-07-13 Listed $164,900 GSREIN
- 2008-07-13 Listed $164,900 AcadianaMLS
- 2006-12-27 Sold (Public Records) $150,000 Public Records
- 2006-12-20 Sold (MLS) $150,000 GSREIN
- 2006-08-29 Listed $154,900 AcadianaMLS
- 2006-08-29 Listed $154,900 GSREIN
- 2000-12-07 Sold (MLS) $86,000 GSREIN
- 2000-08-31 Listed $86,000 GSREIN
- 2000-08-31 Listed $86,000 AcadianaMLS
Property tax history
+3.0%/yrLatest (2024): $1,962 · +21.3% YoY. Source: county tax records.
Cash-flow waterfall
monthlySold comps — $/sqft
last 12 mo · ≤1 miLoading sold comps…