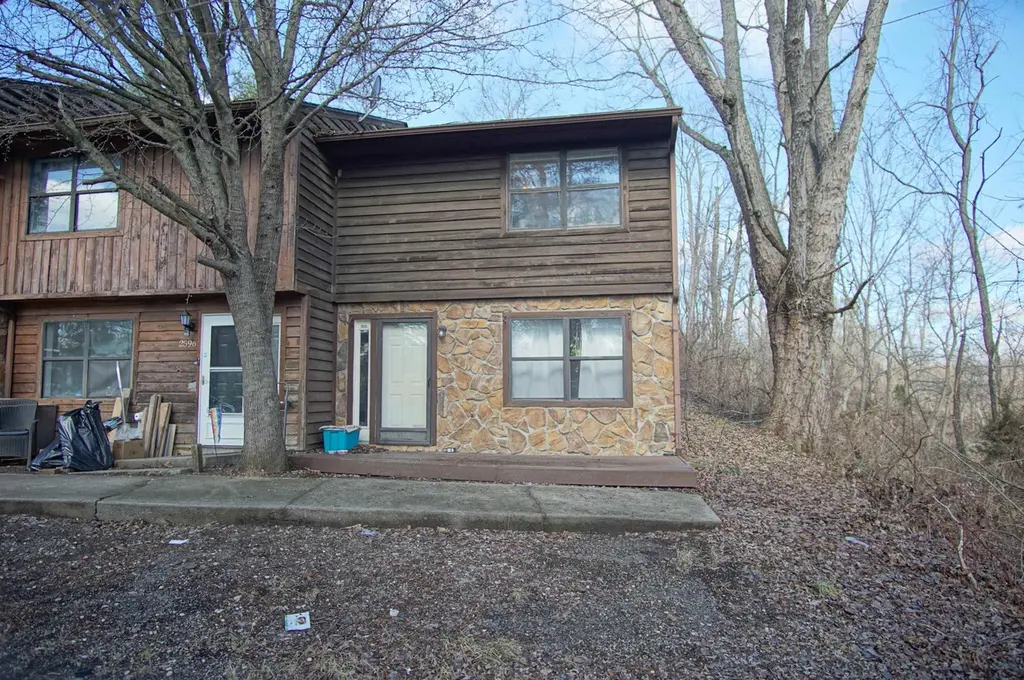
2598 Townhouse Dr · Christiansburg, VA
Flood risk 1/10 · Minimal
- FEMA flood zone
- X (unshaded)
- Chance of flooding over 30 yrs
- 0.0%
- Est. flood insurance / yr
- $507 – $1,088
Fire risk 4/10 · Minor
- Est. fire insurance / yr
- $666 – $1,236
Heat risk 3/10 · Minor
- Hot days now (above 95°F)
- 7 days/yr
- Hot days in 30 yrs
- 19 days/yr
Wind risk 2/10 · Minimal
- Chance of severe wind over 30 yrs
- 1.0%
Air-quality risk 1/10 · Minimal
- Unhealthy air days now
- 0 days/yr
- Unhealthy air days in 30 yrs
- 0 days/yr
Risk factors via First Street. Map © Google.
Why this score? — see what drove the D grade
The composite is a weighted blend of 9 inputs, each scored 0–100. Each bar is that input's sub-score; the figure is the points it added to the 100-point composite (weight × sub-score).
- Cash flow +15.6/30.0
- Schools +5.4/10.0
- DSCR +4.8/10.0
- Livability +4.0/5.0
- ARV discount +3.3/15.0
- 1% rule +3.2/10.0
- Rent growth +2.8/5.0
- Condition / age +2.5/5.0
- Appreciation +0.0/10.0
$189,000
🖨 Deal sheet (PDF) 📄 Offer letter ✓ Due diligence
Listing remarks MLS
Affordable end unit in great condition convenient to I81, shopping, and schools. This end unit offers privacy and convenience. Will make a great first time home or investment property with a solid rental history. 2 car carport with the property.
Key facts
- Great condition
- End unit
- Solid rental history
Tags
Neighborhood map
What this means for you Summary
Snapshot
- This is a 2-bed/2.5-bath townhouse listed at $189k.
Deal economics
- At list price, monthly cash flow is $78 ($936/yr) — positive.
- The deal already cash-flows at list — no discount required.
- To meet the 1% rule (rent ≥ 1% of price), the offer needs to be $154k (18.3% below list).
- Recommended offer: $154k (18.3% below list) — sets the bar for 1% rule.
- Cap rate 6.8% vs local median 3.9% in Christiansburg — top-decile yield for the area; either an underpriced asset or a hidden risk that comps aren't pricing in. Stress-test before assuming the spread holds.
Location & tenants
- Location reads 81/100 on livability (#53 in VA, #1,452 nationally) — a professional / high-income tenant draw. Strengths: cost of living A+, housing A+, commute A-; Watch: amenities F.
- Montgomery County Public School District (urban): math 57% / reading 70% proficiency, ranked #47 of 131 in VA (top 36%) — acceptable for families but not a draw, mixed tenant base, ~2y average lease.
- Zoned schools: Falling Branch Elementary (math 56% / reading 68%, grade B, #480 of 1,108 statewide, top 46%, 576 students, 52% FRL); Christiansburg Middle (math 38% / reading 63%, grade C, #226 of 342 statewide, top 67%, 752 students, 44% FRL); Christiansburg High (math 79% / reading 77%, grade A-, #80 of 319 statewide, top 25%, 1,116 students, 41% FRL).
- Market conditions: Rents rising (+1.1%/yr); 250 active listings in the ZIP; solid renter incomes; 323 units permitted in Montgomery County in 2024 (0 in 5+ unit buildings).
Forward outlook
- Local home prices are declining (-3.0%/yr); year-one equity from $1k of loan paydown is wiped out by about $6k of value loss. Plan a longer hold.
- Montgomery County population projected at +13% by 2050 — modest demand growth; plan on rents tracking national, not racing it.
Negotiation context
- It's been on market 108 days — a 9% lower offer ($172k) is reasonable based on typical stale-listing flexibility.
- 2 sale attempts since 8y ago with the ask held roughly flat each time — persistent listings suggest the price (not the market) is what's stuck; bring a comps-based counter.
- Current owner paid $107k; list at $189k implies a 77% gain — meaningful room to come down on a strong offer.
Questions for the listing agent
- It's been on market 108 days. Have you received any prior offers? Is the seller open to a 18% concession, seller financing, or rate buy-down credit?
- Why hasn't it sold? Are there any deal-killer items the seller is aware of (foundation, flood, title, zoning, code violations)?
- Is there a deadline driving the sale (1031 exchange, divorce, estate, relocation)? That informs how much negotiation room exists.
- Schools are A-rated — typically a magnet for longer-tenancy family renters. What's the average tenant stay here, and is there a school-zone premium baked into asking?
- The area grade is low — what's the realistic commute time and amenity access for the typical tenant pool here? Any planned neighborhood developments (good or bad) we should know about?
- What's the average days-on-market for RENTAL listings here right now (not sales)? A rising rental-DOM trend means longer vacancies and softer asking-rent achievability than the comps imply.
- What's the recent tenant-quality profile in this submarket — average credit score on applications, eviction rate, late-payment / NSF rate, and stable-employment percentage? A property-management company in the area should have these aggregated.
- How much new for-sale + rental construction is in the pipeline within 1–3 miles? Heavy new supply typically softens prices + rents 12–24 months out; constrained supply supports both.
Investment metrics
- 1% rule
- 0.82% ✗
- Cap rate
- 6.79%
- Cash-on-cash
- 1.77%
- DSCR
- 1.08
- GRM
- 10.2
CMA / ARV
- ARV (median comp)
- $172,820
- List price
- $189,000
- Delta
- 9.36%
- Verdict
- FAIR
- Comps
- 8 within 1.0 mi
Show comp detail 5 sales within ~0.75 mi
| Address | Dist | Beds/Ba | Sqft | Sold | Price | $/sf | Match |
|---|---|---|---|---|---|---|---|
| 2602 Glade Dr | 0.04mi | 2/2.5 | 1,080 (0%) | 4mo | $170,000 | $157 | 95 |
| 2596 Glade Dr SE | 0.04mi | 2/2.5 | 1,080 (0%) | 8mo | $170,000 | $157 | 92 |
| 2594 Townhouse St | 0.01mi | 2/2.5 | 1,062 (-2%) | 10mo | $180,000 | $169 | 88 |
| 2576 Townhouse St | 0.05mi | 2/2.5 | 1,033 (-4%) | 10mo | $170,000 | $165 | 82 |
| 2665 Glade Dr SE | 0.10mi | 2/2.5 | 1,166 (+8%) | 6mo | $210,000 | $180 | 78 |
Match score weights: distance 35% · size 25% · config 20% · recency 20%. Top-matched comps best support the ARV.
Projected returns pro-forma
-3.0% appreciation · 1.05% rent growth · sell at horizon
- IRR
- -15.5%
- Equity multiple
- 0.46×
- Total profit
- $-28,707
- Equity at exit
- $28,181
- IRR
- -10.3%
- Equity multiple
- 0.42×
- Total profit
- $-30,644
- Equity at exit
- $16,341
Cash invested: $52,920 (down + closing). Projections, not guarantees.
Landlord ↔ Tenant lean methodology
- Overall (STATE)
- 55 Moderately Landlord-Leaning
- State Virginia
- 55 Moderately Landlord-Leaning · D+2
- County
- — inherits STATE
- City
- — inherits STATE
ZIP-level market 24073
- Home prices YoY
- -26.2%
- Rents YoY
- 1.1%
- Active inventory
- 250
- Price-to-rent
- 10.2×
Monthly cashflow live
- Estimated rent
- $1,545 medium interval (Pro) →
- Mortgage (P&I)
- −$991
- Tax from tax record
- −$72 /mo · $867/yr
- Insurance
- −$79
- HOA
- −$0
- Vacancy / Maint / Mgmt
- −$324
- Net cashflow
- $78
Break-even live
Sensitivity live
| Price | -10% $185 | -5% $132 | +0% $78 | +5% $25 | +10% $-29 |
|---|---|---|---|---|---|
| Rent | -10% $-44 | -5% $17 | +0% $78 | +5% $139 | +10% $200 |
| Rate | -1.0pp $173 | -0.5pp $126 | base $78 | +0.5pp $29 | +1.0pp $-21 |
UW: 25.0% down · 7.5% · 30yr · 1.5% tax · 5.0% vac · 8.0% maint · 8.0% mgmt
Financing live
Cash to close
- Down payment
- $47,250
- Closing costs
- $5,670
- Reserves months
- —
- Total cash needed
- —
Loan-product check · same deal, 3 products live
Conventional
25% down · 7.5% · 30yr
- Down + closing
- —
- Monthly P&I
- —
- Monthly cashflow
- —
- DSCR
- —
- Eligible?
- —
Personal DTI + credit; lowest rate.
DSCR
20% down · 8.5% · 30yr
- Down + closing
- —
- Monthly P&I
- —
- Monthly cashflow
- —
- DSCR
- —
- Eligible?
- —
No personal income docs; deal must DSCR.
Hard money
10% down · 12.0% · 12mo
- Down + closing
- —
- Monthly P&I
- —
- Monthly cashflow
- —
- DSCR
- —
- Eligible?
- —
Short-term bridge; refi at stabilization.
Listing history 28 events
-
2026-06-21days on market $189,000 Active 108 DOM
-
2026-06-19days on market $189,000 Active 106 DOM
-
2026-06-18days on market $189,000 Active 105 DOM
-
2026-06-17days on market $189,000 Active 104 DOM
-
2026-06-16days on market $189,000 Active 103 DOM
-
2026-06-15days on market $189,000 Active 102 DOM
-
2026-06-14days on market $189,000 Active 100 DOM
-
2026-06-13days on market $189,000 Active 99 DOM
-
2026-06-10days on market $189,000 Active 97 DOM
-
2026-06-09days on market $189,000 Active 96 DOM
-
2026-06-08days on market $189,000 Active 95 DOM
-
2026-06-07days on market $189,000 Active 94 DOM
-
2026-06-05days on market $189,000 Active 91 DOM
-
2026-06-03days on market $189,000 Active 90 DOM
-
2026-06-02days on market $189,000 Active 89 DOM
-
2026-06-01days on market $189,000 Active 88 DOM
-
2026-05-31days on market $189,000 Active 87 DOM
-
2026-05-30days on market $189,000 Active 86 DOM
-
2026-05-08price $189,000 245-char remark
Show marketing remark (245 chars)
Affordable end unit in great condition convenient to I81, shopping, and schools. This end unit offers privacy and convenience. Will make a great first time home or investment property with a solid rental history. 2 car carport with the property.
-
2026-03-05$195,000 Active 245-char remark
Show marketing remark (245 chars)
Affordable end unit in great condition convenient to I81, shopping, and schools. This end unit offers privacy and convenience. Will make a great first time home or investment property with a solid rental history. 2 car carport with the property.
-
2019-03-18soldstatus $107,000
-
2019-03-15soldstatus $107,000 264-char remark
Show marketing remark (264 chars)
TOTALLY REMODELED TOWNHOUSE. NEW KITCHEN WITH ALL NEW APPLIANCES, INCLUDING REFRIGERATOR, DISHWASHER, RANGE OVEN. ETC. NEW FLOORS THROUGHOUT. PERFECT FOR THE FIRST TIME HOME BUYER OR INVESTOR LOOKING TO BEGIN THEIR PORTFOLIO. ONLY UNIT WITH CARPORT. MOVE IN READY.
-
2018-12-18$112,000 264-char remark
Show marketing remark (264 chars)
TOTALLY REMODELED TOWNHOUSE. NEW KITCHEN WITH ALL NEW APPLIANCES, INCLUDING REFRIGERATOR, DISHWASHER, RANGE OVEN. ETC. NEW FLOORS THROUGHOUT. PERFECT FOR THE FIRST TIME HOME BUYER OR INVESTOR LOOKING TO BEGIN THEIR PORTFOLIO. ONLY UNIT WITH CARPORT. MOVE IN READY.
-
2018-06-13soldstatus $67,000
-
2018-01-19soldstatus $43,846
-
2004-08-20soldstatus $86,000
-
2000-10-15soldstatus $66,000
-
2000-10-15soldstatus $66,000
ⓘ Source: listings_history table (triggers on properties + properties_extension) + one-shot
backfill from property_details.listing_events for pre-trigger history.
Tax reassessment forecast VA · Resets to sale price
- Current annual tax
- $867 · $72/mo
- Projected year-2 tax
- $1,550 · $129/mo
- Expected delta
- +$683/yr (+$57/mo · 78.7%)
ⓘ Screening estimate from a state-policy table — verify with the county assessor before closing.
Climate risk First Street
- Flood 1/10 Low FEMA zone X (unshaded) · 0% chance over 30 yrs
- Wildfire 4/10 Moderate
- Heat 3/10 Moderate 7 d/yr ≥95°F today · 19 d/yr by 30 yrs out
- Wind 2/10 Low 100% chance of damaging wind over 30 yrs
- Air quality 1/10 Low 0 unhealthy d/yr today · 0 by 30 yrs out
Nearby sold comps map
Loading sold comps map…
Walkable amenities ~0.75 mi
Loading nearby amenities…
Taxation est. · year 1
- Rental income
- $18,534
- − Mortgage interest
- −$10,587
- − Property taxes
- −$867
- − Insurance
- −$945
- − Repairs & maintenance
- −$1,483
- − Management
- −$1,483
- − Depreciation
- −$5,498
- Taxable loss
- −$2,329
- Est. tax savings @ 24.0%
- +$559
- After-tax cash flow
- $1,495/yr
For passive investors: Depreciation is non-cash, so a rental often shows a tax loss while cash-flowing — sheltering income. Rental losses are passive: they offset passive income freely, and up to $25,000/yr can offset ordinary (W-2) income if you actively participate and your MAGI is under $100k (phasing out to $0 by $150k); unused losses carry forward. On sale, claimed depreciation is recaptured at up to 25%, and gains may owe capital-gains tax (a 1031 exchange can defer both). Figures are a year-1 estimate at your 24.0% rate — not tax advice; consult a CPA.
Schools (NCES district)
- District
- Montgomery County Public School District
- NCES district ID
- 5102520
- Math proficiency
- 57% ▼ -29.00%
- Reading proficiency
- 70% ▼ -11.00%
- Median HH income
- $46,618
- Composite
- 53.6/100
- National rank
- #1440
- State rank
- #47 of 131 in VA
Livability — Christiansburg
- Score
- 81/100
- State rank
- #53
- US rank
- #1452
Category grades
Schools grade is shown separately in the Schools card above.
Census & demographics
- Census place
- Christiansburg, VA
- County
- Montgomery County · 78,218 people
- City population
- 29,677
- Metro
- Blacksburg-Christiansburg, VA
- Population (ZIP)
- 29,677
- Household income
- $76,800
- Rent vs Own
- Severe rent burden
- 861.0
Population outlook (Montgomery County) Hauer SSP2
- Today (2025)
- 105,748 people
- By 2030
- 110,301 · +4.3%
- By 2040
- 115,652 · +9.4%
- By 2050
- 119,651 · +13.1%
- By 2075
- 126,005 · +19.2%
- By 2100
- 129,771 · +22.7%
Race, ethnicity, and origin ACS 2023
- Neighborhood character
- Predominantly White (86%)
- Race & ethnicity
- White 86% Two or more races 5% Black 4% Hispanic / Latino 4% Asian 3%
- Common ancestry
- Italian 3% Slovak 3% Serbian 2%
- Foreign-born
- 5% · Canada, South Korea, Jamaica
- Languages at home
- 94% English-only · Spanish 3% Other Indo-European 2% Korean 1%
Political lean MEDSL · Montgomery
- 2024 margin
- Toss-up / Even · D 50.9% · R 47.4% · Other 1.7%
- 2008→2024 swing
- -1.4pp toward R · 2008: 4.9pp · 2024: 3.5pp
- All cycles
- 2024: D+3.5 2020: D+5.8 2016: D+1.3 2012: R+0.2 2008: D+4.9
Not yet ingested
- Civics
- —
Market trends
- HPI YoY
- ▼ -94.98%
- Current HPI
- 267.2504
- Rent YoY
- ▲ 1.05%
- Metro
- Blacksburg-Christiansburg, VA
- State GDP YoY
- ▲ 2.40%
- F500 in state
- 50
Industry mix (Fortune 500 HQ in VA)
| Industry | F500 HQs | Revenue |
|---|---|---|
| Aerospace / Defense | 4 | $236B |
|
||
| Technology / Defense | 3 | $32B |
|
||
| Financial Services | 2 | $176B |
|
||
| Utilities | 2 | $27B |
|
||
| Insurance | 2 | $25B |
|
||
| Technology | 2 | $15B |
|
||
Price history
+186.4% since first listed10 events — show timeline
- 2026-05-08 Price Changed $189,000 NRVMLS
- 2026-03-05 Listed $195,000 NRVMLS
- 2019-03-18 Sold (Public Records) $107,000 Public Records
- 2019-03-15 Sold (MLS) $107,000 NRVMLS
- 2018-12-18 Listed $112,000 NRVMLS
- 2018-06-13 Sold (Public Records) $67,000 Public Records
- 2018-01-19 Sold (Public Records) $43,846 Public Records
- 2004-08-20 Sold (Public Records) $86,000 Public Records
- 2000-10-15 Sold (Public Records) $66,000 Public Records
- 2000-10-15 Sold (Public Records) $66,000 Public Records
Property tax history
-0.3%/yrLatest (2025): $867 · +1.3% YoY. Source: county tax records.
Cash-flow waterfall
monthlySold comps — $/sqft
last 12 mo · ≤1 miLoading sold comps…