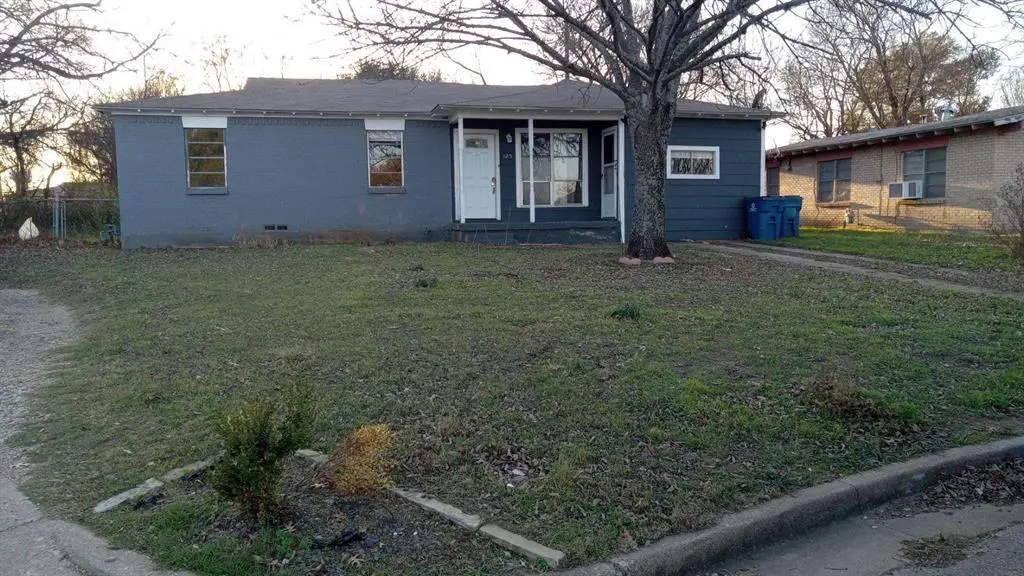
125 Crockett Dr · Hutchins, TX
Flood risk 1/10 · Minimal
- FEMA flood zone
- X (unshaded)
- Chance of flooding over 30 yrs
- 0.0%
- Est. flood insurance / yr
- $507 – $1,088
Fire risk 4/10 · Minor
- Est. fire insurance / yr
- $1,222 – $2,270
Heat risk 8/10 · Major
- Hot days now (above 110°F)
- 7 days/yr
- Hot days in 30 yrs
- 24 days/yr
Wind risk 6/10 · Moderate
- Chance of severe wind over 30 yrs
- 27.0%
Air-quality risk 2/10 · Minimal
- Unhealthy air days now
- 1 days/yr
- Unhealthy air days in 30 yrs
- 1 days/yr
Risk factors via First Street. Map © Google.
Why this score? — see what drove the B+ grade
The composite is a weighted blend of 9 inputs, each scored 0–100. Each bar is that input's sub-score; the figure is the points it added to the 100-point composite (weight × sub-score).
- Cash flow +26.4/30.0
- ARV discount +15.0/15.0
- DSCR +9.0/10.0
- 1% rule +8.7/10.0
- Appreciation +5.6/10.0
- Livability +3.0/5.0
- Schools +2.8/10.0
- Rent growth +2.5/5.0
- Condition / age +2.5/5.0
$164,900
🖨 Deal sheet (PDF) 📄 Offer letter ✓ Due diligence
Listing remarks MLS
Welcome to 125 CROCKETT DR. This 3-bedroom, 1-bath property is in the Hutchins Heights Subdivision. The subject is surrounded by new construction, and in fair condition with ample yard space. This property has unlimited potential – send this to your client immediately. Don’t walk, run, make an appointment to see this property.
Key facts
- New construction
- Ample yard space
- 9,191 sq ft lot
Tags
Neighborhood map
What this means for you Summary
Snapshot
- This is a 4-bed/1.0-bath single-family listed at $165k.
Deal economics
- At list price, monthly cash flow is $431 ($5k/yr) — positive.
- The deal already cash-flows at list — no discount required.
- Meets the 1% rule at list price ($2k rent vs $165k).
- Recommended offer: $155k (6.0% below list) — sets the bar for market timing.
- Cap rate 9.4% vs local median 3.8% in Hutchins — top-decile yield for the area; either an underpriced asset or a hidden risk that comps aren't pricing in. Stress-test before assuming the spread holds.
Location & tenants
- Location reads 60/100 on livability (#1,096 in TX) — a middle-class / working-renter tenant base. Strengths: cost of living A+, housing A; Watch: crime F, amenities F, employment F.
- Dallas ISD (urban): math 31% / reading 36% proficiency, ranked #559 of 826 in TX (top 68%) — families likely to look elsewhere, expect single-tenant / working-renter base with shorter leases; 83% free/reduced lunch — lower-income household profile, screen leases tightly.
- Zoned schools: Wilmer-Hutchins El (math 32% / reading 31%, grade F, #2,396 of 4,322 statewide, top 56%, 562 students, 94% FRL); Kennedy-Curry Middle (math 29% / reading 20%, grade F, #1,279 of 1,662 statewide, top 78%, 626 students, 100% FRL); Wilmer-Hutchins H S (math 14% / reading 29%, grade F, #1,377 of 1,632 statewide, top 85%, 1,020 students, 73% FRL).
- Market conditions: 85 active listings in the ZIP; 7 comparable units currently listed for rent nearby; rentals lingering (median 47d on market — plan ~5-8 weeks vacancy on turnover, expect pricing pressure); 71% of comp listings sitting > 30 days — soft ceiling on asking rent; 12,577 units permitted in Dallas County in 2024 (6,829 in 5+ unit buildings).
Forward outlook
- In year one you build about $3k of equity ($1k loan paydown + $2k appreciation (1.2% local appreciation)).
- Dallas County population projected at +35% by 2050 — long-run rental-demand tailwind backs the buy-and-hold thesis.
- At projected returns (1.2% appreciation + 3.0% rent growth), your $46k cash investment doubles in ~5 years — after that, you're playing with house money.
- By year 10, paydown + projected appreciation supports a ~$32k cash-out refi (75% LTV) — recoverable capital for the next deal without selling this one.
Negotiation context
- It's been on market 70 days — a 6% lower offer ($155k) is reasonable based on typical stale-listing flexibility.
- 5 sale attempts since 3y ago; this cycle's ask has dropped $15k (8%) from the opening price — seller is motivated, your offer sets the floor, not the list.
Risks & watch-outs
- Watch-outs: property tax is 3.0% of price; built in 1959 — expect roof / HVAC / electrical / plumbing capex.
- Climate carrying-cost: major wind risk, 27% chance of damaging wind over 30y; extreme-heat days projected 7→24/yr by 2055 (HVAC capex compounding) — expect insurance premiums to compound above CPI over the hold.
Questions for the listing agent
- It's been on market 70 days. Have you received any prior offers? Is the seller open to a 6% concession, seller financing, or rate buy-down credit?
- Built in 1959 — when were the roof, HVAC, electrical panel, plumbing, and water heater last replaced?
- Property tax is high relative to price — has the assessment been appealed recently, and will the sale trigger a re-assessment?
- Why hasn't it sold? Are there any deal-killer items the seller is aware of (foundation, flood, title, zoning, code violations)?
- Is there a deadline driving the sale (1031 exchange, divorce, estate, relocation)? That informs how much negotiation room exists.
- Schools are F-rated, which usually means shorter tenancies and higher turnover. Who's the typical renter profile here, and what's been the actual vacancy rate?
- Crime grade is F in this area — have there been break-ins, vandalism, or insurance claims at this property in the last 3 years? What carrier currently insures it and at what premium?
- What's the average days-on-market for RENTAL listings here right now (not sales)? A rising rental-DOM trend means longer vacancies and softer asking-rent achievability than the comps imply.
- What's the recent tenant-quality profile in this submarket — average credit score on applications, eviction rate, late-payment / NSF rate, and stable-employment percentage? A property-management company in the area should have these aggregated.
- How much new for-sale + rental construction is in the pipeline within 1–3 miles? Heavy new supply typically softens prices + rents 12–24 months out; constrained supply supports both.
Investment metrics
- 1% rule
- 1.37% ✓
- Cap rate
- 9.43%
- Cash-on-cash
- 11.19%
- DSCR
- 1.50
- GRM
- 6.1
CMA / ARV
- ARV (median comp)
- $299,232
- List price
- $164,900
- Delta
- -44.89%
- Verdict
- UNDERPRICED
- Comps
- 20 within 1.0 mi
Show comp detail 12 sales within ~0.75 mi
| Address | Dist | Beds/Ba | Sqft | Sold | Price | $/sf | Match |
|---|---|---|---|---|---|---|---|
| 328 Live Oak Ln | 0.48mi | 3/2.0 (-1) | 1,376 (+2%) | 2mo | $329,900 | $240 | 63 |
| 1008 Pecan Pl | 0.50mi | 3/2.0 (-1) | 1,376 (+2%) | 2mo | $333,900 | $243 | 62 |
| 1017 Pecan Pl | 0.54mi | 3/2.0 (-1) | 1,376 (+2%) | 4mo | $333,900 | $243 | 59 |
| 1000 Cedar St | 0.54mi | 3/2.0 (-1) | 1,376 (+2%) | 5mo | $340,900 | $248 | 58 |
| 320 Live Oak Ln | 0.46mi | 3/2.0 (-1) | 1,229 (-9%) | 1mo | $309,900 | $252 | 54 |
| 1020 Cedar St | 0.56mi | 3/2.0 (-1) | 1,376 (+2%) | 8mo | $330,000 | $240 | 54 |
| 1020 Pecan Pl | 0.51mi | 3/2.0 (-1) | 1,229 (-9%) | 2mo | $309,900 | $252 | 51 |
| 1005 Cedar St | 0.57mi | 3/2.0 (-1) | 1,376 (+2%) | 13mo | $344,900 | $251 | 50 |
| 1101 Cedar St | 0.61mi | 3/2.0 (-1) | 1,376 (+2%) | 12mo | $349,900 | $254 | 48 |
| 313 Southaven Blvd | 0.43mi | 3/2.0 (-1) | 1,229 (-9%) | 15mo | $330,900 | $269 | 44 |
| 1109 Cedar St | 0.62mi | 3/2.0 (-1) | 1,229 (-9%) | 8mo | $323,900 | $264 | 41 |
| 102 N Pacific St | 0.73mi | 3/2.0 (-1) | 1,156 (-14%) | 11mo | $219,990 | $190 | 24 |
Match score weights: distance 35% · size 25% · config 20% · recency 20%. Top-matched comps best support the ARV.
Projected returns pro-forma
1.21% appreciation · 3.0% rent growth · sell at horizon
- IRR
- 13.6%
- Equity multiple
- 1.70×
- Total profit
- $32,383
- Equity at exit
- $58,105
- IRR
- 17.0%
- Equity multiple
- 3.11×
- Total profit
- $97,265
- Equity at exit
- $78,637
Cash invested: $46,172 (down + closing). Projections, not guarantees.
Landlord ↔ Tenant lean methodology
- Overall (STATE)
- 87 Strongly Landlord-Friendly
- State Texas
- 87 Strongly Landlord-Friendly · R+5
- County
- — inherits STATE
- City
- — inherits STATE
ZIP-level market 75141
- Home prices YoY
- 0.3%
- Active inventory
- 85
- Price-to-rent
- 6.1×
Monthly cashflow live
- Estimated rent
- $2,253 high interval (Pro) →
- Mortgage (P&I)
- −$865
- Tax from tax record
- −$415 /mo · $4,985/yr
- Insurance
- −$69
- HOA
- −$0
- Lot rent
- −$0
- Vacancy / Maint / Mgmt
- −$473
- Net cashflow
- $431
Break-even live
Sensitivity live
| Price | -10% $524 | -5% $477 | +0% $431 | +5% $384 | +10% $337 |
|---|---|---|---|---|---|
| Rent | -10% $253 | -5% $342 | +0% $431 | +5% $520 | +10% $609 |
| Rate | -1.0pp $514 | -0.5pp $473 | base $431 | +0.5pp $388 | +1.0pp $345 |
UW: 25.0% down · 7.5% · 30yr · 1.5% tax · 5.0% vac · 8.0% maint · 8.0% mgmt
Financing live
Cash to close
- Down payment
- $41,225
- Closing costs
- $4,947
- Reserves months
- —
- Total cash needed
- —
Loan-product check · same deal, 3 products live
Conventional
25% down · 7.5% · 30yr
- Down + closing
- —
- Monthly P&I
- —
- Monthly cashflow
- —
- DSCR
- —
- Eligible?
- —
Personal DTI + credit; lowest rate.
DSCR
20% down · 8.5% · 30yr
- Down + closing
- —
- Monthly P&I
- —
- Monthly cashflow
- —
- DSCR
- —
- Eligible?
- —
No personal income docs; deal must DSCR.
Hard money
10% down · 12.0% · 12mo
- Down + closing
- —
- Monthly P&I
- —
- Monthly cashflow
- —
- DSCR
- —
- Eligible?
- —
Short-term bridge; refi at stabilization.
Rent comps 7 comps
| Address | Beds | Baths | Sqft | Rent | $/sqft | DOM | Units | Dist |
|---|---|---|---|---|---|---|---|---|
| 905 Cottonwood Ave Hutchins, TX | 3.0–5.0 | 2.0–2.5 | 1865 | $2,540 | $1.36 | 0d | 1 | 0.29mi |
| 153 Magnolia Blvd Hutchins, TX | 3.0 | 2.0 | 1629 | $2,235 | $1.37 | 46d | 1 | 0.34mi |
| 336 Live Oak Ln Hutchins, TX | 4.0 | 2.0 | 1798 | $2,370 | $1.32 | 46d | 1 | 0.48mi |
| 1012 Pecan Pl Dallas, TX | 4.0 | 2.0 | 1674 | $2,325 | $1.39 | 46d | 1 | 0.49mi |
| 1020 Pecan Pl Dallas, TX | 3.0 | 2.0 | 1229 | $2,150 | $1.75 | 46d | 1 | 0.50mi |
| 700 J J Lemmon Rd Hutchins, TX | 1.0–4.0 | 1.0–2.0 | 955 | $1,997 | $2.09 | 7d | 10 | 0.57mi |
| 337 Summer Tree Dr Hutchins, TX | 3.0 | 2.0 | 1475 | $1,885 | $1.28 | 46d | 1 | 0.72mi |
Listing history 36 events
-
2026-06-22days on market $164,900 Active 70 DOM
-
2026-06-21days on market $164,900 Active 69 DOM
-
2026-06-18days on market $164,900 Active 66 DOM
-
2026-06-17days on market $164,900 Active 65 DOM
-
2026-06-16days on market $164,900 Active 64 DOM
-
2026-06-15days on market $164,900 Active 63 DOM
-
2026-06-13days on market $164,900 Active 61 DOM
-
2026-06-09days on market $164,900 Active 57 DOM
-
2026-06-08days on market $164,900 Active 56 DOM
-
2026-06-07days on market $164,900 Active 55 DOM
-
2026-06-04days on market $164,900 Active 52 DOM
-
2026-06-03days on market $164,900 Active 51 DOM
-
2026-06-02days on market $164,900 Active 50 DOM
-
2026-06-01days on market $164,900 Active 49 DOM
-
2026-05-31days on market $164,900 Active 48 DOM
-
2026-04-29price $164,900 344-char remark
Show marketing remark (344 chars)
Welcome to 125 CROCKETT DR. This 3-bedroom, 1-bath property is in the Hutchins Heights Subdivision. The subject is surrounded by new construction, and in fair condition with ample yard space. This property has unlimited potential – send this to your client immediately. Don’t walk, run, make an appointment to see this property.
-
2026-04-13$179,900 Active 344-char remark
Show marketing remark (344 chars)
Welcome to 125 CROCKETT DR. This 3-bedroom, 1-bath property is in the Hutchins Heights Subdivision. The subject is surrounded by new construction, and in fair condition with ample yard space. This property has unlimited potential – send this to your client immediately. Don’t walk, run, make an appointment to see this property.
-
2026-03-30historical
-
2026-03-20price $179,900
-
2026-02-17price $187,000
-
2025-12-30$198,220 Active
-
2025-11-09$170,000 Active
-
2025-11-03historical
-
2025-08-01$196,500 Active
-
2023-05-30soldstatus Closed
-
2023-05-18soldstatus
-
2023-04-12status Pending
-
2023-04-05historical Active Option Contract
-
2023-03-28$209,999 Active
-
2021-10-25soldstatus
-
2021-09-13soldstatus
-
2021-08-13soldstatus
-
2018-10-18soldstatus
-
1987-05-19soldstatus
-
1981-01-19soldstatus
-
1980-08-02soldstatus
ⓘ Source: listings_history table (triggers on properties + properties_extension) + one-shot
backfill from property_details.listing_events for pre-trigger history.
Tax reassessment forecast TX · Resets to sale price
- Current annual tax
- $4,985 · $415/mo
- Projected year-2 tax
- $4,985 · $415/mo
- Expected delta
- $0/yr ($0/mo · 0.0%)
ⓘ Screening estimate from a state-policy table — verify with the county assessor before closing.
Climate risk First Street
- Flood 1/10 Low FEMA zone X (unshaded) · 0% chance over 30 yrs
- Wildfire 4/10 Moderate
- Heat 8/10 Severe 7 d/yr ≥110°F today · 24 d/yr by 30 yrs out
- Wind 6/10 Major 27% chance of damaging wind over 30 yrs
- Air quality 2/10 Low 1 unhealthy d/yr today · 1 by 30 yrs out
Nearby sold comps map
Loading sold comps map…
Walkable amenities ~0.75 mi
Loading nearby amenities…
Taxation est. · year 1
- Rental income
- $27,033
- − Mortgage interest
- −$9,237
- − Property taxes
- −$4,985
- − Insurance
- −$824
- − Repairs & maintenance
- −$2,163
- − Management
- −$2,163
- − Depreciation
- −$4,797
- Taxable income
- $2,863
- Est. tax owed @ 24.0%
- −$687
- After-tax cash flow
- $4,482/yr
For passive investors: Depreciation is non-cash, so a rental often shows a tax loss while cash-flowing — sheltering income. Rental losses are passive: they offset passive income freely, and up to $25,000/yr can offset ordinary (W-2) income if you actively participate and your MAGI is under $100k (phasing out to $0 by $150k); unused losses carry forward. On sale, claimed depreciation is recaptured at up to 25%, and gains may owe capital-gains tax (a 1031 exchange can defer both). Figures are a year-1 estimate at your 24.0% rate — not tax advice; consult a CPA.
Schools (NCES district)
- District
- Dallas ISD
- NCES district ID
- 4816230
- Math proficiency
- 31% ▼ -16.00%
- Reading proficiency
- 36% ▼ -4.00%
- Median HH income
- $42,881
- Composite
- 28.41/100
- National rank
- #6763
- State rank
- #559 of 826 in TX
Livability — Hutchins
- Score
- 60/100
- State rank
- #1096
- US rank
- #19422
Category grades
Schools grade is shown separately in the Schools card above.
Census & demographics
- Census place
- Hutchins, TX
- City population
- 4,686
- Population (ZIP)
- 4,686
Population outlook (Dallas County) Hauer SSP2
- Today (2025)
- 2,979,839 people
- By 2030
- 3,191,823 · +7.1%
- By 2040
- 3,619,611 · +21.5%
- By 2050
- 4,026,915 · +35.1%
- By 2075
- 4,957,073 · +66.4%
- By 2100
- 5,508,725 · +84.9%
Race, ethnicity, and origin ACS 2023
- Neighborhood character
- Diverse neighborhood (Simpson 0.56)
- Race & ethnicity
- Hispanic / Latino 53% Black 39% Two or more races 24% White 6%
- Hispanic origin (detail)
- Mexican 46% Puerto Rican 3%
- Common ancestry
- Slovak 1% American 1% Russian 1%
- Foreign-born
- 23% · Canada
- Languages at home
- 51% English-only · Spanish 49% Other Indo-European 1%
Political lean MEDSL · Dallas
- 2024 margin
- Strong D (+22.2) · D 60.2% · R 38.0% · Other 1.8%
- 2008→2024 swing
- +6.9pp toward D · 2008: 15.3pp · 2024: 22.2pp
- All cycles
- 2024: D+22.2 2020: D+31.6 2016: D+26.2 2012: D+15.4 2008: D+15.3
Not yet ingested
- Civics
- —
Market trends
- HPI YoY
- ▲ 1.21%
- Current HPI
- 382.1182
- Rent YoY
- —
- Metro
- —
- State GDP YoY
- ▲ 3.95%
- F500 in state
- 110
Industry mix (Fortune 500 HQ in TX)
| Industry | F500 HQs | Revenue |
|---|---|---|
| Energy | 16 | $1,198B |
|
||
| Technology | 5 | $198B |
|
||
| Engineering / Construction | 4 | $72B |
|
||
| Energy Services | 3 | $60B |
|
||
| Utilities | 3 | $41B |
|
||
| Healthcare | 2 | $330B |
|
||
Price history
-21.5% since first listed21 events — show timeline
- 2026-04-29 Price Changed $164,900 NTREIS
- 2026-04-13 Listed $179,900 NTREIS
- 2026-03-30 Listing Removed — NTREIS
- 2026-03-20 Price Changed $179,900 NTREIS
- 2026-02-17 Price Changed $187,000 NTREIS
- 2025-12-30 Listed $198,220 NTREIS
- 2025-11-09 Listed $170,000 NTREIS
- 2025-11-03 Listing Removed — NTREIS
- 2025-08-01 Listed $196,500 NTREIS
- 2023-05-30 Sold (MLS) — NTREIS
- 2023-05-18 Sold (Public Records) — Public Records
- 2023-04-12 Pending — NTREIS
- 2023-04-05 Contingent — NTREIS
- 2023-03-28 Listed $209,999 NTREIS
- 2021-10-25 Sold (Public Records) — Public Records
- 2021-09-13 Sold (Public Records) — Public Records
- 2021-08-13 Sold (Public Records) — Public Records
- 2018-10-18 Sold (Public Records) — Public Records
- 1987-05-19 Sold (Public Records) — Public Records
- 1981-01-19 Sold (Public Records) — Public Records
- 1980-08-02 Sold (Public Records) — Public Records
Property tax history
+8.1%/yrLatest (2025): $4,985 · +8.2% YoY. Source: county tax records.
Cash-flow waterfall
monthlySold comps — $/sqft
last 12 mo · ≤1 miLoading sold comps…