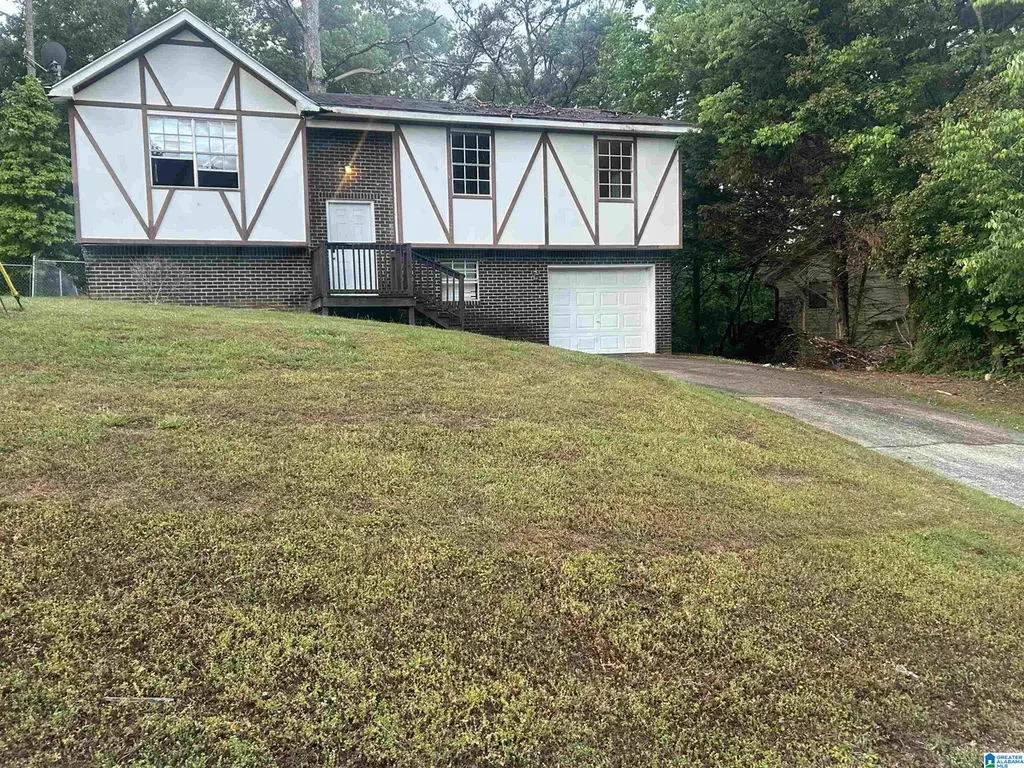
4220 Fieldstone Dr · Pinson, AL
Flood risk 1/10 · Minimal
- FEMA flood zone
- X (unshaded)
- Chance of flooding over 30 yrs
- 0.0%
- Est. flood insurance / yr
- $473 – $860
Fire risk 3/10 · Minor
- Est. fire insurance / yr
- $916 – $1,700
Heat risk 5/10 · Moderate
- Hot days now (above 105°F)
- 7 days/yr
- Hot days in 30 yrs
- 18 days/yr
Wind risk 6/10 · Moderate
- Chance of severe wind over 30 yrs
- 27.0%
Air-quality risk 5/10 · Moderate
- Unhealthy air days now
- 6 days/yr
- Unhealthy air days in 30 yrs
- 11 days/yr
Risk factors via First Street. Map © Google.
Why this score? — see what drove the B- grade
The composite is a weighted blend of 9 inputs, each scored 0–100. Each bar is that input's sub-score; the figure is the points it added to the 100-point composite (weight × sub-score).
- Cash flow +25.3/30.0
- ARV discount +15.0/15.0
- DSCR +8.3/10.0
- 1% rule +6.4/10.0
- Rent growth +3.3/5.0
- Livability +3.0/5.0
- Condition / age +2.5/5.0
- Schools +1.8/10.0
- Appreciation +0.0/10.0
$134,900
🖨 Deal sheet 📄 Offer letter ✓ Due diligence
Listing remarks MLS
3BR 2BA split foyer w/ eat in kitchen. Large den complete w/ wet bar. Fresh carpet. Fireplaces in both up and downstairs dens. Fenced back yard with deck. Extra storage space in garage. New front porch.
Key facts
- Bright living room
- Updated kitchen
- Split-level home
Tags
Property features AI
Exterior
- Parking: Basement garage parking; Driveway parking; One total garage space (basement level)
- Security: Security system (interior)
- Utilities: Public water; Connected sewer; Gas water heater
- Home design: Existing home; Basement foundation; Basement includes both finished and unfinished areas; Basement constructed with poured concrete walls and concrete block
- Construction: Brick over foundation with concrete/block, wood siding and wood construction
- Exterior features: Front porch; Open deck; No pool; Not waterfront; No garden/patio
Interior
- Kitchen: Laminate countertops; Built-in dishwasher
- Bedrooms: Master bedroom on main level; Two additional bedrooms on main level; Den/family room in the basement
- Flooring: Carpet; Vinyl
- Bathrooms: Two full bathrooms; Tub/shower combo
- Heating & cooling: Central heating; Central air conditioning
- Interior features: Cathedral/vaulted ceilings; Textured walls; Security system; Wood-burning fireplace with brick/masonry surround located in the den
- Laundry & utility: Washer hookup; Electric dryer hookup; Laundry located in the basement
Neighborhood map
What this means for you Summary
Snapshot
- This is a 3-bed/2.0-bath single-family listed at $135k.
Deal economics
- At list price, monthly cash flow is $306 ($4k/yr) — positive.
- The deal already cash-flows at list — no discount required.
- Meets the 1% rule at list price ($2k rent vs $135k).
- Recommended offer: $133k (1.5% below list) — sets the bar for market timing.
- Cap rate 9.0% vs local median 5.3% in Pinson — top-decile yield for the area; either an underpriced asset or a hidden risk that comps aren't pricing in. Stress-test before assuming the spread holds.
Location & tenants
- Location reads 60/100 on livability (#289 in AL) — a middle-class / working-renter tenant base. Strengths: cost of living A+, housing A+, crime B+; Watch: amenities F, commute F, health & safety F.
- Jefferson County (suburban): math 9% / reading 32% proficiency, ranked #104 of 129 in AL (top 81%) — low school quality limits family demand, transient renter base, plan for 1-2y turnover.
- Zoned schools: Pinson Elementary School (801 students, 54% FRL); Pinson Valley High School (math 6% / reading 17%, grade F, #246 of 305 statewide, top 81%, 1,029 students, 81% FRL) — zoned schools average 68% FRL vs 49% district-wide (19 pts higher); higher-poverty schools than district average — tighter screening recommended.
- Market conditions: Rents rising (+3.0%/yr); 334 active listings in the ZIP; 16 comparable units currently listed for rent nearby; rentals at typical pace (median 16d on market — plan ~3-4 weeks tenant-placement turnaround); 2,114 units permitted in Jefferson County in 2024 (556 in 5+ unit buildings).
- This rent runs 35% of the median local income ($53k/yr) — at the standard rent-burdened threshold; future hikes will face affordability resistance.
Forward outlook
- Local home prices are declining (-3.0%/yr); year-one equity from $933 of loan paydown is wiped out by about $4k of value loss. Plan a longer hold.
- Jefferson County population projected to shrink 4% by 2050 — rents likely to lag national; underwrite the cash flow, not the appreciation.
Negotiation context
- It's been on market 27 days — a 2% lower offer ($133k) is reasonable based on typical stale-listing flexibility.
- 2 sale attempts since 11y ago with the ask held roughly flat each time — persistent listings suggest the price (not the market) is what's stuck; bring a comps-based counter.
Risks & watch-outs
- Climate carrying-cost: major wind risk, 27% chance of damaging wind over 30y; extreme-heat days projected 7→18/yr by 2055 (HVAC capex compounding) — expect insurance premiums to compound above CPI over the hold.
Questions for the listing agent
- Built in 1978 — when were the roof, HVAC, electrical panel, plumbing, and water heater last replaced?
- Is there a deadline driving the sale (1031 exchange, divorce, estate, relocation)? That informs how much negotiation room exists.
- Schools are D-rated, which usually means shorter tenancies and higher turnover. Who's the typical renter profile here, and what's been the actual vacancy rate?
- What's the average days-on-market for RENTAL listings here right now (not sales)? A rising rental-DOM trend means longer vacancies and softer asking-rent achievability than the comps imply.
- What's the recent tenant-quality profile in this submarket — average credit score on applications, eviction rate, late-payment / NSF rate, and stable-employment percentage? A property-management company in the area should have these aggregated.
- How much new for-sale + rental construction is in the pipeline within 1–3 miles? Heavy new supply typically softens prices + rents 12–24 months out; constrained supply supports both.
Investment metrics
- 1% rule
- 1.14% ✓
- Cap rate
- 9.02%
- Cash-on-cash
- 9.73%
- DSCR
- 1.43
- GRM
- 7.3
CMA / ARV
- ARV (median comp)
- $216,200
- List price
- $134,900
- Delta
- -37.60%
- Verdict
- UNDERPRICED
- Comps
- 20 within 1.0 mi
Show comp detail 12 sales within ~0.75 mi
| Address | Dist | Beds/Ba | Sqft | Sold | Price | $/sf | Match |
|---|---|---|---|---|---|---|---|
| 3136 Fieldstone Cir | 0.13mi | 3/2.0 | 1,697 (-4%) | 2mo | $195,000 | $115 | 85 |
| 3150 Sleepy Hollow Dr | 0.07mi | 4/3.0 (+1) | 1,722 (-3%) | 3mo | $235,240 | $137 | 80 |
| 521 Baily Dr | 0.13mi | 3/2.5 | 1,616 (-9%) | 9mo | $200,000 | $124 | 69 |
| 315 40th Ave NE | 0.40mi | 3/2.0 | 1,905 (+7%) | 7mo | $215,000 | $113 | 64 |
| 6445 Bogue Rd | 0.48mi | 3/2.0 | 1,698 (-4%) | 8mo | $130,000 | $77 | 64 |
| 285 Martin Dr | 0.32mi | 3/2.0 | 1,590 (-10%) | 12mo | $199,900 | $126 | 58 |
| 4533 Oak Dr | 0.68mi | 3/2.0 | 1,650 (-7%) | 6mo | $186,000 | $113 | 52 |
| 4541 Oak Dr | 0.68mi | 4/3.0 (+1) | 1,768 (-0%) | 11mo | $140,000 | $79 | 50 |
| 333 36th Ave NE | 0.66mi | 3/2.0 | 2,004 (+13%) | 3mo | $245,000 | $122 | 46 |
| 4358 Oak St | 0.65mi | 3/2.5 | 1,960 (+10%) | 8mo | $250,000 | $128 | 43 |
| 4510 Silver Lake Rd | 0.70mi | 3/2.0 | 2,030 (+14%) | 3mo | $227,500 | $112 | 40 |
| 108 38th Ave NE | 0.64mi | 3/2.0 | 1,536 (-14%) | 10mo | $170,000 | $111 | 39 |
Match score weights: distance 35% · size 25% · config 20% · recency 20%. Top-matched comps best support the ARV.
Projected returns pro-forma
-3.0% appreciation · 3.04% rent growth · sell at horizon
- IRR
- -1.6%
- Equity multiple
- 0.94×
- Total profit
- $-2,273
- Equity at exit
- $20,114
- IRR
- 8.1%
- Equity multiple
- 1.62×
- Total profit
- $23,445
- Equity at exit
- $11,664
Cash invested: $37,772 (down + closing). Projections, not guarantees.
Landlord ↔ Tenant lean methodology
- Overall (STATE)
- 90 Strongly Landlord-Friendly
- State Alabama
- 90 Strongly Landlord-Friendly · R+15
- County
- — inherits STATE
- City
- — inherits STATE
ZIP-level market 35215
- Home prices YoY
- -34.4%
- Rents YoY
- 3.0%
- Active inventory
- 334
- Price-to-rent
- 7.3×
Monthly cashflow live
- Estimated rent
- $1,541 high interval (Pro) →
- Mortgage (P&I)
- −$707
- Tax from tax record
- −$147 /mo · $1,767/yr
- Insurance
- −$56
- HOA
- −$0
- Vacancy / Maint / Mgmt
- −$324
- Net cashflow
- $306
Break-even live
UW: 25.0% down · 7.5% · 30yr · 1.5% tax · 5.0% vac · 8.0% maint · 8.0% mgmt
Financing live
Cash to close
- Down payment
- $33,725
- Closing costs
- $4,047
- Reserves months
- —
- Total cash needed
- —
Loan-product check · same deal, 3 products live
Conventional
25% down · 7.5% · 30yr
- Down + closing
- —
- Monthly P&I
- —
- Monthly cashflow
- —
- DSCR
- —
- Eligible?
- —
Personal DTI + credit; lowest rate.
DSCR
20% down · 8.5% · 30yr
- Down + closing
- —
- Monthly P&I
- —
- Monthly cashflow
- —
- DSCR
- —
- Eligible?
- —
No personal income docs; deal must DSCR.
Hard money
10% down · 12.0% · 12mo
- Down + closing
- —
- Monthly P&I
- —
- Monthly cashflow
- —
- DSCR
- —
- Eligible?
- —
Short-term bridge; refi at stabilization.
Rent comps 16 comps
| Address | Beds | Baths | Sqft | Rent | $/sqft | DOM | Units | Dist |
|---|---|---|---|---|---|---|---|---|
| 3104 Cobblestone Dr Birmingham, AL | 3.0 | 1.5 | 1533 | $1,516 | $0.99 | 2d | 1 | 0.23mi |
| 4246 Centerwood Dr Birmingham, AL | 3.0 | 2.0 | 1336 | $1,450 | $1.09 | 16d | 1 | 0.23mi |
| 340 40th Ave NE Center Point, AL | 3.0 | 2.0 | 2007 | $1,650 | $0.82 | 16d | 1 | 0.34mi |
| 3005 Sweeney Hollow Pl Birmingham, AL | 3.0 | 2.0 | 2014 | $1,325 | $0.66 | 14d | 1 | 0.53mi |
| 212 Saint John Dr NW Birmingham, AL | 2.0 | 2.0 | 1445 | $1,423 | $0.98 | 14d | 1 | 0.59mi |
| 345 Saint John Rd NW Birmingham, AL | 3.0 | 2.0 | 2142 | $1,731 | $0.81 | 2d | 1 | 0.73mi |
| 5992 Princess Blvd Birmingham, AL | 3.0 | 2.0 | 1454 | $1,661 | $1.14 | 43d | 1 | 0.73mi |
| 1104 Oak Creek Trl NE Birmingham, AL | 3.0 | 2.0 | 1233 | $1,543 | $1.25 | 2d | 1 | 0.86mi |
| 3814 Mars Ave Center Point, AL | 4.0 | 2.0 | 2063 | $1,890 | $0.92 | 43d | 1 | 0.96mi |
| 4464 Winchester Hills Ln Pinson, AL | 3.0 | 2.0 | 1500 | $1,750 | $1.17 | 11d | 1 | 1.07mi |
| 202 Westchester Dr Birmingham, AL | 4.0 | 2.0 | 1374 | $1,300 | $0.95 | 23d | 1 | 1.20mi |
| 2655 6th St NE Center Point, AL | 3.0 | 2.0 | 1600 | $1,390 | $0.87 | 2d | 1 | 1.25mi |
| 5944 Tyler Loop Rd Pinson, AL | 3.0 | 2.0 | 1247 | $1,485 | $1.19 | 23d | 1 | 1.25mi |
| 605 Country View Dr Birmingham, AL | 3.0 | 2.0 | 1698 | $1,560 | $0.92 | 43d | 1 | 1.25mi |
| 607 Country View Dr Birmingham, AL | 4.0 | 2.0 | 1568 | $1,550 | $0.99 | 23d | 1 | 1.25mi |
| 2708 7th St NE Center Point, AL | 3.0 | 1.0 | 1451 | $1,150 | $0.79 | 43d | 1 | 1.46mi |
Listing history 14 events
-
2026-06-13statusdays on market $134,900 Pending 27 DOM
-
2026-06-10days on market $134,900 Active 26 DOM
-
2026-06-09days on market $134,900 Active 25 DOM
-
2026-06-08days on market $134,900 Active 24 DOM
-
2026-06-07days on market $134,900 Active 23 DOM
-
2026-06-03days on market $134,900 Active 19 DOM
-
2026-06-02days on market $134,900 Active 18 DOM
-
2026-06-01days on market $134,900 Active 17 DOM
-
2026-05-31days on market $134,900 Active 16 DOM
-
2026-05-15$134,900 Active 973-char remark
-
2016-04-06soldstatus $12,676,500
-
2015-04-28soldstatus $80,000 202-char remark
Show marketing remark (202 chars)
3BR 2BA split foyer w/ eat in kitchen. Large den complete w/ wet bar. Fresh carpet. Fireplaces in both up and downstairs dens. Fenced back yard with deck. Extra storage space in garage. New front porch.
-
2015-03-04$89,900 202-char remark
Show marketing remark (202 chars)
3BR 2BA split foyer w/ eat in kitchen. Large den complete w/ wet bar. Fresh carpet. Fireplaces in both up and downstairs dens. Fenced back yard with deck. Extra storage space in garage. New front porch.
-
1987-03-19soldstatus $52,900
ⓘ Source: listings_history table (triggers on properties + properties_extension) + one-shot
backfill from property_details.listing_events for pre-trigger history.
Tax reassessment forecast AL · Resets to sale price
- Current annual tax
- $1,767 · $147/mo
- Projected year-2 tax
- $1,767 · $147/mo
- Expected delta
- $0/yr ($0/mo · 0.0%)
ⓘ Screening estimate from a state-policy table — verify with the county assessor before closing.
Climate risk First Street
- Flood 1/10 Low FEMA zone X (unshaded) · 0% chance over 30 yrs
- Wildfire 3/10 Moderate
- Heat 5/10 Major 7 d/yr ≥105°F today · 18 d/yr by 30 yrs out
- Wind 6/10 Major 27% chance of damaging wind over 30 yrs
- Air quality 5/10 Major 6 unhealthy d/yr today · 11 by 30 yrs out
Nearby sold comps map
Loading sold comps map…
Walkable amenities ~0.75 mi
Loading nearby amenities…
Taxation est. · year 1
- Rental income
- $18,490
- − Mortgage interest
- −$7,556
- − Property taxes
- −$1,767
- − Insurance
- −$674
- − Repairs & maintenance
- −$1,479
- − Management
- −$1,479
- − Depreciation
- −$3,924
- Taxable income
- $1,610
- Est. tax owed @ 24.0%
- −$386
- After-tax cash flow
- $3,290/yr
For passive investors: Depreciation is non-cash, so a rental often shows a tax loss while cash-flowing — sheltering income. Rental losses are passive: they offset passive income freely, and up to $25,000/yr can offset ordinary (W-2) income if you actively participate and your MAGI is under $100k (phasing out to $0 by $150k); unused losses carry forward. On sale, claimed depreciation is recaptured at up to 25%, and gains may owe capital-gains tax (a 1031 exchange can defer both). Figures are a year-1 estimate at your 24.0% rate — not tax advice; consult a CPA.
Schools (NCES district)
- District
- Jefferson County
- NCES district ID
- 0101920
- Math proficiency
- 9% ▼ -24.00%
- Reading proficiency
- 32% ▼ -5.00%
- Median HH income
- $51,712
- Composite
- 18.4/100
- National rank
- #8937
- State rank
- #104 of 129 in AL
Livability — Pinson
- Score
- 60/100
- State rank
- #289
- US rank
- #18763
Category grades
Schools grade is shown separately in the Schools card above.
Census & demographics
- County
- Jefferson County · 527,445 people
- City population
- 22,599
- Metro
- Birmingham-Hoover, AL
- Population (ZIP)
- 43,903
- Household income
- $52,793
- Rent vs Own
- Severe rent burden
- 1729.0
Population outlook (Jefferson County) Hauer SSP2
- Today (2025)
- 669,185 people
- By 2030
- 669,694 · +0.1%
- By 2040
- 661,388 · -1.2%
- By 2050
- 643,086 · -3.9%
- By 2075
- 577,267 · -13.7%
- By 2100
- 474,758 · -29.1%
Race, ethnicity, and origin ACS 2023
- Neighborhood character
- Predominantly Black (75%)
- Race & ethnicity
- Black 75% White 15% Hispanic / Latino 7% Two or more races 3%
- Hispanic origin (detail)
- Mexican 4%
- Common ancestry
- Lithuanian 1% Italian 1% Slovak 1%
- Foreign-born
- 4% · Canada
- Languages at home
- 92% English-only · Spanish 7%
Political lean MEDSL · Jefferson
- 2024 margin
- D (+10.4) · D 54.6% · R 44.2% · Other 1.2%
- 2008→2024 swing
- +5.4pp toward D · 2008: 5.1pp · 2024: 10.4pp
- All cycles
- 2024: D+10.4 2020: D+13.2 2016: D+7.2 2012: D+6.0 2008: D+5.1
Not yet ingested
- Civics
- —
Market trends
- HPI YoY
- ▼ -112.97%
- Current HPI
- 215.0607
- Rent YoY
- ▲ 3.04%
- Metro
- Birmingham-Hoover, AL
- State GDP YoY
- ▲ 2.94%
- F500 in state
- 4
Industry mix (Fortune 500 HQ in AL)
| Industry | F500 HQs | Revenue |
|---|---|---|
| Financial Services | 1 | $8B |
|
||
| Healthcare | 1 | $5B |
|
||
Price history
+155.0% since first listed6 events — show timeline
- 2026-06-11 Pending — Greater Alabama MLS
- 2026-05-15 Listed $134,900 Greater Alabama MLS
- 2016-04-06 Sold (Public Records) $12,676,500 Public Records
- 2015-04-28 Sold (MLS) $80,000 Greater Alabama MLS
- 2015-03-04 Listed $89,900 Greater Alabama MLS
- 1987-03-19 Sold (Public Records) $52,900 Public Records
Property tax history
+2.2%/yrLatest (2025): $1,767 · +0.0% YoY. Source: county tax records.
Cash-flow waterfall
monthlySold comps — $/sqft
last 12 mo · ≤1 miLoading sold comps…