817 20th St · Grand Prairie, TX
Flood risk 1/10 · Minimal
- FEMA flood zone
- X (unshaded)
- Chance of flooding over 30 yrs
- 0.0%
- Est. flood insurance / yr
- $507 – $1,088
Fire risk 1/10 · Minimal
- Est. fire insurance / yr
- $1,222 – $2,270
Heat risk 7/10 · Major
- Hot days now (above 110°F)
- 7 days/yr
- Hot days in 30 yrs
- 23 days/yr
Wind risk 6/10 · Moderate
- Chance of severe wind over 30 yrs
- 27.0%
Air-quality risk 3/10 · Minor
- Unhealthy air days now
- 2 days/yr
- Unhealthy air days in 30 yrs
- 3 days/yr
Risk factors via First Street. Map © Google.
Why this score? — see what drove the B grade
The composite is a weighted blend of 9 inputs, each scored 0–100. Each bar is that input's sub-score; the figure is the points it added to the 100-point composite (weight × sub-score).
- Cash flow +26.0/30.0
- ARV discount +15.0/15.0
- DSCR +8.7/10.0
- 1% rule +8.2/10.0
- Livability +4.0/5.0
- Rent growth +2.8/5.0
- Schools +2.8/10.0
- Condition / age +2.5/5.0
- Appreciation +0.0/10.0
$125,000
🖨 Deal sheet 📄 Offer letter ✓ Due diligence
Listing remarks
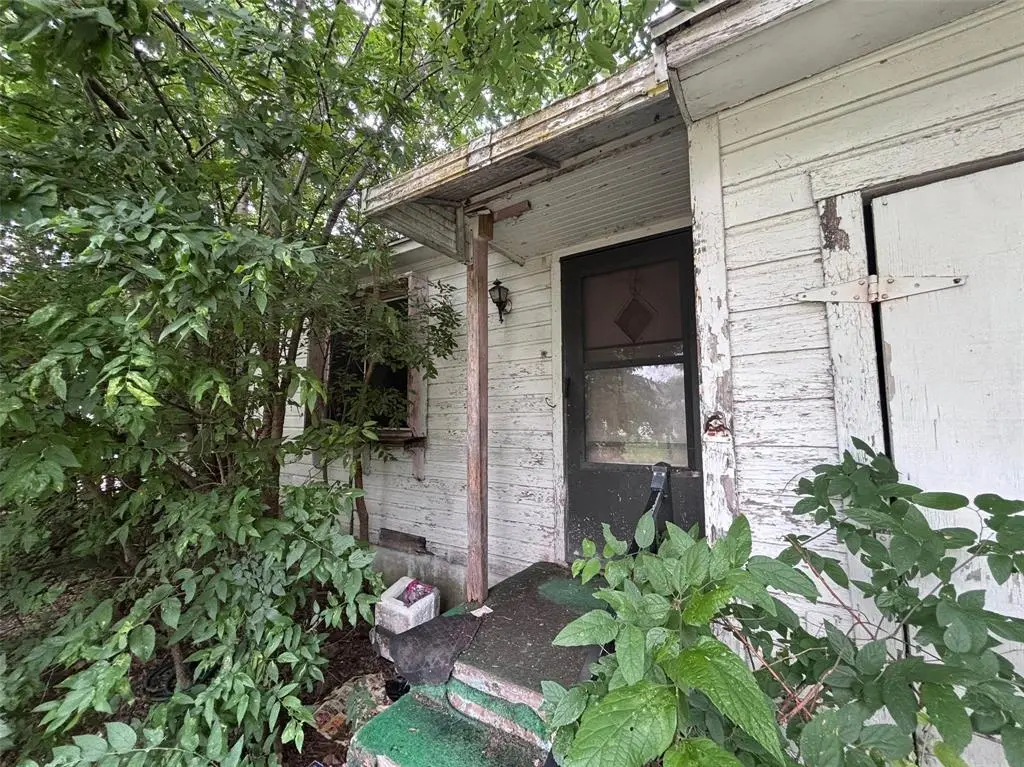
Investor Special - This house will need a full rehab. Property is being sold AS-IS.
Key facts
- 8,538 sq ft lot
- Built 1950
Property features AI
Finance
- Other: Property listed as standard for sale with possession at closing/funding
- Financial info: Treat as clear loan type; No second mortgage indicated
- HOA & community: No homeowners association
Exterior
- Parking: Driveway parking
- Security: No specific security features provided
- Utilities: City water; City sewer; Not located in a municipal utility district
- Home design: Single-family residence; Residential property; Built in 1950; Not attached to other properties; Entry level and all living spaces on one level
- Construction: 1950 construction
- Exterior features: Lot less than 0.5 acre (about 0.196 acres); Subdivision: Vought Manor 04
Interior
- Kitchen: Other appliances included
- Bedrooms: 2 bedrooms (both on the main level)
- Flooring: No flooring details provided
- Bathrooms: 1 full bathroom
- Heating & cooling: No heating or cooling details provided
- Interior features: 3 total rooms; One-level floorplan; Living area approximately 780; Other interior features
- Laundry & utility: No specific laundry/utility details provided
Neighborhood map
What this means for you Summary
Snapshot
- This is a 2-bed/1.0-bath single-family listed at $125k.
Deal economics
- At list price, monthly cash flow is $311 ($4k/yr) — positive.
- The deal already cash-flows at list — no discount required.
- Meets the 1% rule at list price ($2k rent vs $125k).
- Cap rate 9.3% vs local median 3.6% in Grand Prairie — top-decile yield for the area; either an underpriced asset or a hidden risk that comps aren't pricing in. Stress-test before assuming the spread holds.
Location & tenants
- Location reads 80/100 on livability (#33 in TX, #1,660 nationally) — a professional / high-income tenant draw. Strengths: amenities A+, cost of living A+, housing A+; Watch: commute F.
- Grand Prairie ISD (suburban): math 29% / reading 35% proficiency, ranked #572 of 826 in TX (top 69%) — families likely to look elsewhere, expect single-tenant / working-renter base with shorter leases; 63% free/reduced lunch — lower-income household profile, screen leases tightly.
- Zoned schools: William B Travis World Language Academy (math 16% / reading 19%, grade F, #3,805 of 4,322 statewide, top 89%, 655 students, 93% FRL, charter) — zoned schools average 93% FRL vs 63% district-wide (30 pts higher); higher-poverty schools than district average — tighter screening recommended.
- Zoned-school proficiency averages 18% at this address vs 32% district-wide (-14 pts) — the specific schools serving this property underperform the Grand Prairie ISD average; the district grade overstates school quality for this exact location.
- Market conditions: Rents rising (+1.0%/yr); 112 active listings in the ZIP; 10 comparable units currently listed for rent nearby; rentals at typical pace (median 25d on market — plan ~3-4 weeks tenant-placement turnaround); 12,577 units permitted in Dallas County in 2024 (6,829 in 5+ unit buildings).
Forward outlook
- Local home prices are declining (-3.0%/yr); year-one equity from $864 of loan paydown is wiped out by about $4k of value loss. Plan a longer hold.
- Dallas County population projected at +35% by 2050 — long-run rental-demand tailwind backs the buy-and-hold thesis.
Negotiation context
- Only 1 days on market — expect competitive offers; lowballing is unlikely to land.
Risks & watch-outs
- Watch-outs: property tax is 2.8% of price; built in 1950 — expect roof / HVAC / electrical / plumbing capex.
- Climate carrying-cost: major wind risk, 27% chance of damaging wind over 30y; extreme-heat days projected 7→23/yr by 2055 (HVAC capex compounding) — expect insurance premiums to compound above CPI over the hold.
Questions for the listing agent
- Built in 1950 — when were the roof, HVAC, electrical panel, plumbing, and water heater last replaced?
- Property tax is high relative to price — has the assessment been appealed recently, and will the sale trigger a re-assessment?
- Is there a deadline driving the sale (1031 exchange, divorce, estate, relocation)? That informs how much negotiation room exists.
- What's the average days-on-market for RENTAL listings here right now (not sales)? A rising rental-DOM trend means longer vacancies and softer asking-rent achievability than the comps imply.
- What's the recent tenant-quality profile in this submarket — average credit score on applications, eviction rate, late-payment / NSF rate, and stable-employment percentage? A property-management company in the area should have these aggregated.
- How much new for-sale + rental construction is in the pipeline within 1–3 miles? Heavy new supply typically softens prices + rents 12–24 months out; constrained supply supports both.
Investment metrics
- 1% rule
- 1.32% ✓
- Cap rate
- 9.28%
- Cash-on-cash
- 10.66%
- DSCR
- 1.47
- GRM
- 6.3
CMA / ARV
- ARV (on-the-fly)
- $161,460
- Comps found
- 5
Show comp detail 5 sales within ~0.75 mi
| Address | Dist | Beds/Ba | Sqft | Sold | Price | $/sf | Match |
|---|---|---|---|---|---|---|---|
| 817 20th St | 0.00mi | 2/1.0 | 780 (0%) | 0mo | $125,000 | $160 | 100 |
| 1650 Ash St | 0.30mi | 2/1.0 | 782 (+0%) | 8mo | $135,000 | $173 | 79 |
| 2009 Rosewood St | 0.07mi | 2/1.0 | 816 (+5%) | 16mo | $169,000 | $207 | 76 |
| 1713 Maple St | 0.17mi | 2/1.0 | 816 (+5%) | 13mo | $175,000 | $214 | 74 |
| 1214 Willow St | 0.70mi | 3/2.0 (+1) | 844 (+8%) | 11mo | $274,000 | $325 | 36 |
Match score weights: distance 35% · size 25% · config 20% · recency 20%. Top-matched comps best support the ARV.
Projected returns pro-forma
-3.0% appreciation · 1.0% rent growth · sell at horizon
- IRR
- -2.8%
- Equity multiple
- 0.90×
- Total profit
- $-3,618
- Equity at exit
- $18,638
- IRR
- 4.3%
- Equity multiple
- 1.28×
- Total profit
- $9,901
- Equity at exit
- $10,808
Cash invested: $35,000 (down + closing). Projections, not guarantees.
Landlord ↔ Tenant lean methodology
- Overall (STATE)
- 87 Strongly Landlord-Friendly
- State Texas
- 87 Strongly Landlord-Friendly · R+5
- County
- — inherits STATE
- City
- — inherits STATE
ZIP-level market 75050
- Home prices YoY
- -27.9%
- Rents YoY
- 1.0%
- Active inventory
- 112
- Price-to-rent
- 6.3×
Monthly cashflow live
- Estimated rent
- $1,655 high interval (Pro) →
- Mortgage (P&I)
- −$656
- Tax from tax record
- −$289 /mo · $3,468/yr
- Insurance
- −$52
- HOA
- −$0
- Vacancy / Maint / Mgmt
- −$348
- Net cashflow
- $311
Break-even live
UW: 25.0% down · 7.5% · 30yr · 1.5% tax · 5.0% vac · 8.0% maint · 8.0% mgmt
Financing live
Cash to close
- Down payment
- $31,250
- Closing costs
- $3,750
- Reserves months
- —
- Total cash needed
- —
Loan-product check · same deal, 3 products live
Conventional
25% down · 7.5% · 30yr
- Down + closing
- —
- Monthly P&I
- —
- Monthly cashflow
- —
- DSCR
- —
- Eligible?
- —
Personal DTI + credit; lowest rate.
DSCR
20% down · 8.5% · 30yr
- Down + closing
- —
- Monthly P&I
- —
- Monthly cashflow
- —
- DSCR
- —
- Eligible?
- —
No personal income docs; deal must DSCR.
Hard money
10% down · 12.0% · 12mo
- Down + closing
- —
- Monthly P&I
- —
- Monthly cashflow
- —
- DSCR
- —
- Eligible?
- —
Short-term bridge; refi at stabilization.
Rent comps 10 comps
| Address | Beds | Baths | Sqft | Rent | $/sqft | DOM | Units | Dist |
|---|---|---|---|---|---|---|---|---|
| 510 NE 18th St Unit 510 Grand Prairie, TX | 2.0 | 1.0 | 789 | $1,750 | $2.22 | 44d | 1 | 0.23mi |
| 2214 Pine St Grand Prairie, TX | 3.0 | 2.0 | 1034 | $2,100 | $2.03 | 14d | 1 | 0.24mi |
| 201 Skyline Cir Apt 12 Grand Prairie, TX | 2.0 | 1.0 | 902 | $1,450 | $1.61 | 17d | 1 | 0.45mi |
| 201 Skyline Cir Unit 46 Grand Prairie, TX | 2.0 | 1.0 | 902 | $1,415 | $1.57 | 5d | 1 | 0.45mi |
| 219 SE 13th St Unit 4 Grand Prairie, TX | 2.0 | 1.0 | 646 | $1,350 | $2.09 | 44d | 1 | 1.04mi |
| 2825 North St Apt 360 Grand Prairie, TX | 1.0 | 1.0 | 742 | $1,185 | $1.60 | 13d | 1 | 1.47mi |
| 2355 North St Grand Prairie, TX | 1.0–3.0 | 1.0–2.0 | 982 | $3,239 | $3.30 | 10d | 1 | 1.47mi |
| 2175 North St Apt 431 Grand Prairie, TX | 2.0 | 2.0 | 1073 | $1,475 | $1.37 | 24d | 1 | 1.47mi |
| 2175 North St Apt 1017 Grand Prairie, TX | 1.0 | 1.0 | 743 | $1,290 | $1.74 | 24d | 1 | 1.47mi |
| 2175 North St Apt 439 Grand Prairie, TX | 2.0 | 2.0 | 1073 | $1,570 | $1.46 | 24d | 1 | 1.47mi |
Listing history 2 events
-
2026-05-28status Pending
-
2026-05-27$125,000 Active
ⓘ Source: listings_history table (triggers on properties + properties_extension) + one-shot
backfill from property_details.listing_events for pre-trigger history.
Tax reassessment forecast TX · Resets to sale price
- Current annual tax
- $3,468 · $289/mo
- Projected year-2 tax
- $3,468 · $289/mo
- Expected delta
- $0/yr ($0/mo · 0.0%)
ⓘ Screening estimate from a state-policy table — verify with the county assessor before closing.
Climate risk First Street
- Flood 1/10 Low FEMA zone X (unshaded) · 0% chance over 30 yrs
- Wildfire 1/10 Low
- Heat 7/10 Severe 7 d/yr ≥110°F today · 23 d/yr by 30 yrs out
- Wind 6/10 Major 27% chance of damaging wind over 30 yrs
- Air quality 3/10 Moderate 2 unhealthy d/yr today · 3 by 30 yrs out
Nearby sold comps map
Loading sold comps map…
Walkable amenities ~0.75 mi
Loading nearby amenities…
Taxation est. · year 1
- Rental income
- $19,859
- − Mortgage interest
- −$7,002
- − Property taxes
- −$3,468
- − Insurance
- −$625
- − Repairs & maintenance
- −$1,589
- − Management
- −$1,589
- − Depreciation
- −$3,636
- Taxable income
- $1,951
- Est. tax owed @ 24.0%
- −$468
- After-tax cash flow
- $3,262/yr
For passive investors: Depreciation is non-cash, so a rental often shows a tax loss while cash-flowing — sheltering income. Rental losses are passive: they offset passive income freely, and up to $25,000/yr can offset ordinary (W-2) income if you actively participate and your MAGI is under $100k (phasing out to $0 by $150k); unused losses carry forward. On sale, claimed depreciation is recaptured at up to 25%, and gains may owe capital-gains tax (a 1031 exchange can defer both). Figures are a year-1 estimate at your 24.0% rate — not tax advice; consult a CPA.
Schools (NCES district)
- District
- Grand Prairie ISD
- NCES district ID
- 4821420
- Math proficiency
- 29% ▼ -21.00%
- Reading proficiency
- 35% ▼ -8.00%
- Median HH income
- $51,094
- Composite
- 27.95/100
- National rank
- #6861
- State rank
- #572 of 826 in TX
Livability — Grand Prairie
- Score
- 80/100
- State rank
- #33
- US rank
- #1660
Category grades
Schools grade is shown separately in the Schools card above.
Census & demographics
- Census place
- Grand Prairie, TX
- County
- Dallas County · 2,612,404 people
- City population
- 201,439
- Metro
- Dallas-Fort Worth-Arlington, TX
- Population (ZIP)
- 44,889
- Household income
- $73,274
- Rent vs Own
- Severe rent burden
- 2234.0
Population outlook (Dallas County) Hauer SSP2
- Today (2025)
- 2,979,839 people
- By 2030
- 3,191,823 · +7.1%
- By 2040
- 3,619,611 · +21.5%
- By 2050
- 4,026,915 · +35.1%
- By 2075
- 4,957,073 · +66.4%
- By 2100
- 5,508,725 · +84.9%
Race, ethnicity, and origin ACS 2023
- Neighborhood character
- Diverse neighborhood (Simpson 0.60)
- Race & ethnicity
- Hispanic / Latino 57% White 21% Black 18% Two or more races 16% Asian 2% Native American 1%
- Hispanic origin (detail)
- Mexican 48%
- Common ancestry
- Romanian 1% Slovak 1% Lithuanian 1%
- Foreign-born
- 24% · Canada
- Languages at home
- 49% English-only · Spanish 46% Other Indo-European 1%
Political lean MEDSL · Dallas
- 2024 margin
- Strong D (+22.2) · D 60.2% · R 38.0% · Other 1.8%
- 2008→2024 swing
- +6.9pp toward D · 2008: 15.3pp · 2024: 22.2pp
- All cycles
- 2024: D+22.2 2020: D+31.6 2016: D+26.2 2012: D+15.4 2008: D+15.3
Not yet ingested
- Civics
- —
Market trends
- HPI YoY
- ▼ -135.57%
- Current HPI
- 350.9397
- Rent YoY
- ▲ 1.00%
- Metro
- Dallas-Fort Worth-Arlington, TX
- State GDP YoY
- ▲ 3.95%
- F500 in state
- 110
Industry mix (Fortune 500 HQ in TX)
| Industry | F500 HQs | Revenue |
|---|---|---|
| Energy | 16 | $1,198B |
|
||
| Technology | 5 | $198B |
|
||
| Engineering / Construction | 4 | $72B |
|
||
| Energy Services | 3 | $60B |
|
||
| Utilities | 3 | $41B |
|
||
| Healthcare | 2 | $330B |
|
||
Price history
2 events — show timeline
- 2026-05-28 Pending — NTREIS
- 2026-05-27 Listed $125,000 NTREIS
Property tax history
+7.2%/yrLatest (2025): $3,468 · -8.9% YoY. Source: county tax records.
Cash-flow waterfall
monthlySold comps — $/sqft
last 12 mo · ≤1 miLoading sold comps…