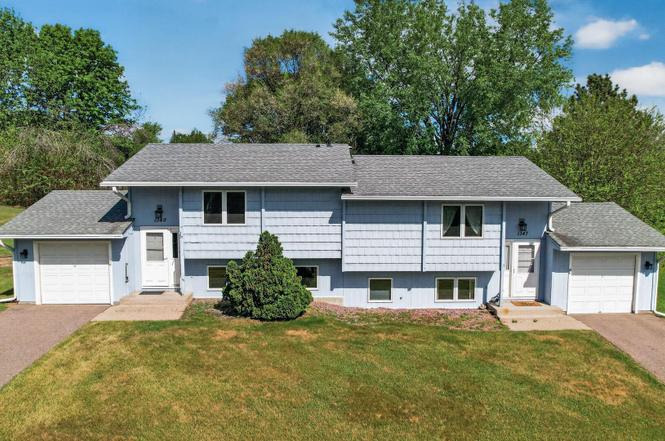
 Duplex
1349 Easter Ln · Eagan, MN
Flood risk 1/10 · Minimal
- FEMA flood zone
- X (unshaded)
- Chance of flooding over 30 yrs
- 0.0%
- Est. flood insurance / yr
- $507 – $1,088
Fire risk 1/10 · Minimal
- Est. fire insurance / yr
- $888 – $1,650
Heat risk 2/10 · Minimal
- Hot days now (above 100°F)
- 7 days/yr
- Hot days in 30 yrs
- 14 days/yr
Wind risk 2/10 · Minimal
- Chance of severe wind over 30 yrs
- —
Air-quality risk 2/10 · Minimal
- Unhealthy air days now
- 1 days/yr
- Unhealthy air days in 30 yrs
- 1 days/yr
Risk factors via First Street. Map © Google.
Why this score? — see what drove the D grade
The composite is a weighted blend of 9 inputs, each scored 0–100. Each bar is that input's sub-score; the figure is the points it added to the 100-point composite (weight × sub-score).
- Cash flow +13.0/30.0
- ARV discount +7.5/15.0
- Schools +4.9/10.0
- Livability +4.3/5.0
- DSCR +3.9/10.0
- Rent growth +3.3/5.0
- 1% rule +3.1/10.0
- Condition / age +2.5/5.0
- Appreciation +0.0/10.0
$460,000
🖨 Deal sheet (PDF) 📄 Offer letter ✓ Due diligence
Multi-family units
County records classify this as Multi-Family (2-4 Unit). Listing-text estimate: 2 units. confirmed
Key facts
- 0.66 acre lot
- 2 garage spots
- Built 1975
Property features AI
Finance
- Other: Total living area approximately 2,098 square feet (1,049 per unit); Lot roughly 0.661 acres
Exterior
- Parking: Detached or attached garage with 2 garage spaces
- Utilities: City water connected; City sewer connected; Natural gas fuel
- Home design: Residential income property — duplex side-by-side; Split entry (bi-level) with two levels; Not owner-occupied
- Construction: Block foundation
- Exterior features: No fencing; Curbed road frontage
Interior
- Kitchen: Cooktop; Dishwasher; Microwave; Range; Refrigerator
- Bedrooms: Six total bedrooms (three in each unit)
- Bathrooms: Each unit has 2 bathrooms (1 full and 1 half)
- Heating & cooling: Forced air heating; Central air conditioning
- Interior features: Full basement; Split entry (bi-level) layout; Two units (duplex side-by-side)
- Laundry & utility: In-unit laundry (washer and dryer listed); Water heater (Electric in one unit, Gas in the other); Owned water softener
Neighborhood map
What this means for you Summary
Snapshot
- This is a 2 × 3-bed/2.0-bath units multifamily listed at $460k.
Deal economics
- At list price, monthly cash flow is $-28 ($-334/yr) — negative. Per door: $-14/mo.
- To cash-flow at today's rent, offer at most $455k (1.1% below list).
- To meet the 1% rule (rent ≥ 1% of price), the offer needs to be $372k (19.0% below list).
- Recommended offer: $372k (19.0% below list) — sets the bar for 1% rule.
- Cap rate 6.2% vs local median 3.3% in Eagan — top-decile yield for the area; either an underpriced asset or a hidden risk that comps aren't pricing in. Stress-test before assuming the spread holds.
Location & tenants
- Location reads 86/100 on livability (#13 in MN, #418 nationally) — a professional / high-income tenant draw. Strengths: commute A+, employment A+, housing A+; Watch: cost of living D+, amenities F.
- Rosemount-Apple Valley-Eagan (suburban): math 50% / reading 58% proficiency, ranked #58 of 301 in MN (top 19%) — acceptable for families but not a draw, mixed tenant base, ~2y average lease; only 18% free/reduced lunch — higher-income household profile.
- Zoned schools: Northview Elementary (math 50% / reading 52%, grade C-, #406 of 857 statewide, top 48%, 391 students, 24% FRL); Black Hawk Middle (math 42% / reading 58%, grade C, #77 of 258 statewide, top 31%, 894 students, 43% FRL); Eagan Senior High (math 54% / reading 77%, grade B, #26 of 471 statewide, top 5%, 2,171 students, 23% FRL).
- Market conditions: Rents rising (+3.1%/yr); 140 active listings in the ZIP; high-income renter base; 2,134 units permitted in Dakota County in 2024 (898 in 5+ unit buildings).
- This rent runs 32% of the median local income ($139k/yr) — at the standard rent-burdened threshold; future hikes will face affordability resistance.
Forward outlook
- Local home prices are declining (-3.0%/yr); year-one equity from $3k of loan paydown is wiped out by about $14k of value loss. Plan a longer hold.
- Dakota County population projected at +11% by 2050 — modest demand growth; plan on rents tracking national, not racing it.
Negotiation context
- Only 13 days on market — expect competitive offers; lowballing is unlikely to land.
Questions for the listing agent
- What do current leases actually rent for vs. the listed asking? Can we see a recent rent roll and the last 12 months of T-12 income?
- Can we see the unit-by-unit rent roll, current vacancy, and any below-market leases? What's the average tenancy length?
- What capital expenditures (roof, boiler, parking lot, exteriors) have been made in the last 5 years, and what's planned in the next 2?
- Built in 1975 — when were the roof, HVAC, electrical panel, plumbing, and water heater last replaced?
- Is there a deadline driving the sale (1031 exchange, divorce, estate, relocation)? That informs how much negotiation room exists.
- Schools are A-rated — typically a magnet for longer-tenancy family renters. What's the average tenant stay here, and is there a school-zone premium baked into asking?
- The area grade is low — what's the realistic commute time and amenity access for the typical tenant pool here? Any planned neighborhood developments (good or bad) we should know about?
- What's the average days-on-market for RENTAL listings here right now (not sales)? A rising rental-DOM trend means longer vacancies and softer asking-rent achievability than the comps imply.
- What's the recent tenant-quality profile in this submarket — average credit score on applications, eviction rate, late-payment / NSF rate, and stable-employment percentage? A property-management company in the area should have these aggregated.
- How much new apartment / multifamily construction is in the pipeline within 1–3 miles? Heavy new supply (>2% of stock underway) typically softens rents 12–24 months out; light construction supports rent growth.
Investment metrics
- 1% rule
- 0.81% ✗
- Cap rate
- 6.22%
- Cash-on-cash
- -0.26%
- DSCR
- 0.99
- GRM
- 10.3
CMA / ARV
No comps found within radius.
Projected returns pro-forma
-3.0% appreciation · 3.08% rent growth · sell at horizon
- IRR
- -16.7%
- Equity multiple
- 0.41×
- Total profit
- $-76,085
- Equity at exit
- $68,587
- IRR
- -8.4%
- Equity multiple
- 0.48×
- Total profit
- $-67,596
- Equity at exit
- $39,772
Cash invested: $128,800 (down + closing). Projections, not guarantees.
Landlord ↔ Tenant lean methodology
- Overall (STATE)
- 46 Balanced
- State Minnesota
- 46 Balanced · D+2
- County
- — inherits STATE
- City
- — inherits STATE
ZIP-level market 55123
- Rents YoY
- 3.1%
- Active inventory
- 140
- Price-to-rent
- 20.6×
Monthly cashflow live
- Estimated rent
- $3,724 medium interval (Pro) →
- Mortgage (P&I)
- −$2,412
- Tax from tax record
- −$366 /mo · $4,390/yr
- Insurance
- −$192
- HOA
- −$0
- Vacancy / Maint / Mgmt
- −$782
- Net cashflow
- $-28
Break-even live
Sensitivity live
| Price | -10% $233 | -5% $102 | +0% $-28 | +5% $-158 | +10% $-288 |
|---|---|---|---|---|---|
| Rent | -10% $-322 | -5% $-175 | +0% $-28 | +5% $119 | +10% $266 |
| Rate | -1.0pp $204 | -0.5pp $89 | base $-28 | +0.5pp $-147 | +1.0pp $-268 |
2-unit breakdown (identical units grouped — click to expand)
| Units | Beds | Baths | Est. rent |
|---|---|---|---|
| 2× units | 3 | 2 | $3,724 |
| #1 | 3 | 2 | $1,862 |
| #2 | 3 | 2 | $1,862 |
| Total (2 units) | $3,724 | ||
UW: 25.0% down · 7.5% · 30yr · 1.5% tax · 5.0% vac · 8.0% maint · 8.0% mgmt
Financing live
Cash to close
- Down payment
- $115,000
- Closing costs
- $13,800
- Reserves months
- —
- Total cash needed
- —
Loan-product check · same deal, 3 products live
Conventional
25% down · 7.5% · 30yr
- Down + closing
- —
- Monthly P&I
- —
- Monthly cashflow
- —
- DSCR
- —
- Eligible?
- —
Personal DTI + credit; lowest rate.
DSCR
20% down · 8.5% · 30yr
- Down + closing
- —
- Monthly P&I
- —
- Monthly cashflow
- —
- DSCR
- —
- Eligible?
- —
No personal income docs; deal must DSCR.
Hard money
10% down · 12.0% · 12mo
- Down + closing
- —
- Monthly P&I
- —
- Monthly cashflow
- —
- DSCR
- —
- Eligible?
- —
Short-term bridge; refi at stabilization.
Listing history 12 events
-
2026-06-08statusdays on market $460,000 Pending 13 DOM
-
2026-06-07days on market $460,000 Contingent - Inspection 12 DOM
-
2026-06-04days on market $460,000 Contingent - Inspection 9 DOM
-
2026-06-03days on market $460,000 Contingent - Inspection 8 DOM
-
2026-06-02days on market $460,000 Contingent - Inspection 7 DOM
-
2026-06-01days on market $460,000 Contingent - Inspection 6 DOM
-
2026-06-01status $460,000 Contingent - Inspection 5 DOM
-
2026-05-31days on market $460,000 Active 5 DOM
-
2026-05-22historical $460,000
-
2026-05-22price $460,000
-
2026-02-26historical
-
2026-02-25$440,000
ⓘ Source: listings_history table (triggers on properties + properties_extension) + one-shot
backfill from property_details.listing_events for pre-trigger history.
Tax reassessment forecast MN · Partial reset (capped growth)
- Current annual tax
- $4,390 · $366/mo
- Projected year-2 tax
- $4,771 · $398/mo
- Expected delta
- +$381/yr (+$32/mo · 8.7%)
ⓘ Screening estimate from a state-policy table — verify with the county assessor before closing.
Climate risk First Street
- Flood 1/10 Low FEMA zone X (unshaded) · 0% chance over 30 yrs
- Wildfire 1/10 Low
- Heat 2/10 Low 7 d/yr ≥100°F today · 14 d/yr by 30 yrs out
- Wind 2/10 Low
- Air quality 2/10 Low 1 unhealthy d/yr today · 1 by 30 yrs out
Nearby sold comps map
Loading sold comps map…
Walkable amenities ~0.75 mi
Loading nearby amenities…
Taxation est. · year 1
- Rental income
- $44,688
- − Mortgage interest
- −$25,767
- − Property taxes
- −$4,390
- − Insurance
- −$2,300
- − Repairs & maintenance
- −$3,575
- − Management
- −$3,575
- − Depreciation
- −$13,382
- Taxable loss
- −$8,301
- Est. tax savings @ 24.0%
- +$1,992
- After-tax cash flow
- $1,658/yr
For passive investors: Depreciation is non-cash, so a rental often shows a tax loss while cash-flowing — sheltering income. Rental losses are passive: they offset passive income freely, and up to $25,000/yr can offset ordinary (W-2) income if you actively participate and your MAGI is under $100k (phasing out to $0 by $150k); unused losses carry forward. On sale, claimed depreciation is recaptured at up to 25%, and gains may owe capital-gains tax (a 1031 exchange can defer both). Figures are a year-1 estimate at your 24.0% rate — not tax advice; consult a CPA.
Schools (NCES district)
- District
- Rosemount-Apple Valley-Eagan
- NCES district ID
- 2732390
- Math proficiency
- 50% ▼ -14.00%
- Reading proficiency
- 58% ▼ -7.00%
- Median HH income
- $85,559
- Composite
- 49.48/100
- National rank
- #2000
- State rank
- #58 of 301 in MN
Livability — Eagan
- Score
- 86/100
- State rank
- #13
- US rank
- #418
Category grades
Schools grade is shown separately in the Schools card above.
Census & demographics
- Census place
- Eagan, MN
- County
- Dakota County · 417,704 people
- City population
- 67,960
- Metro
- Minneapolis-St. Paul-Bloomington, MN-WI
- Population (ZIP)
- 26,501
- Household income
- $139,215
- Rent vs Own
- Severe rent burden
- 376.0
Population outlook (Dakota County) Hauer SSP2
- Today (2025)
- 450,671 people
- By 2030
- 465,068 · +3.2%
- By 2040
- 486,770 · +8.0%
- By 2050
- 498,743 · +10.7%
- By 2075
- 533,865 · +18.5%
- By 2100
- 550,133 · +22.1%
Race, ethnicity, and origin ACS 2023
- Neighborhood character
- Predominantly White (77%)
- Race & ethnicity
- White 77% Asian 10% Hispanic / Latino 6% Two or more races 6% Black 3%
- Hispanic origin (detail)
- Mexican 4%
- Common ancestry
- Portuguese 12% Italian 5% Romanian 4%
- Foreign-born
- 12% · Canada, South Korea, China
- Languages at home
- 86% English-only · Spanish 4% Other Asian/Pacific 4% Other Indo-European 2%
Political lean MEDSL · Dakota
- 2024 margin
- D (+12.9) · D 55.4% · R 42.5% · Other 2.1%
- 2008→2024 swing
- +7.4pp toward D · 2008: 5.5pp · 2024: 12.9pp
- All cycles
- 2024: D+12.9 2020: D+13.9 2016: D+4.7 2012: D+2.9 2008: D+5.5
Not yet ingested
- Civics
- —
Market trends
- HPI YoY
- ▼ -172.93%
- Current HPI
- 214.1028
- Rent YoY
- ▲ 3.08%
- Metro
- Minneapolis-St. Paul-Bloomington, MN-WI
- State GDP YoY
- ▲ 2.41%
- F500 in state
- 34
Industry mix (Fortune 500 HQ in MN)
| Industry | F500 HQs | Revenue |
|---|---|---|
| Healthcare | 2 | $407B |
|
||
| Retail | 2 | $150B |
|
||
| Consumer Goods | 2 | $32B |
|
||
| Industrial Machinery | 2 | $6B |
|
||
| Agriculture | 1 | $40B |
|
||
| Healthcare / Medical Devices | 1 | $32B |
|
||
Price history
+4.5% since first listed4 events — show timeline
- 2026-05-22 Coming Soon $460,000 NORTHSTARMLS as Distributed by MLS Grid
- 2026-05-22 Price Changed $460,000 NORTHSTARMLS as Distributed by MLS Grid
- 2026-02-26 Listing Removed — NORTHSTARMLS as Distributed by MLS Grid
- 2026-02-25 Listed $440,000 NORTHSTARMLS as Distributed by MLS Grid
Property tax history
+3.3%/yrLatest (2025): $4,390 · -0.9% YoY. Source: county tax records.
Cash-flow waterfall
monthlySold comps — $/sqft
last 12 mo · ≤1 miLoading sold comps…