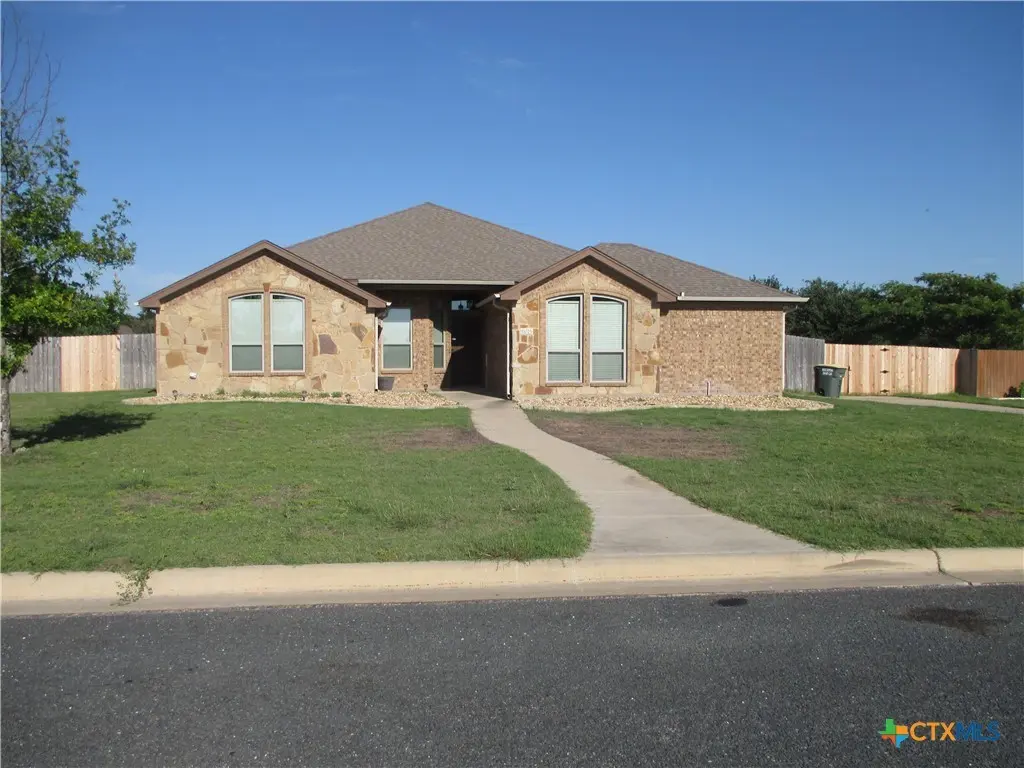
11025 La Paloma Loop West · Salado, TX
Flood risk 1/10 · Minimal
- FEMA flood zone
- X (unshaded)
- Chance of flooding over 30 yrs
- 0.0%
- Est. flood insurance / yr
- $507 – $1,088
Fire risk 6/10 · Moderate
- Est. fire insurance / yr
- $1,222 – $2,270
Heat risk 8/10 · Major
- Hot days now (above 108°F)
- 7 days/yr
- Hot days in 30 yrs
- 24 days/yr
Wind risk 6/10 · Moderate
- Chance of severe wind over 30 yrs
- 71.0%
Air-quality risk 2/10 · Minimal
- Unhealthy air days now
- 0 days/yr
- Unhealthy air days in 30 yrs
- 1 days/yr
Risk factors via First Street. Map © Google.
Why this score? — see what drove the D- grade
The composite is a weighted blend of 9 inputs, each scored 0–100. Each bar is that input's sub-score; the figure is the points it added to the 100-point composite (weight × sub-score).
- ARV discount +15.0/15.0
- Cash flow +7.6/30.0
- Schools +4.4/10.0
- Livability +3.8/5.0
- 1% rule +2.5/10.0
- Rent growth +2.5/5.0
- Condition / age +2.5/5.0
- DSCR +1.7/10.0
- Appreciation +0.0/10.0
$465,000
🖨 Deal sheet (PDF) 📄 Offer letter ✓ Due diligence
Key facts
- 0.52 acre lot
- 2 garage spots
- Built 2016
Property features AI
Finance
- HOA & community: Located in a community with an HOA (La Paloma); Annual HOA fee of $175; Community features include curbs and gutters
Exterior
- Parking: 2-car garage; Garage faces side
- Utilities: Public water; Public sewer (also notes septic tank / not connected at lot listed); Electric service
- Home design: Single-story home; Faces west; Resale property; Slab foundation
- Construction: Brick and masonry construction; Composition shingle roof; Built according to assessor records
- Exterior features: Covered patio; Patio and porch (covered); Porch; Fire pit; Private yard; Back yard fencing with gate; Picket and privacy wood fencing; Sprinklers in front and rear (automatic/in-ground); Level, open lot; Outside city limits; Roads are paved/asphalt
Interior
- Kitchen: Down draft; Dishwasher; Electric cooktop; Exhaust fan; Oven; Range hood; Disposal; Microwave; Stone/granite counters; Custom cabinets; Pantry; Kitchen open to family and dining areas; Breakfast bar
- Bedrooms: Bedrooms located on the main level
- Flooring: Carpet; Tile
- Bathrooms: 2 full bathrooms; 1 half bathroom; Double vanities; Garden/roman tub and soaking tub; Separate shower
- Heating & cooling: Central heating and cooling; Electric heating and cooling; Heat pump; Fireplace(s) providing supplementary heat; One cooling unit
- Interior features: All bedrooms on the main level; Breakfast bar; Built-in features; Ceiling fans; Double vanities; Garden/roman tub; High ceilings; His and hers closets; Multiple closets; Open floorplan; Stone counters; Split bedroom layout; Soaking tub; Separate shower; Walk-in closets; WaterSense fixtures; Custom cabinets; Granite counters; Kitchen/family room combo; Kitchen/dining combo; Pantry
- Laundry & utility: Washer hookup; Electric dryer hookup; Inside laundry room; Electric water heater
Neighborhood map
What this means for you Summary
Snapshot
- This is a 4-bed/2.5-bath single-family listed at $465k.
Deal economics
- At list price, monthly cash flow is $-552 ($-7k/yr) — negative.
- To cash-flow at today's rent, offer at most $367k (21.0% below list).
- To meet the 1% rule (rent ≥ 1% of price), the offer needs to be $350k (24.7% below list).
- Recommended offer: $350k (24.7% below list) — sets the bar for 1% rule.
- Cap rate 4.9% vs local median 2.4% in Salado — top-decile yield for the area; either an underpriced asset or a hidden risk that comps aren't pricing in. Stress-test before assuming the spread holds.
Location & tenants
- Location reads 75/100 on livability (#153 in TX, #4,224 nationally) — a middle-class / working-renter tenant base. Strengths: crime A+, employment A+, housing A+; Watch: amenities F, commute F, health & safety F.
- Salado ISD (rural): math 44% / reading 51% proficiency, ranked #164 of 826 in TX (top 20%) — families likely to look elsewhere, expect single-tenant / working-renter base with shorter leases.
- Zoned schools: Salado Middle (math 50% / reading 48%, grade C-, #378 of 1,662 statewide, top 23%, 591 students, 28% FRL); Salado H S (math 42% / reading 62%, grade D+, #447 of 1,632 statewide, top 29%, 716 students, 22% FRL) — zoned schools at 25% FRL track the district average.
- Market conditions: 502 active listings in the ZIP; 1 comparable units currently listed for rent nearby; 3,222 units permitted in Bell County in 2024 (246 in 5+ unit buildings).
Forward outlook
- Local home prices are declining (-3.0%/yr); year-one equity from $3k of loan paydown is wiped out by about $14k of value loss. Plan a longer hold.
- Bell County population projected at +21% by 2050 — long-run rental-demand tailwind backs the buy-and-hold thesis.
Negotiation context
- It's been on market 37 days — a 3% lower offer ($451k) is reasonable based on typical stale-listing flexibility.
- 2 sale attempts since 6y ago with the ask held roughly flat each time — persistent listings suggest the price (not the market) is what's stuck; bring a comps-based counter.
Risks & watch-outs
- Climate carrying-cost: major wind risk, 71% chance of damaging wind over 30y; major wildfire risk; extreme-heat days projected 7→24/yr by 2055 (HVAC capex compounding) — expect insurance premiums to compound above CPI over the hold.
Questions for the listing agent
- What do current leases actually rent for vs. the listed asking? Can we see a recent rent roll and the last 12 months of T-12 income?
- It's been on market 37 days. Have you received any prior offers? Is the seller open to a 25% concession, seller financing, or rate buy-down credit?
- What does the HOA fee cover, when was the last increase, and are there any pending special assessments or reserve-fund shortfalls?
- Is there a deadline driving the sale (1031 exchange, divorce, estate, relocation)? That informs how much negotiation room exists.
- Schools are B-rated — typically a magnet for longer-tenancy family renters. What's the average tenant stay here, and is there a school-zone premium baked into asking?
- The area grade is low — what's the realistic commute time and amenity access for the typical tenant pool here? Any planned neighborhood developments (good or bad) we should know about?
- What's the average days-on-market for RENTAL listings here right now (not sales)? A rising rental-DOM trend means longer vacancies and softer asking-rent achievability than the comps imply.
- What's the recent tenant-quality profile in this submarket — average credit score on applications, eviction rate, late-payment / NSF rate, and stable-employment percentage? A property-management company in the area should have these aggregated.
- How much new for-sale + rental construction is in the pipeline within 1–3 miles? Heavy new supply typically softens prices + rents 12–24 months out; constrained supply supports both.
Investment metrics
- 1% rule
- 0.75% ✗
- Cap rate
- 4.87%
- Cash-on-cash
- -5.09%
- DSCR
- 0.77
- GRM
- 11.1
CMA / ARV
- ARV (median comp)
- $559,567
- List price
- $465,000
- Delta
- -16.90%
- Verdict
- UNDERPRICED
- Comps
- 20 within 1.0 mi
Show comp detail 2 sales within ~0.75 mi
| Address | Dist | Beds/Ba | Sqft | Sold | Price | $/sf | Match |
|---|---|---|---|---|---|---|---|
| 6321 Beau Allen Ct | 0.68mi | 3/2.0 (-1) | 1,853 (-3%) | 14mo | $495,000 | $267 | 44 |
| 4036 Aerie St | 0.58mi | 4/2.0 | 2,125 (+11%) | 23mo | $510,000 | $240 | 33 |
Match score weights: distance 35% · size 25% · config 20% · recency 20%. Top-matched comps best support the ARV.
Projected returns pro-forma
-3.0% appreciation · 3.0% rent growth · sell at horizon
- IRR
- -24.9%
- Equity multiple
- 0.15×
- Total profit
- $-110,404
- Equity at exit
- $69,333
- IRR
- -20.7%
- Equity multiple
- -0.08×
- Total profit
- $-140,952
- Equity at exit
- $40,205
Cash invested: $130,200 (down + closing). Projections, not guarantees.
Landlord ↔ Tenant lean methodology
- Overall (STATE)
- 87 Strongly Landlord-Friendly
- State Texas
- 87 Strongly Landlord-Friendly · R+5
- County
- — inherits STATE
- City
- — inherits STATE
ZIP-level market 76571
- Home prices YoY
- -23.3%
- Active inventory
- 502
- Price-to-rent
- 11.1×
Monthly cashflow live
- Estimated rent
- $3,500 medium interval (Pro) →
- Mortgage (P&I)
- −$2,439
- Tax from tax record
- −$670 /mo · $8,039/yr
- Insurance
- −$194
- HOA
- −$15
- Vacancy / Maint / Mgmt
- −$735
- Net cashflow
- $-552
Break-even live
Sensitivity live
| Price | -10% $-289 | -5% $-421 | +0% $-552 | +5% $-684 | +10% $-815 |
|---|---|---|---|---|---|
| Rent | -10% $-829 | -5% $-690 | +0% $-552 | +5% $-414 | +10% $-276 |
| Rate | -1.0pp $-318 | -0.5pp $-434 | base $-552 | +0.5pp $-673 | +1.0pp $-795 |
UW: 25.0% down · 7.5% · 30yr · 1.5% tax · 5.0% vac · 8.0% maint · 8.0% mgmt
Financing live
Cash to close
- Down payment
- $116,250
- Closing costs
- $13,950
- Reserves months
- —
- Total cash needed
- —
Loan-product check · same deal, 3 products live
Conventional
25% down · 7.5% · 30yr
- Down + closing
- —
- Monthly P&I
- —
- Monthly cashflow
- —
- DSCR
- —
- Eligible?
- —
Personal DTI + credit; lowest rate.
DSCR
20% down · 8.5% · 30yr
- Down + closing
- —
- Monthly P&I
- —
- Monthly cashflow
- —
- DSCR
- —
- Eligible?
- —
No personal income docs; deal must DSCR.
Hard money
10% down · 12.0% · 12mo
- Down + closing
- —
- Monthly P&I
- —
- Monthly cashflow
- —
- DSCR
- —
- Eligible?
- —
Short-term bridge; refi at stabilization.
Rent comps 1 comps
| Address | Beds | Baths | Sqft | Rent | $/sqft | DOM | Units | Dist |
|---|---|---|---|---|---|---|---|---|
| 4848 FM 2484 Salado, TX | 5.0 | 3.0 | 1823 | $3,500 | $1.92 | 23d | 1 | 0.36mi |
HOA detail
- Monthly dues
- $15 · $180/yr
Listing history 22 events
-
2026-06-22days on market $465,000 Active 37 DOM
-
2026-06-18days on market $465,000 Active 34 DOM
-
2026-06-17days on market $465,000 Active 33 DOM
-
2026-06-16days on market $465,000 Active 32 DOM
-
2026-06-15days on market $465,000 Active 31 DOM
-
2026-06-14days on market $465,000 Active 29 DOM
-
2026-06-13days on market $465,000 Active 28 DOM
-
2026-06-10days on market $465,000 Active 26 DOM
-
2026-06-09days on market $465,000 Active 25 DOM
-
2026-06-08days on market $465,000 Active 24 DOM
-
2026-06-07days on market $465,000 Active 23 DOM
-
2026-06-03days on market $465,000 Active 19 DOM
-
2026-06-02days on market $465,000 Active 18 DOM
-
2026-06-01days on market $465,000 Active 17 DOM
-
2026-05-31days on market $465,000 Active 16 DOM
-
2026-05-30days on market $465,000 Active 15 DOM
-
2026-05-13$465,000 Active
-
2020-05-19soldstatus
-
2020-05-06status Pending
-
2020-05-03price $318,000
-
2020-04-25$320,000 Active
-
2015-12-01soldstatus
ⓘ Source: listings_history table (triggers on properties + properties_extension) + one-shot
backfill from property_details.listing_events for pre-trigger history.
Tax reassessment forecast TX · Resets to sale price
- Current annual tax
- $8,039 · $670/mo
- Projected year-2 tax
- $8,510 · $709/mo
- Expected delta
- +$470/yr (+$39/mo · 5.8%)
ⓘ Screening estimate from a state-policy table — verify with the county assessor before closing.
Climate risk First Street
- Flood 1/10 Low FEMA zone X (unshaded) · 0% chance over 30 yrs
- Wildfire 6/10 Major
- Heat 8/10 Severe 7 d/yr ≥108°F today · 24 d/yr by 30 yrs out
- Wind 6/10 Major 71% chance of damaging wind over 30 yrs
- Air quality 2/10 Low 0 unhealthy d/yr today · 1 by 30 yrs out
Nearby sold comps map
Loading sold comps map…
Walkable amenities ~0.75 mi
Loading nearby amenities…
Taxation est. · year 1
- Rental income
- $42,000
- − Mortgage interest
- −$26,047
- − Property taxes
- −$8,039
- − Insurance
- −$2,325
- − Repairs & maintenance
- −$3,360
- − Management
- −$3,360
- − HOA
- −$180
- − Depreciation
- −$13,527
- Taxable loss
- −$14,839
- Est. tax savings @ 24.0%
- +$3,561
- After-tax cash flow
- $-3,065/yr
For passive investors: Depreciation is non-cash, so a rental often shows a tax loss while cash-flowing — sheltering income. Rental losses are passive: they offset passive income freely, and up to $25,000/yr can offset ordinary (W-2) income if you actively participate and your MAGI is under $100k (phasing out to $0 by $150k); unused losses carry forward. On sale, claimed depreciation is recaptured at up to 25%, and gains may owe capital-gains tax (a 1031 exchange can defer both). Figures are a year-1 estimate at your 24.0% rate — not tax advice; consult a CPA.
Schools (NCES district)
- District
- Salado ISD
- NCES district ID
- 4838580
- Math proficiency
- 44% ▼ -8.00%
- Reading proficiency
- 51% ▼ -5.00%
- Median HH income
- $79,906
- Composite
- 43.55/100
- National rank
- #2983
- State rank
- #164 of 826 in TX
Livability — Salado
- Score
- 75/100
- State rank
- #153
- US rank
- #4224
Category grades
Schools grade is shown separately in the Schools card above.
Census & demographics
- Population (ZIP)
- 9,454
Population outlook (Bell County) Hauer SSP2
- Today (2025)
- 371,114 people
- By 2030
- 389,104 · +4.8%
- By 2040
- 420,592 · +13.3%
- By 2050
- 447,779 · +20.7%
- By 2075
- 499,130 · +34.5%
- By 2100
- 505,680 · +36.3%
Race, ethnicity, and origin ACS 2023
- Neighborhood character
- Predominantly White (79%)
- Race & ethnicity
- White 79% Hispanic / Latino 15% Two or more races 7% Black 2%
- Hispanic origin (detail)
- Mexican 11% Puerto Rican 1%
- Common ancestry
- Iranian 2% Slovak 2% Lithuanian 2%
- Foreign-born
- 7% · Canada
- Languages at home
- 90% English-only · Spanish 9% Russian/Polish/Slavic 1%
Political lean MEDSL · Bell
- 2024 margin
- R (+16.2) · D 41.3% · R 57.6% · Other 1.1%
- 2008→2024 swing
- -6.5pp toward R · 2008: -9.8pp · 2024: -16.2pp
- All cycles
- 2024: R+16.2 2020: R+8.5 2016: R+15.1 2012: R+16.4 2008: R+9.8
Not yet ingested
- Civics
- —
Market trends
- HPI YoY
- ▼ -60.95%
- Current HPI
- 200.4704
- Rent YoY
- —
- Metro
- —
- State GDP YoY
- ▲ 3.95%
- F500 in state
- 110
Industry mix (Fortune 500 HQ in TX)
| Industry | F500 HQs | Revenue |
|---|---|---|
| Energy | 16 | $1,198B |
|
||
| Technology | 5 | $198B |
|
||
| Engineering / Construction | 4 | $72B |
|
||
| Energy Services | 3 | $60B |
|
||
| Utilities | 3 | $41B |
|
||
| Healthcare | 2 | $330B |
|
||
Price history
+45.3% since first listed6 events — show timeline
- 2026-05-13 Listed $465,000 CTXMLS
- 2020-05-19 Sold (Public Records) — Public Records
- 2020-05-06 Pending — CTXMLS
- 2020-05-03 Price Changed $318,000 CTXMLS
- 2020-04-25 Listed $320,000 CTXMLS
- 2015-12-01 Sold (Public Records) — Public Records
Property tax history
+30.3%/yrLatest (2026): $8,039 · +5.2% YoY. Source: county tax records.
Cash-flow waterfall
monthlySold comps — $/sqft
last 12 mo · ≤1 miLoading sold comps…