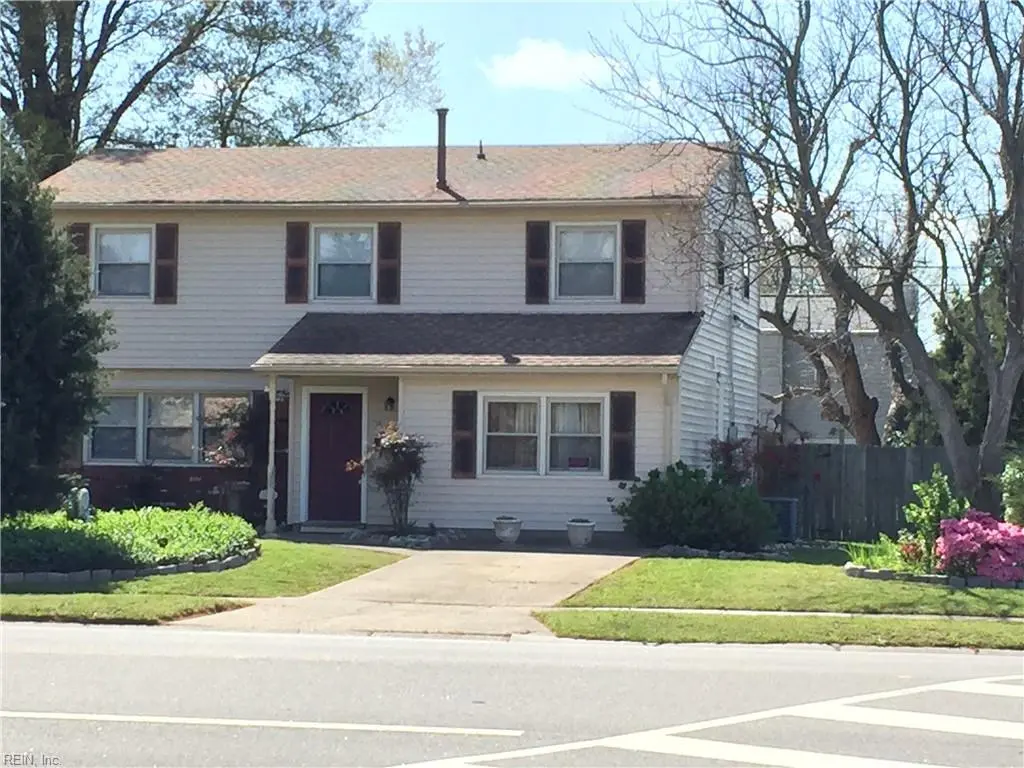
701 S Lynnhaven Rd · Virginia Beach, VA
Flood risk 1/10 · Minimal
- FEMA flood zone
- X (unshaded)
- Chance of flooding over 30 yrs
- 0.0%
- Est. flood insurance / yr
- $507 – $1,088
Fire risk 1/10 · Minimal
- Est. fire insurance / yr
- $666 – $1,236
Heat risk 9/10 · Severe
- Hot days now (above 105°F)
- 7 days/yr
- Hot days in 30 yrs
- 17 days/yr
Wind risk 8/10 · Major
- Chance of severe wind over 30 yrs
- 99.0%
Air-quality risk 3/10 · Minor
- Unhealthy air days now
- 2 days/yr
- Unhealthy air days in 30 yrs
- 4 days/yr
Risk factors via First Street. Map © Google.
Why this score? — see what drove the D+ grade
The composite is a weighted blend of 9 inputs, each scored 0–100. Each bar is that input's sub-score; the figure is the points it added to the 100-point composite (weight × sub-score).
- ARV discount +12.9/15.0
- Cash flow +11.1/30.0
- Schools +6.4/10.0
- Livability +4.2/5.0
- Rent growth +3.7/5.0
- DSCR +3.2/10.0
- 1% rule +2.5/10.0
- Condition / age +2.5/5.0
- Appreciation +0.0/10.0
$354,900
🖨 Deal sheet 📄 Offer letter ✓ Due diligence
Listing remarks
Ocean Lakes high school-5BR 2Ba 2 story corner lot. Large wood shed. Home is minutes to NAS oceana, town center, oceanfront, Norfolk and interstates. Stroll to Lynnhaven mall. Neighborhood has newer household recreation center. Home is not in a flood zone. Garage converted into living space (300 sq ft) with shower.
Key facts
- Not in a flood zone
- Large wood shed
- Corner lot
Tags
Property features AI
Finance
- Other: Neighborhood: CARRIAGE HILL
- HOA & community: No HOA fees
Exterior
- Parking: Off-street parking for 4 vehicles
- Utilities: City/County water; City/County sewer; Natural gas
- Home design: Detached property; Split-level style; 2 stories; Slab foundation; Simple ownership
- Construction: Brick and vinyl siding; Asphalt shingle roof
- Exterior features: Patio; Back yard with privacy wood fence
Interior
- Kitchen: Range (electric); Dishwasher; Disposal; Refrigerator
- Bedrooms: Bedroom and full bathroom on the first floor; Total rooms: 12
- Flooring: Ceramic; Laminate; Vinyl; Wood
- Bathrooms: 1 full bathroom; 1 half bathroom
- Heating & cooling: Forced hot air heating (natural gas); Central air conditioning; Gas water heater
- Interior features: Attic fan; Main floor laundry; Pocket doors; Stepless entrance; Pantry; In-law suite; Attic
- Laundry & utility: Washer; Dryer; 220V electrical outlet
Neighborhood map
What this means for you Summary
Snapshot
- This is a 5-bed/1.5-bath single-family listed at $355k.
Deal economics
- At list price, monthly cash flow is $-140 ($-2k/yr) — negative.
- To cash-flow at today's rent, offer at most $330k (7.0% below list).
- To meet the 1% rule (rent ≥ 1% of price), the offer needs to be $265k (25.3% below list).
- Recommended offer: $265k (25.3% below list) — sets the bar for 1% rule.
- Cap rate 5.8% vs local median 3.5% in Virginia Beach — top-decile yield for the area; either an underpriced asset or a hidden risk that comps aren't pricing in. Stress-test before assuming the spread holds.
Location & tenants
- Location reads 83/100 on livability (#38 in VA, #880 nationally) — a professional / high-income tenant draw. Strengths: amenities A+, employment A+, housing A+; Watch: cost of living C-, commute F.
- Va Beach City Public School District (urban): math 69% / reading 78% proficiency, ranked #10 of 131 in VA (top 8%) — strong family-tenant draw, lease renewals of 3-5y typical.
- Zoned schools: Brookwood Elementary (math 56% / reading 68%, grade B, #480 of 1,108 statewide, top 46%, 571 students, 66% FRL); Ocean Lakes High (math 73% / reading 89%, grade A, #52 of 319 statewide, top 17%, 1,855 students, 29% FRL) — zoned schools average 48% FRL vs 28% district-wide (19 pts higher); higher-poverty schools than district average — tighter screening recommended.
- Market conditions: Rents rising fast (+4.9%/yr); 226 active listings in the ZIP; 4 comparable units currently listed for rent nearby; rentals at typical pace (median 24d on market — plan ~3-4 weeks tenant-placement turnaround); solid renter incomes; 666 units permitted in Virginia Beach city in 2024 (347 in 5+ unit buildings).
- This rent runs 40% of the median local income ($79k/yr) — at the standard rent-burdened threshold; future hikes will face affordability resistance.
Forward outlook
- Local home prices are declining (-3.0%/yr); year-one equity from $2k of loan paydown is wiped out by about $11k of value loss. Plan a longer hold.
- Virginia Beach County population projected at +6% by 2050 — modest demand growth; plan on rents tracking national, not racing it.
Negotiation context
- It's been on market 86 days — a 6% lower offer ($334k) is reasonable based on typical stale-listing flexibility.
- 3 sale attempts with the ask held roughly flat each time — persistent listings suggest the price (not the market) is what's stuck; bring a comps-based counter.
- Current owner paid $125k; list at $355k implies a 184% gain — meaningful room to come down on a strong offer.
Risks & watch-outs
- Climate carrying-cost: severe wind risk, 99% chance of damaging wind over 30y; extreme-heat days projected 7→17/yr by 2055 (HVAC capex compounding) — expect insurance premiums to compound above CPI over the hold.
Questions for the listing agent
- What do current leases actually rent for vs. the listed asking? Can we see a recent rent roll and the last 12 months of T-12 income?
- It's been on market 86 days. Have you received any prior offers? Is the seller open to a 25% concession, seller financing, or rate buy-down credit?
- Built in 1964 — when were the roof, HVAC, electrical panel, plumbing, and water heater last replaced?
- Why hasn't it sold? Are there any deal-killer items the seller is aware of (foundation, flood, title, zoning, code violations)?
- Is there a deadline driving the sale (1031 exchange, divorce, estate, relocation)? That informs how much negotiation room exists.
- Schools are A-rated — typically a magnet for longer-tenancy family renters. What's the average tenant stay here, and is there a school-zone premium baked into asking?
- The area grade is low — what's the realistic commute time and amenity access for the typical tenant pool here? Any planned neighborhood developments (good or bad) we should know about?
- What's the average days-on-market for RENTAL listings here right now (not sales)? A rising rental-DOM trend means longer vacancies and softer asking-rent achievability than the comps imply.
- What's the recent tenant-quality profile in this submarket — average credit score on applications, eviction rate, late-payment / NSF rate, and stable-employment percentage? A property-management company in the area should have these aggregated.
- How much new for-sale + rental construction is in the pipeline within 1–3 miles? Heavy new supply typically softens prices + rents 12–24 months out; constrained supply supports both.
Investment metrics
- 1% rule
- 0.75% ✗
- Cap rate
- 5.82%
- Cash-on-cash
- -1.69%
- DSCR
- 0.92
- GRM
- 11.2
CMA / ARV
- ARV (on-the-fly)
- $403,104
- Comps found
- 12
Show comp detail 12 sales within ~0.75 mi
| Address | Dist | Beds/Ba | Sqft | Sold | Price | $/sf | Match |
|---|---|---|---|---|---|---|---|
| 804 Stratford Hall Dr | 0.41mi | 5/1.5 | 1,632 (0%) | 1mo | $400,000 | $245 | 80 |
| 721 Burgesses Ln | 0.20mi | 4/2.5 (-1) | 1,650 (+1%) | 2mo | $438,000 | $265 | 78 |
| 725 Burgesses Ln | 0.21mi | 4/3.0 (-1) | 1,650 (+1%) | 4mo | $365,000 | $221 | 74 |
| 816 Lamplight Ln | 0.42mi | 6/1.5 (+1) | 1,632 (0%) | 2mo | $345,000 | $211 | 74 |
| 3141 Ashlawn Ter | 0.36mi | 4/2.5 (-1) | 1,668 (+2%) | 1mo | $430,000 | $258 | 70 |
| 3133 Ashlawn Ter | 0.35mi | 4/2.0 (-1) | 1,600 (-2%) | 5mo | $395,000 | $247 | 70 |
| 2904 Augusta Cir | 0.64mi | 4/2.0 (-1) | 1,647 (+1%) | 1mo | $408,000 | $248 | 61 |
| 301 Bethune Dr | 0.62mi | 4/2.0 (-1) | 1,549 (-5%) | 2mo | $415,000 | $268 | 53 |
| 452 Bethune Dr | 0.67mi | 4/2.0 (-1) | 1,549 (-5%) | 2mo | $395,000 | $255 | 52 |
| 917 Boughton Way | 0.72mi | 4/2.0 (-1) | 1,544 (-5%) | 0mo | $370,000 | $240 | 50 |
| 752 Fox Run Rd | 0.60mi | 4/2.5 (-1) | 1,764 (+8%) | 1mo | $389,900 | $221 | 49 |
| 720 Fox Run Rd | 0.68mi | 4/2.5 (-1) | 1,800 (+10%) | 4mo | $390,000 | $217 | 38 |
Match score weights: distance 35% · size 25% · config 20% · recency 20%. Top-matched comps best support the ARV.
Projected returns pro-forma
-3.0% appreciation · 4.92% rent growth · sell at horizon
- IRR
- -17.2%
- Equity multiple
- 0.38×
- Total profit
- $-61,304
- Equity at exit
- $52,917
- IRR
- -6.3%
- Equity multiple
- 0.57×
- Total profit
- $-42,984
- Equity at exit
- $30,685
Cash invested: $99,372 (down + closing). Projections, not guarantees.
Landlord ↔ Tenant lean methodology
- Overall (STATE)
- 55 Moderately Landlord-Leaning
- State Virginia
- 55 Moderately Landlord-Leaning · D+2
- County
- — inherits STATE
- City
- — inherits STATE
ZIP-level market 23452
- Rents YoY
- 4.9%
- Active inventory
- 226
- Price-to-rent
- 11.2×
Monthly cashflow live
- Estimated rent
- $2,650 medium interval (Pro) →
- Mortgage (P&I)
- −$1,861
- Tax from tax record
- −$225 /mo · $2,695/yr
- Insurance
- −$148
- HOA
- −$0
- Vacancy / Maint / Mgmt
- −$557
- Net cashflow
- $-140
Break-even live
UW: 25.0% down · 7.5% · 30yr · 1.5% tax · 5.0% vac · 8.0% maint · 8.0% mgmt
Financing live
Cash to close
- Down payment
- $88,725
- Closing costs
- $10,647
- Reserves months
- —
- Total cash needed
- —
Loan-product check · same deal, 3 products live
Conventional
25% down · 7.5% · 30yr
- Down + closing
- —
- Monthly P&I
- —
- Monthly cashflow
- —
- DSCR
- —
- Eligible?
- —
Personal DTI + credit; lowest rate.
DSCR
20% down · 8.5% · 30yr
- Down + closing
- —
- Monthly P&I
- —
- Monthly cashflow
- —
- DSCR
- —
- Eligible?
- —
No personal income docs; deal must DSCR.
Hard money
10% down · 12.0% · 12mo
- Down + closing
- —
- Monthly P&I
- —
- Monthly cashflow
- —
- DSCR
- —
- Eligible?
- —
Short-term bridge; refi at stabilization.
Rent comps 4 comps
| Address | Beds | Baths | Sqft | Rent | $/sqft | DOM | Units | Dist |
|---|---|---|---|---|---|---|---|---|
| 2908 Peppercorn Ct Virginia Beach, VA | 4.0 | 1.5 | 1381 | $2,295 | $1.66 | 23d | 1 | 0.46mi |
| 408 Lineberry Rd Virginia Beach, VA | 4.0 | 2.0 | 1561 | $2,700 | $1.73 | 23d | 1 | 0.96mi |
| 3564 Faraday Ln Virginia Beach, VA | 4.0 | 2.5 | 1700 | $2,600 | $1.53 | 23d | 1 | 1.24mi |
| 701 Arthur Ave Virginia Beach, VA | 4.0 | 1.5 | 1404 | $2,500 | $1.78 | 17d | 1 | 1.39mi |
Listing history 19 events
-
2026-06-18days on market $354,900 Active 86 DOM
-
2026-06-17days on market $354,900 Active 85 DOM
-
2026-06-16days on market $354,900 Active 84 DOM
-
2026-06-15days on market $354,900 Active 83 DOM
-
2026-06-13days on market $354,900 Active 81 DOM
-
2026-06-09days on market $354,900 Active 77 DOM
-
2026-06-08days on market $354,900 Active 76 DOM
-
2026-06-07days on market $354,900 Active 75 DOM
-
2026-06-03days on market $354,900 Active 71 DOM
-
2026-06-02days on market $354,900 Active 70 DOM
-
2026-06-01days on market $354,900 Active 69 DOM
-
2026-05-31days on market $354,900 Active 68 DOM
-
2026-03-23$354,900 Active
-
2026-02-19historical
-
2025-12-17status Active
-
2025-10-22status Under Contract
-
2025-09-25price $354,900
-
2025-09-20$369,900 Active
-
2004-01-21soldstatus $125,000
ⓘ Source: listings_history table (triggers on properties + properties_extension) + one-shot
backfill from property_details.listing_events for pre-trigger history.
Tax reassessment forecast VA · Resets to sale price
- Current annual tax
- $2,695 · $225/mo
- Projected year-2 tax
- $2,910 · $243/mo
- Expected delta
- +$216/yr (+$18/mo · 8.0%)
ⓘ Screening estimate from a state-policy table — verify with the county assessor before closing.
Climate risk First Street
- Flood 1/10 Low FEMA zone X (unshaded) · 0% chance over 30 yrs
- Wildfire 1/10 Low
- Heat 9/10 Extreme 7 d/yr ≥105°F today · 17 d/yr by 30 yrs out
- Wind 8/10 Severe 99% chance of damaging wind over 30 yrs
- Air quality 3/10 Moderate 2 unhealthy d/yr today · 4 by 30 yrs out
Nearby sold comps map
Loading sold comps map…
Walkable amenities ~0.75 mi
Loading nearby amenities…
Taxation est. · year 1
- Rental income
- $31,801
- − Mortgage interest
- −$19,880
- − Property taxes
- −$2,695
- − Insurance
- −$1,774
- − Repairs & maintenance
- −$2,544
- − Management
- −$2,544
- − Depreciation
- −$10,324
- Taxable loss
- −$7,961
- Est. tax savings @ 24.0%
- +$1,911
- After-tax cash flow
- $230/yr
For passive investors: Depreciation is non-cash, so a rental often shows a tax loss while cash-flowing — sheltering income. Rental losses are passive: they offset passive income freely, and up to $25,000/yr can offset ordinary (W-2) income if you actively participate and your MAGI is under $100k (phasing out to $0 by $150k); unused losses carry forward. On sale, claimed depreciation is recaptured at up to 25%, and gains may owe capital-gains tax (a 1031 exchange can defer both). Figures are a year-1 estimate at your 24.0% rate — not tax advice; consult a CPA.
Schools (NCES district)
- District
- Va Beach City Public School District
- NCES district ID
- 5103840
- Math proficiency
- 69% ▼ -19.00%
- Reading proficiency
- 78% ▼ -7.00%
- Median HH income
- $66,452
- Composite
- 63.81/100
- National rank
- #594
- State rank
- #10 of 131 in VA
Livability — Virginia Beach
- Score
- 83/100
- State rank
- #38
- US rank
- #880
Category grades
Schools grade is shown separately in the Schools card above.
Census & demographics
- Census place
- Virginia Beach, VA
- County
- Virginia Beach City · 448,227 people
- City population
- 448,227
- Metro
- Virginia Beach-Norfolk-Newport News, VA-NC
- Population (ZIP)
- 58,455
- Household income
- $79,085
- Rent vs Own
- Severe rent burden
- 2293.0
Population outlook (Virginia Beach County) Hauer SSP2
- Today (2025)
- 480,401 people
- By 2030
- 491,221 · +2.3%
- By 2040
- 504,882 · +5.1%
- By 2050
- 508,847 · +5.9%
- By 2075
- 504,831 · +5.1%
- By 2100
- 465,867 · -3.0%
Race, ethnicity, and origin ACS 2023
- Neighborhood character
- Diverse neighborhood (Simpson 0.59)
- Race & ethnicity
- White 60% Black 20% Two or more races 10% Hispanic / Latino 9% Asian 5%
- Hispanic origin (detail)
- Mexican 2% Puerto Rican 3%
- Common ancestry
- Romanian 2% Italian 2% Lithuanian 2%
- Foreign-born
- 8% · Canada, Jamaica
- Languages at home
- 88% English-only · Spanish 6% Tagalog/Filipino 2% Other Asian/Pacific 1%
Political lean MEDSL · Virginia Beach
- 2024 margin
- Toss-up / Even · D 50.7% · R 48.0% · Other 1.3%
- 2008→2024 swing
- +3.4pp toward D · 2008: -0.7pp · 2024: 2.6pp
- All cycles
- 2024: D+2.6 2020: D+5.4 2016: R+4.5 2012: R+2.5 2008: R+0.7
Not yet ingested
- Civics
- —
Market trends
- HPI YoY
- ▼ -363.80%
- Current HPI
- 328.5435
- Rent YoY
- ▲ 4.92%
- Metro
- Virginia Beach-Norfolk-Newport News, VA-NC
- State GDP YoY
- ▲ 2.40%
- F500 in state
- 50
Industry mix (Fortune 500 HQ in VA)
| Industry | F500 HQs | Revenue |
|---|---|---|
| Aerospace / Defense | 4 | $236B |
|
||
| Technology / Defense | 3 | $32B |
|
||
| Financial Services | 2 | $176B |
|
||
| Utilities | 2 | $27B |
|
||
| Insurance | 2 | $25B |
|
||
| Technology | 2 | $15B |
|
||
Price history
+183.9% since first listed7 events — show timeline
- 2026-03-23 Listed $354,900 REINMLS
- 2026-02-19 Listing Removed — REINMLS
- 2025-12-17 Relisted — REINMLS
- 2025-10-22 Pending — REINMLS
- 2025-09-25 Price Changed $354,900 REINMLS
- 2025-09-20 Listed $369,900 REINMLS
- 2004-01-21 Sold (Public Records) $125,000 Public Records
Property tax history
+3.2%/yrLatest (2025): $2,695 · +0.0% YoY. Source: county tax records.
Cash-flow waterfall
monthlySold comps — $/sqft
last 12 mo · ≤1 miLoading sold comps…