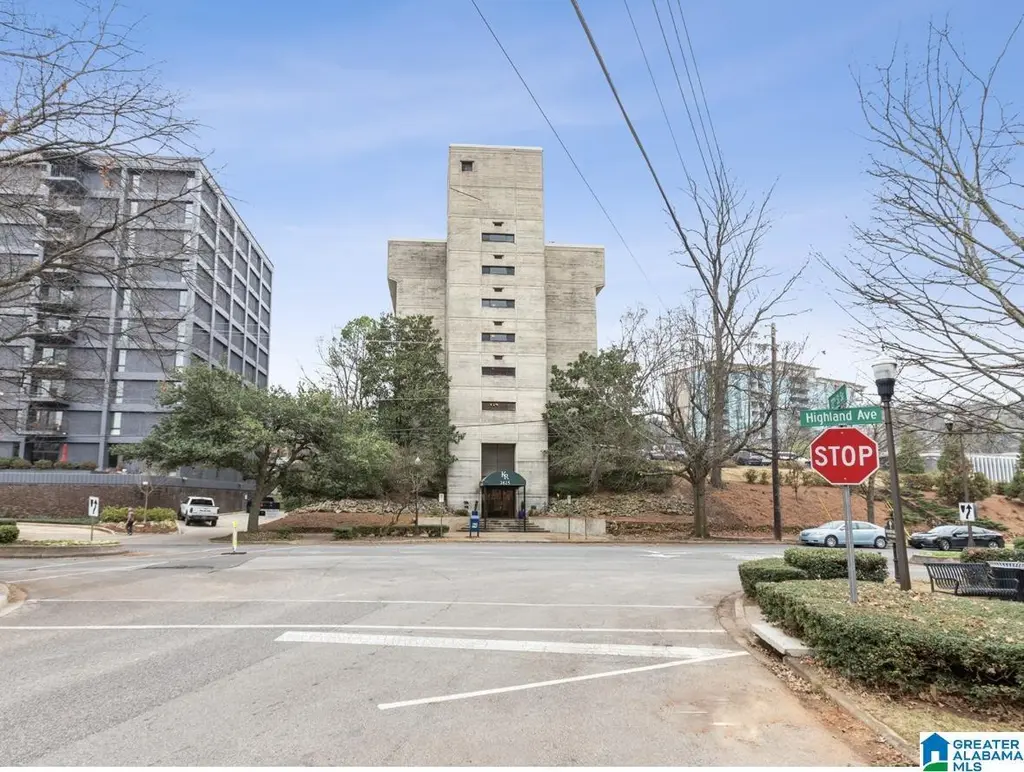
2625 Highland Ave #402 · Birmingham, AL
Flood risk No data
- FEMA flood zone
- —
- Chance of flooding over 30 yrs
- —
- Est. flood insurance / yr
- —
Fire risk No data
- Est. fire insurance / yr
- —
Heat risk No data
- Hot days now (above threshold)
- —
- Hot days in 30 yrs
- —
Wind risk No data
- Chance of severe wind over 30 yrs
- —
Air-quality risk No data
- Unhealthy air days now
- —
- Unhealthy air days in 30 yrs
- —
Risk factors via First Street. Map © Google.
Why this score? — see what drove the F grade
The composite is a weighted blend of 9 inputs, each scored 0–100. Each bar is that input's sub-score; the figure is the points it added to the 100-point composite (weight × sub-score).
- ARV discount +15.0/15.0
- Cash flow +3.7/30.0
- Livability +3.4/5.0
- Rent growth +3.1/5.0
- 1% rule +2.5/10.0
- Condition / age +2.5/5.0
- Schools +0.9/10.0
- DSCR +0.0/10.0
- Appreciation +0.0/10.0
$129,900
🖨 Deal sheet (PDF) 📄 Offer letter ✓ Due diligence
Listing remarks MLS
REDUCED REDUCED REDUCED!!! SELLER SAID LET IT GO!!! This charming one bedroom with updated kitchen and updated bathroom features an open concept, neutral colors, large closets, breakfast bar and so much more!!! Located on the fourth floor in a historic district. Parking spot included located behind the building in the alley number 402. Perfect for a young professional, student or investor. This condo is move ready and waiting for its new owner. Don't let this one get away.
Key facts
- Open concept
- Large closets
- Updated kitchen
Tags
Neighborhood map
What this means for you Summary
Snapshot
- This is a 1-bed/1.0-bath condo listed at $130k.
Deal economics
- At list price, monthly cash flow is $-379 ($-5k/yr) — negative.
- To cash-flow at today's rent, offer at most $122k (6.1% below list).
- To meet the 1% rule (rent ≥ 1% of price), the offer needs to be $97k (25.1% below list).
- Recommended offer: $97k (25.1% below list) — sets the bar for 1% rule.
- Cap rate 2.8% vs local median 6.2% in Birmingham — below-typical yield; the buyer is paying a premium for something (appreciation thesis, condition, location) that the cap rate doesn't capture.
Location & tenants
- Location reads 67/100 on livability (#78 in AL) — a middle-class / working-renter tenant base. Strengths: commute A+, cost of living A+, housing A+; Watch: amenities C-, schools F, crime F.
- Birmingham City (urban): math 4% / reading 20% proficiency, ranked #116 of 129 in AL (top 90%) — low school quality limits family demand, transient renter base, plan for 1-2y turnover; 82% free/reduced lunch — lower-income household profile, screen leases tightly.
- Market conditions: Rents rising (+2.6%/yr); 124 active listings in the ZIP; 40 comparable units currently listed for rent nearby; rentals at typical pace (median 21d on market — plan ~3-4 weeks tenant-placement turnaround); 2,114 units permitted in Jefferson County in 2024 (556 in 5+ unit buildings).
Forward outlook
- Local home prices are declining (-3.0%/yr); year-one equity from $898 of loan paydown is wiped out by about $4k of value loss. Plan a longer hold.
- Jefferson County population projected to shrink 4% by 2050 — rents likely to lag national; underwrite the cash flow, not the appreciation.
Negotiation context
- It's been on market 51 days — a 3% lower offer ($126k) is reasonable based on typical stale-listing flexibility.
- 3 sale attempts since 11y ago; this cycle's ask has dropped $10k (7%) from the opening price — seller is motivated, your offer sets the floor, not the list.
- Current owner paid $68k; list at $130k implies a 91% gain — meaningful room to come down on a strong offer.
Risks & watch-outs
- Watch-outs: HOA is 34% of rent.
Questions for the listing agent
- What do current leases actually rent for vs. the listed asking? Can we see a recent rent roll and the last 12 months of T-12 income?
- It's been on market 51 days. Have you received any prior offers? Is the seller open to a 25% concession, seller financing, or rate buy-down credit?
- Built in 1974 — when were the roof, HVAC, electrical panel, plumbing, and water heater last replaced?
- What does the HOA fee cover, when was the last increase, and are there any pending special assessments or reserve-fund shortfalls?
- Any open or pending special assessments — roof, HVAC, plumbing, elevator, façade? What's the per-unit balance and payoff schedule, and is the seller paying it off at close or rolling it to the buyer?
- Is there a deadline driving the sale (1031 exchange, divorce, estate, relocation)? That informs how much negotiation room exists.
- Schools are F-rated, which usually means shorter tenancies and higher turnover. Who's the typical renter profile here, and what's been the actual vacancy rate?
- Crime grade is F in this area — have there been break-ins, vandalism, or insurance claims at this property in the last 3 years? What carrier currently insures it and at what premium?
- The area grade is low — what's the realistic commute time and amenity access for the typical tenant pool here? Any planned neighborhood developments (good or bad) we should know about?
- What's the average days-on-market for RENTAL listings here right now (not sales)? A rising rental-DOM trend means longer vacancies and softer asking-rent achievability than the comps imply.
- What's the recent tenant-quality profile in this submarket — average credit score on applications, eviction rate, late-payment / NSF rate, and stable-employment percentage? A property-management company in the area should have these aggregated.
- How much new apartment / multifamily construction is in the pipeline within 1–3 miles? Heavy new supply (>2% of stock underway) typically softens rents 12–24 months out; light construction supports rent growth.
Investment metrics
- 1% rule
- 0.75% ✗
- Cap rate
- 2.80%
- Cash-on-cash
- -12.49%
- DSCR
- 0.44
- GRM
- 11.1
CMA / ARV
- ARV (median comp)
- $163,142
- List price
- $129,900
- Delta
- -20.38%
- Verdict
- UNDERPRICED
- Comps
- 20 within 1.0 mi
Projected returns pro-forma
-3.0% appreciation · 2.59% rent growth · sell at horizon
- IRR
- -39.9%
- Equity multiple
- -0.25×
- Total profit
- $-45,396
- Equity at exit
- $19,369
- IRR
- -65.9%
- Equity multiple
- -0.97×
- Total profit
- $-71,526
- Equity at exit
- $11,231
Cash invested: $36,372 (down + closing). Projections, not guarantees.
Landlord ↔ Tenant lean methodology
- Overall (STATE)
- 90 Strongly Landlord-Friendly
- State Alabama
- 90 Strongly Landlord-Friendly · R+15
- County
- — inherits STATE
- City
- — inherits STATE
ZIP-level market 35205
- Rents YoY
- 2.6%
- Active inventory
- 124
- Price-to-rent
- 11.1×
Monthly cashflow live
- Estimated rent
- $973 high interval (Pro) →
- Mortgage (P&I)
- −$681
- Tax from tax record
- −$78 /mo · $939/yr
- Insurance
- −$54
- HOA est. from 3 same-building comps
- −$334
- Vacancy / Maint / Mgmt
- −$204
- Net cashflow
- $-379
Break-even live
Sensitivity live
| Price | -10% $-305 | -5% $-342 | +0% $-379 | +5% $-415 | +10% $-452 |
|---|---|---|---|---|---|
| Rent | -10% $-456 | -5% $-417 | +0% $-379 | +5% $-340 | +10% $-302 |
| Rate | -1.0pp $-313 | -0.5pp $-346 | base $-379 | +0.5pp $-412 | +1.0pp $-447 |
UW: 25.0% down · 7.5% · 30yr · 1.5% tax · 5.0% vac · 8.0% maint · 8.0% mgmt
Financing live
Cash to close
- Down payment
- $32,475
- Closing costs
- $3,897
- Reserves months
- —
- Total cash needed
- —
Loan-product check · same deal, 3 products live
Conventional
25% down · 7.5% · 30yr
- Down + closing
- —
- Monthly P&I
- —
- Monthly cashflow
- —
- DSCR
- —
- Eligible?
- —
Personal DTI + credit; lowest rate.
DSCR
20% down · 8.5% · 30yr
- Down + closing
- —
- Monthly P&I
- —
- Monthly cashflow
- —
- DSCR
- —
- Eligible?
- —
No personal income docs; deal must DSCR.
Hard money
10% down · 12.0% · 12mo
- Down + closing
- —
- Monthly P&I
- —
- Monthly cashflow
- —
- DSCR
- —
- Eligible?
- —
Short-term bridge; refi at stabilization.
Rent comps 40 comps
| Address | Beds | Baths | Sqft | Rent | $/sqft | DOM | Units | Dist |
|---|---|---|---|---|---|---|---|---|
| 2612 Niazuma Ave S Birmingham, AL | 1.0–2.0 | 1.0 | 665 | $965 | $1.45 | 17d | 9 | 0.07mi |
| 55 Hanover Cir S Birmingham, AL | 1.0 | 1.0 | 678 | $1,175 | $1.73 | 45d | 2 | 0.12mi |
| 55 Hanover Cir S Birmingham, AL | 1.0 | 1.0 | 678 | $1,175 | $1.73 | 17d | 2 | 0.12mi |
| 2704 Hanover Cir Unit 2 Birmingham, AL | 1.0 | 1.0 | 600 | $915 | $1.52 | 25d | 1 | 0.13mi |
| 1317 27th Pl S Unit 1317A Birmingham, AL | 1.0 | 1.0 | 550 | $895 | $1.63 | 5d | 1 | 0.14mi |
| 57 Hanover Cir S Birmingham, AL | 1.0 | 1.0 | 600 | $1,300 | $2.17 | 45d | 1 | 0.14mi |
| 2525 Highland Ave Apt G1 Birmingham, AL | — | 1.0 | 400 | $756 | $1.89 | 5d | 1 | 0.14mi |
| 2511 Caldwell Ave S Apt 9 Birmingham, AL | 1.0 | 1.0 | 700 | $915 | $1.31 | 25d | 1 | 0.18mi |
| 2511 Caldwell Ave S Unit 3 Birmingham, AL | 1.0 | 1.0 | 650 | $915 | $1.41 | 45d | 1 | 0.18mi |
| 1228 29th St S Unit Montclair 18 Birmingham, AL | — | 1.0 | 475 | $764 | $1.61 | 45d | 1 | 0.20mi |
| 1228 29th St S Birmingham, AL | 1.0 | 1.0 | 562 | $915 | $1.63 | 4d | 2 | 0.20mi |
| 1022 28th Pl S #2 Birmingham, AL | 1.0 | 1.0 | 740 | $1,100 | $1.49 | 45d | 1 | 0.21mi |
| 1300 29th St S Unit 1304-9 Birmingham, AL | 1.0 | 1.0 | 557 | $964 | $1.73 | 16d | 1 | 0.22mi |
| 1227 29th St S Unit 1227-C Birmingham, AL | 1.0 | 1.0 | 605 | $820 | $1.36 | 21d | 1 | 0.23mi |
| 1229 29th St S Unit 1229-C Birmingham, AL | 1.0 | 1.0 | 539 | $896 | $1.66 | 23d | 1 | 0.24mi |
| 2251 Highland Ave S Birmingham, AL | 1.0 | 1.0 | 522 | $950 | $1.82 | 3d | 5 | 0.25mi |
| 2907 13th Ave S Apt B4 Birmingham, AL | 1.0 | 1.0 | 624 | $1,087 | $1.74 | 45d | 1 | 0.26mi |
| 2907 13th Ave S Unit A-6 Birmingham, AL | 1.0 | 1.0 | 624 | $1,105 | $1.77 | 12d | 1 | 0.26mi |
| 2824 Rhodes Cir S Birmingham, AL | 1.0 | 1.0 | 615 | $995 | $1.62 | 5d | 2 | 0.28mi |
| 2964 Rhodes Cir S Birmingham, AL | 1.0–2.0 | 1.0 | 670 | $855 | $1.28 | 16d | 2 | 0.28mi |
| 1248 22nd St S Birmingham, AL | 1.0 | 1.0 | 643 | $799 | $1.24 | 16d | 5 | 0.29mi |
| 3003 13th Ave S Apt 11 Birmingham, AL | 1.0 | 1.0 | 718 | $971 | $1.35 | 45d | 1 | 0.29mi |
| 2990 Rhodes Cir S Birmingham, AL | 1.0 | 1.0 | 562 | $1,000 | $1.78 | 25d | 1 | 0.31mi |
| 2830 10th Ct S Birmingham, AL | 1.0 | 1.0 | 747 | $877 | $1.17 | 17d | 1 | 0.31mi |
| 2829 10th Ave S Unit G Birmingham, AL | 1.0 | 1.0 | 600 | $915 | $1.52 | 25d | 1 | 0.34mi |
| 1033 30th St S Unit B Birmingham, AL | 1.0 | 1.0 | 650 | $945 | $1.45 | 13d | 1 | 0.36mi |
| 1033 30th St S Unit C Birmingham, AL | 1.0 | 1.0 | 650 | $945 | $1.45 | 25d | 1 | 0.36mi |
| 1033 30th St S Unit R Birmingham, AL | 1.0 | 1.0 | 650 | $945 | $1.45 | 21d | 1 | 0.36mi |
| 2230 Highland Ave Birmingham, AL | 2.0 | 1.0–2.0 | 968 | $2,390 | $2.47 | 3d | 272 | 0.36mi |
| 1025 30th St S Unit 1C Birmingham, AL | 1.0 | 1.0 | 650 | $1,000 | $1.54 | 17d | 1 | 0.37mi |
| 3113 Pawnee Ave S Unit 2 Birmingham, AL | 1.0 | 1.0 | 500 | $1,087 | $2.17 | 25d | 1 | 0.41mi |
| 2920 10th Ave S Unit 2924-A Birmingham, AL | 2.0 | 1.0 | 661 | $1,084 | $1.64 | 21d | 1 | 0.41mi |
| 2920 10th Ave S Unit 2920-D Birmingham, AL | 2.0 | 1.0 | 661 | $1,091 | $1.65 | 12d | 1 | 0.41mi |
| 909 30th St S Unit 13 Birmingham, AL | 2.0 | 1.0 | 705 | $1,014 | $1.44 | 5d | 1 | 0.43mi |
| 2925 Clairmont Ave Apt D Birmingham, AL | 1.0 | 1.0 | 640 | $890 | $1.39 | 45d | 1 | 0.44mi |
| 2925 Clairmont Ave Unit G Birmingham, AL | 1.0 | 1.0 | 640 | $888 | $1.39 | 45d | 1 | 0.44mi |
| 2925 Clairmont Ave Apt H Birmingham, AL | 1.0 | 1.0 | 640 | $933 | $1.46 | 45d | 1 | 0.44mi |
| 2173 Highland Ave S Birmingham, AL | 1.0–2.0 | 1.0–2.0 | 908 | $1,578 | $1.74 | 3d | 32 | 0.45mi |
| 2155 11th Ct S Unit 11 Birmingham, AL | 1.0 | 1.0 | 625 | $851 | $1.36 | 23d | 1 | 0.47mi |
| 2155 11th Ct S Unit 1 Birmingham, AL | 1.0 | 1.0 | 625 | $811 | $1.30 | 4d | 1 | 0.47mi |
HOA detail condo
- Monthly dues
- $0 · $0/yr
- Assessments
- None detected in remarks — confirm with the listing agent.
Listing history 17 events
-
2026-05-15status Pending 479-char remark
Show marketing remark (479 chars)
REDUCED REDUCED REDUCED!!! SELLER SAID LET IT GO!!! This charming one bedroom with updated kitchen and updated bathroom features an open concept, neutral colors, large closets, breakfast bar and so much more!!! Located on the fourth floor in a historic district. Parking spot included located behind the building in the alley number 402. Perfect for a young professional, student or investor. This condo is move ready and waiting for its new owner. Don't let this one get away.
-
2026-04-17price $129,900 479-char remark
Show marketing remark (479 chars)
REDUCED REDUCED REDUCED!!! SELLER SAID LET IT GO!!! This charming one bedroom with updated kitchen and updated bathroom features an open concept, neutral colors, large closets, breakfast bar and so much more!!! Located on the fourth floor in a historic district. Parking spot included located behind the building in the alley number 402. Perfect for a young professional, student or investor. This condo is move ready and waiting for its new owner. Don't let this one get away.
-
2026-03-23$139,900 Active 479-char remark
Show marketing remark (479 chars)
REDUCED REDUCED REDUCED!!! SELLER SAID LET IT GO!!! This charming one bedroom with updated kitchen and updated bathroom features an open concept, neutral colors, large closets, breakfast bar and so much more!!! Located on the fourth floor in a historic district. Parking spot included located behind the building in the alley number 402. Perfect for a young professional, student or investor. This condo is move ready and waiting for its new owner. Don't let this one get away.
-
2025-12-14price $139,900
-
2025-06-26price $145,900
-
2025-06-09price $149,900
-
2025-05-28price $152,000
-
2025-05-21price $157,900
-
2025-04-13historical $1,400
-
2025-03-21price $1,400
-
2025-02-27$1,500
-
2015-08-24soldstatus $68,000
-
2015-08-24soldstatus $129,200
-
2015-07-24historical
-
2015-06-04$69,900
-
1999-12-30soldstatus $40,000
-
1984-08-14soldstatus $34,000
ⓘ Source: listings_history table (triggers on properties + properties_extension) + one-shot
backfill from property_details.listing_events for pre-trigger history.
Tax reassessment forecast AL · Resets to sale price
- Current annual tax
- $939 · $78/mo
- Projected year-2 tax
- $939 · $78/mo
- Expected delta
- $0/yr ($0/mo · 0.0%)
ⓘ Screening estimate from a state-policy table — verify with the county assessor before closing.
Nearby sold comps map
Loading sold comps map…
Walkable amenities ~0.75 mi
Loading nearby amenities…
Taxation est. · year 1
- Rental income
- $11,680
- − Mortgage interest
- −$7,276
- − Property taxes
- −$939
- − Insurance
- −$650
- − Repairs & maintenance
- −$934
- − Management
- −$934
- − HOA
- −$4,008
- − Depreciation
- −$3,779
- Taxable loss
- −$6,840
- Est. tax savings @ 24.0%
- +$1,642
- After-tax cash flow
- $-2,902/yr
For passive investors: Depreciation is non-cash, so a rental often shows a tax loss while cash-flowing — sheltering income. Rental losses are passive: they offset passive income freely, and up to $25,000/yr can offset ordinary (W-2) income if you actively participate and your MAGI is under $100k (phasing out to $0 by $150k); unused losses carry forward. On sale, claimed depreciation is recaptured at up to 25%, and gains may owe capital-gains tax (a 1031 exchange can defer both). Figures are a year-1 estimate at your 24.0% rate — not tax advice; consult a CPA.
Schools (NCES district)
- District
- Birmingham City
- NCES district ID
- 0100390
- Math proficiency
- 4% ▼ -17.00%
- Reading proficiency
- 20% ▼ -4.00%
- Median HH income
- $31,988
- Composite
- 9.49/100
- National rank
- #9850
- State rank
- #116 of 129 in AL
Livability — Birmingham
- Score
- 67/100
- State rank
- #78
- US rank
- #10412
Category grades
Schools grade is shown separately in the Schools card above.
Census & demographics
- Census place
- Birmingham, AL
- County
- Jefferson County · 527,445 people
- City population
- 210,422
- Metro
- Birmingham-Hoover, AL
- Population (ZIP)
- 18,858
- Household income
- $51,158
- Rent vs Own
- Severe rent burden
- 1468.0
Population outlook (Jefferson County) Hauer SSP2
- Today (2025)
- 669,185 people
- By 2030
- 669,694 · +0.1%
- By 2040
- 661,388 · -1.2%
- By 2050
- 643,086 · -3.9%
- By 2075
- 577,267 · -13.7%
- By 2100
- 474,758 · -29.1%
Race, ethnicity, and origin ACS 2023
- Neighborhood character
- Diverse neighborhood (Simpson 0.56)
- Race & ethnicity
- White 60% Black 26% Hispanic / Latino 5% Asian 5% Two or more races 4%
- Hispanic origin (detail)
- Mexican 3%
- Common ancestry
- Slovak 3% Italian 2% Serbian 2%
- Foreign-born
- 9% · Canada, China, Vietnam
- Languages at home
- 90% English-only · Spanish 4% Other Indo-European 2% Chinese 1%
Political lean MEDSL · Jefferson
- 2024 margin
- D (+10.4) · D 54.6% · R 44.2% · Other 1.2%
- 2008→2024 swing
- +5.4pp toward D · 2008: 5.1pp · 2024: 10.4pp
- All cycles
- 2024: D+10.4 2020: D+13.2 2016: D+7.2 2012: D+6.0 2008: D+5.1
Not yet ingested
- Civics
- —
Market trends
- HPI YoY
- ▼ -199.42%
- Current HPI
- 291.38
- Rent YoY
- ▲ 2.59%
- Metro
- Birmingham-Hoover, AL
- State GDP YoY
- ▲ 2.94%
- F500 in state
- 4
Industry mix (Fortune 500 HQ in AL)
| Industry | F500 HQs | Revenue |
|---|---|---|
| Financial Services | 1 | $8B |
|
||
| Healthcare | 1 | $5B |
|
||
Price history
+282.1% since first listed17 events — show timeline
- 2026-05-15 Pending — Greater Alabama MLS
- 2026-04-17 Price Changed $129,900 Greater Alabama MLS
- 2026-03-23 Listed $139,900 Greater Alabama MLS
- 2025-12-14 Price Changed $139,900 Greater Alabama MLS
- 2025-06-26 Price Changed $145,900 Greater Alabama MLS
- 2025-06-09 Price Changed $149,900 Greater Alabama MLS
- 2025-05-28 Price Changed $152,000 Greater Alabama MLS
- 2025-05-21 Price Changed $157,900 Greater Alabama MLS
- 2025-04-13 Rental Removed $1,400 SHOWMOJO
- 2025-03-21 Price Changed $1,400 SHOWMOJO
- 2025-02-27 Listed for Rent $1,500 SHOWMOJO
- 2015-08-24 Sold (Public Records) $129,200 Public Records
- 2015-08-24 Sold (MLS) $68,000 Greater Alabama MLS
- 2015-07-24 Delisted — Greater Alabama MLS
- 2015-06-04 Listed $69,900 Greater Alabama MLS
- 1999-12-30 Sold (Public Records) $40,000 Public Records
- 1984-08-14 Sold (Public Records) $34,000 Public Records
Property tax history
-0.4%/yrLatest (2025): $939 · +0.0% YoY. Source: county tax records.
Cash-flow waterfall
monthlySold comps — $/sqft
last 12 mo · ≤1 miLoading sold comps…