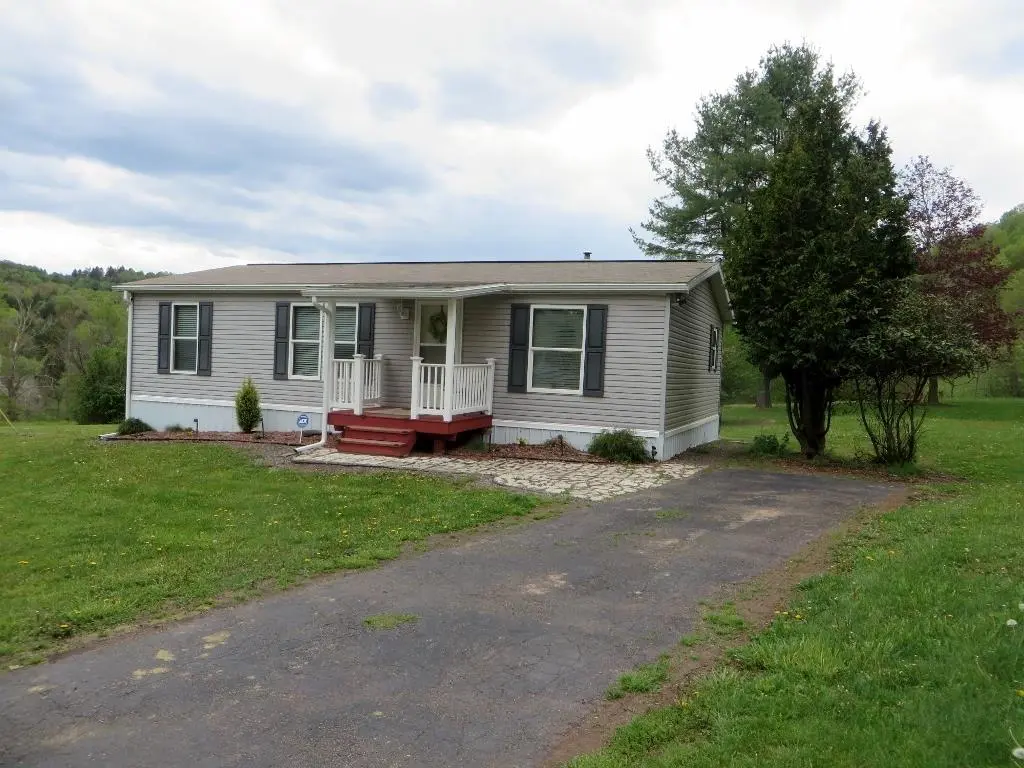
25 Edwards Rd · Dushore, PA
Flood risk 1/10 · Minimal
- FEMA flood zone
- X (unshaded)
- Chance of flooding over 30 yrs
- 0.0%
- Est. flood insurance / yr
- $507 – $1,088
Fire risk 1/10 · Minimal
- Est. fire insurance / yr
- $511 – $949
Heat risk 2/10 · Minimal
- Hot days now (above 90°F)
- 7 days/yr
- Hot days in 30 yrs
- 16 days/yr
Wind risk 2/10 · Minimal
- Chance of severe wind over 30 yrs
- 3.0%
Air-quality risk 2/10 · Minimal
- Unhealthy air days now
- 0 days/yr
- Unhealthy air days in 30 yrs
- 1 days/yr
Risk factors via First Street. Map © Google.
Why this score? — see what drove the D+ grade
The composite is a weighted blend of 9 inputs, each scored 0–100. Each bar is that input's sub-score; the figure is the points it added to the 100-point composite (weight × sub-score).
- Cash flow +15.1/30.0
- ARV discount +7.5/15.0
- Appreciation +5.0/10.0
- DSCR +4.6/10.0
- 1% rule +3.4/10.0
- Schools +3.2/10.0
- Livability +2.9/5.0
- Rent growth +2.5/5.0
- Condition / age +2.5/5.0
$169,500
🖨 Deal sheet (PDF) 📄 Offer letter ✓ Due diligence
Listing remarks MLS
Almost new 2019 doublewide situated on 2.40 acres with a nice view in Cherry Twp. Three bedrooms, one full bath, and a master bath with walk-in shower. Paved driveway and storage building for your lawn equipment. New well pump installed for drilled well within the past 6 months.
Key facts
- Laundry area
- Eat in kitchen
- Large living room
Tags
Property features AI
Exterior
- Utilities: Private well water; Septic tank
- Home design: Manufactured home; Residential property
- Construction: Vinyl siding
- Exterior features: Shingle roof; 2.4-acre lot
Interior
- Bathrooms: 2 full bathrooms
- Heating & cooling: Forced air heating (oil); Window cooling units
- Interior features: Electric water heater; 5 total rooms
Neighborhood map
What this means for you Summary
Snapshot
- This is a 2-bed/2.0-bath manufactured listed at $170k.
Deal economics
- At list price, monthly cash flow is $55 ($665/yr) — positive.
- The deal already cash-flows at list — no discount required.
- To meet the 1% rule (rent ≥ 1% of price), the offer needs to be $143k (15.5% below list).
- Recommended offer: $143k (15.5% below list) — sets the bar for 1% rule.
Location & tenants
- Location reads 57/100 on livability (#1,622 in PA) — a working-class tenant base; expect higher turnover. Strengths: cost of living A+; Watch: amenities F, commute F, employment F.
- Sullivan County SD (rural): math 30% / reading 46% proficiency, ranked #387 of 539 in PA (top 72%) — families likely to look elsewhere, expect single-tenant / working-renter base with shorter leases.
- Zoned schools: Sullivan Co El Sch (math 32% / reading 47%, grade F, #947 of 1,518 statewide, top 65%, 329 students, 51% FRL); Sullivan Co Jshs (math 27% / reading 47%, grade F, #289 of 437 statewide, top 67%, 287 students, 39% FRL).
- Market conditions: 13 active listings in the ZIP; 1 comparable units currently listed for rent nearby; 12 units permitted in Sullivan County in 2024 (0 in 5+ unit buildings).
Forward outlook
- In year one you build about $1k of equity ($1k loan paydown + $89 appreciation (0.1% local appreciation)).
- Sullivan County population projected at -22% by 2050 — secular population decline; favor cash flow + early exit over multi-decade hold.
Negotiation context
- Only 8 days on market — expect competitive offers; lowballing is unlikely to land.
- 2 sale attempts since 5y ago with the ask held roughly flat each time — persistent listings suggest the price (not the market) is what's stuck; bring a comps-based counter.
- Current owner paid $130k; 30% above their basis — modest negotiation headroom, anchor on the comps not their cost.
Questions for the listing agent
- Is there a deadline driving the sale (1031 exchange, divorce, estate, relocation)? That informs how much negotiation room exists.
- Schools are F-rated, which usually means shorter tenancies and higher turnover. Who's the typical renter profile here, and what's been the actual vacancy rate?
- The area grade is low — what's the realistic commute time and amenity access for the typical tenant pool here? Any planned neighborhood developments (good or bad) we should know about?
- What's the average days-on-market for RENTAL listings here right now (not sales)? A rising rental-DOM trend means longer vacancies and softer asking-rent achievability than the comps imply.
- What's the recent tenant-quality profile in this submarket — average credit score on applications, eviction rate, late-payment / NSF rate, and stable-employment percentage? A property-management company in the area should have these aggregated.
- How much new for-sale + rental construction is in the pipeline within 1–3 miles? Heavy new supply typically softens prices + rents 12–24 months out; constrained supply supports both.
Investment metrics
- 1% rule
- 0.84% ✗
- Cap rate
- 6.69%
- Cash-on-cash
- 1.40%
- DSCR
- 1.06
- GRM
- 9.9
CMA / ARV
No comps found within radius.
Projected returns pro-forma
0.05% appreciation · 3.0% rent growth · sell at horizon
- IRR
- -0.5%
- Equity multiple
- 0.98×
- Total profit
- $-1,047
- Equity at exit
- $49,663
- IRR
- 5.1%
- Equity multiple
- 1.55×
- Total profit
- $26,194
- Equity at exit
- $60,054
Cash invested: $47,460 (down + closing). Projections, not guarantees.
Landlord ↔ Tenant lean methodology
- Overall (STATE)
- 62 Landlord-Friendly
- State Pennsylvania
- 62 Landlord-Friendly · EVEN
- County
- — inherits STATE
- City
- — inherits STATE
ZIP-level market 18614
- Home prices YoY
- 0.0%
- Active inventory
- 13
- Price-to-rent
- 9.9×
Monthly cashflow live
- Estimated rent
- $1,432 medium interval (Pro) →
- Mortgage (P&I)
- −$889
- Tax from tax record
- −$116 /mo · $1,396/yr
- Insurance
- −$71
- HOA
- −$0
- Vacancy / Maint / Mgmt
- −$301
- Net cashflow
- $55
Break-even live
Sensitivity live
| Price | -10% $151 | -5% $103 | +0% $55 | +5% $7 | +10% $-41 |
|---|---|---|---|---|---|
| Rent | -10% $-58 | -5% $-1 | +0% $55 | +5% $112 | +10% $169 |
| Rate | -1.0pp $141 | -0.5pp $99 | base $55 | +0.5pp $12 | +1.0pp $-33 |
UW: 25.0% down · 7.5% · 30yr · 1.5% tax · 5.0% vac · 8.0% maint · 8.0% mgmt
Financing live
Cash to close
- Down payment
- $42,375
- Closing costs
- $5,085
- Reserves months
- —
- Total cash needed
- —
Loan-product check · same deal, 3 products live
Conventional
25% down · 7.5% · 30yr
- Down + closing
- —
- Monthly P&I
- —
- Monthly cashflow
- —
- DSCR
- —
- Eligible?
- —
Personal DTI + credit; lowest rate.
DSCR
20% down · 8.5% · 30yr
- Down + closing
- —
- Monthly P&I
- —
- Monthly cashflow
- —
- DSCR
- —
- Eligible?
- —
No personal income docs; deal must DSCR.
Hard money
10% down · 12.0% · 12mo
- Down + closing
- —
- Monthly P&I
- —
- Monthly cashflow
- —
- DSCR
- —
- Eligible?
- —
Short-term bridge; refi at stabilization.
Rent comps 1 comps
| Address | Beds | Baths | Sqft | Rent | $/sqft | DOM | Units | Dist |
|---|---|---|---|---|---|---|---|---|
| 135 N German St Dushore, PA | 1.0 | 1.0 | 750 | $1,432 | $1.91 | 15d | 1 | 1.07mi |
Listing history 4 events
-
2026-05-12$169,500 Active 267-char remark
-
2022-01-06soldstatus $130,000
-
2022-01-03soldstatus $130,000 279-char remark
Show marketing remark (279 chars)
Almost new 2019 doublewide situated on 2.40 acres with a nice view in Cherry Twp. Three bedrooms, one full bath, and a master bath with walk-in shower. Paved driveway and storage building for your lawn equipment. New well pump installed for drilled well within the past 6 months.
-
2021-11-01$129,900 279-char remark
Show marketing remark (279 chars)
Almost new 2019 doublewide situated on 2.40 acres with a nice view in Cherry Twp. Three bedrooms, one full bath, and a master bath with walk-in shower. Paved driveway and storage building for your lawn equipment. New well pump installed for drilled well within the past 6 months.
ⓘ Source: listings_history table (triggers on properties + properties_extension) + one-shot
backfill from property_details.listing_events for pre-trigger history.
Tax reassessment forecast PA · Partial reset (capped growth)
- Current annual tax
- $1,396 · $116/mo
- Projected year-2 tax
- $2,037 · $170/mo
- Expected delta
- +$641/yr (+$53/mo · 45.9%)
ⓘ Screening estimate from a state-policy table — verify with the county assessor before closing.
Climate risk First Street
- Flood 1/10 Low FEMA zone X (unshaded) · 0% chance over 30 yrs
- Wildfire 1/10 Low
- Heat 2/10 Low 7 d/yr ≥90°F today · 16 d/yr by 30 yrs out
- Wind 2/10 Low 3% chance of damaging wind over 30 yrs
- Air quality 2/10 Low 0 unhealthy d/yr today · 1 by 30 yrs out
Nearby sold comps map
Loading sold comps map…
Walkable amenities ~0.75 mi
Loading nearby amenities…
Taxation est. · year 1
- Rental income
- $17,184
- − Mortgage interest
- −$9,495
- − Property taxes
- −$1,396
- − Insurance
- −$848
- − Repairs & maintenance
- −$1,375
- − Management
- −$1,375
- − Depreciation
- −$4,931
- Taxable loss
- −$2,235
- Est. tax savings @ 24.0%
- +$536
- After-tax cash flow
- $1,201/yr
For passive investors: Depreciation is non-cash, so a rental often shows a tax loss while cash-flowing — sheltering income. Rental losses are passive: they offset passive income freely, and up to $25,000/yr can offset ordinary (W-2) income if you actively participate and your MAGI is under $100k (phasing out to $0 by $150k); unused losses carry forward. On sale, claimed depreciation is recaptured at up to 25%, and gains may owe capital-gains tax (a 1031 exchange can defer both). Figures are a year-1 estimate at your 24.0% rate — not tax advice; consult a CPA.
Schools (NCES district)
- District
- Sullivan County SD
- NCES district ID
- 4222920
- Math proficiency
- 30% ▼ -20.00%
- Reading proficiency
- 46% ▼ -19.00%
- Median HH income
- $41,302
- Composite
- 31.94/100
- National rank
- #5847
- State rank
- #387 of 539 in PA
Livability — Dushore
- Score
- 57/100
- State rank
- #1622
- US rank
- #22209
Category grades
Schools grade is shown separately in the Schools card above.
Census & demographics
- Population (ZIP)
- 1,987
Population outlook (Sullivan County) Hauer SSP2
- Today (2025)
- 6,062 people
- By 2030
- 5,878 · -3.0%
- By 2040
- 5,345 · -11.8%
- By 2050
- 4,718 · -22.2%
- By 2075
- 3,259 · -46.2%
- By 2100
- 2,449 · -59.6%
Race, ethnicity, and origin ACS 2023
- Neighborhood character
- Predominantly White (98%)
- Race & ethnicity
- White 98%
- Common ancestry
- Romanian 9% Italian 2% Iranian 2%
- Foreign-born
- 0% · Canada
- Languages at home
- 98% English-only · Other Indo-European 1%
Political lean MEDSL · Sullivan
- 2024 margin
- Solid R (+46.9) · D 26.2% · R 73.1%
- 2008→2024 swing
- -27.4pp toward R · 2008: -19.5pp · 2024: -46.9pp
- All cycles
- 2024: R+46.9 2020: R+47.2 2016: R+49.3 2012: R+28.3 2008: R+19.5
Not yet ingested
- Civics
- —
Market trends
- HPI YoY
- ▲ 0.05%
- Current HPI
- 179.841
- Rent YoY
- —
- Metro
- —
- State GDP YoY
- ▲ 1.68%
- F500 in state
- 34
Industry mix (Fortune 500 HQ in PA)
| Industry | F500 HQs | Revenue |
|---|---|---|
| Healthcare | 2 | $309B |
|
||
| Insurance | 2 | $27B |
|
||
| Telecommunications / Media | 1 | $124B |
|
||
| Industrial Distribution | 1 | $22B |
|
||
| Financial Services | 1 | $20B |
|
||
| Chemicals / Materials | 1 | $18B |
|
||
Price history
+30.5% since first listed5 events — show timeline
- 2026-05-22 Pending — NMPA
- 2026-05-12 Listed $169,500 NMPA
- 2022-01-06 Sold (Public Records) $130,000 Public Records
- 2022-01-03 Sold (MLS) $130,000 NMPA
- 2021-11-01 Listed $129,900 NMPA
Property tax history
+11.1%/yrLatest (2026): $1,396 · +2.5% YoY. Source: county tax records.
Cash-flow waterfall
monthlySold comps — $/sqft
last 12 mo · ≤1 miLoading sold comps…