 Multi-family
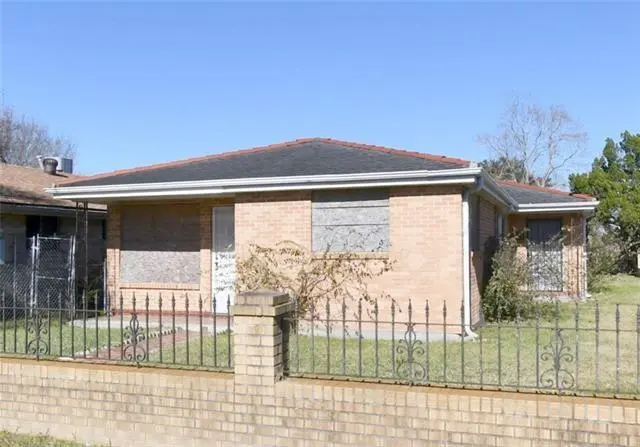
4837-39 Burgundy St · New Orleans, LA
Flood risk 8/10 · Major
- FEMA flood zone
- X (shaded)
- Chance of flooding over 30 yrs
- 0.6%
- Est. flood insurance / yr
- $507 – $1,088
Fire risk 1/10 · Minimal
- Est. fire insurance / yr
- $1,269 – $2,357
Heat risk 10/10 · Severe
- Hot days now (above 108°F)
- 7 days/yr
- Hot days in 30 yrs
- 21 days/yr
Wind risk 10/10 · Severe
- Chance of severe wind over 30 yrs
- 99.0%
Air-quality risk 3/10 · Minor
- Unhealthy air days now
- 3 days/yr
- Unhealthy air days in 30 yrs
- 3 days/yr
Risk factors via First Street. Map © Google.
Why this score? — see what drove the B grade
The composite is a weighted blend of 9 inputs, each scored 0–100. Each bar is that input's sub-score; the figure is the points it added to the 100-point composite (weight × sub-score).
- Cash flow +30.0/30.0
- ARV discount +15.0/15.0
- 1% rule +10.0/10.0
- DSCR +10.0/10.0
- Livability +4.0/5.0
- Rent growth +3.1/5.0
- Schools +1.6/10.0
- Condition / age +1.0/5.0
- Appreciation +0.0/10.0
$149,900
🖨 Deal sheet (PDF) 📄 Offer letter ✓ Due diligence
Multi-family units
County records classify this as Multi-Family (2-4 Unit). Listing-text estimate: 1 unit. estimate disagrees with records
Listing remarks MLS
Welcome to an exceptional opportunity in the highly desirable Holy Cross neighborhood of New Orleans! This gutted duplex, ripe for renovation, offers endless possibilities for customization and investment. Nestled in a vibrant community known for its historic charm and close-knit feel, this property stands as a blank canvas awaiting your vision. Boasting a prime location, you'll be within walking distance of the scenic Mississippi River, local parks, and the bustling cultural scenes of the Bywater and Marigny districts. Whether you envision a stunning single-family home, a lucrative rental property, or a combination of both, this duplex offers the flexibility to create your dream living space. Don't miss your chance to own a piece of Holy Cross history and make your mark on this charming neighborhood. Contact me today to schedule a showng!
Key facts
- Walking distance
- Gutted duplex
- Prime location
Tags
Neighborhood map
What this means for you Summary
Snapshot
- This is a 5-bed/2.0-bath multifamily listed at $150k. Condition is rated poor.
Deal economics
- At list price, monthly cash flow is $1k ($14k/yr) — positive.
- The deal already cash-flows at list — no discount required.
- Meets the 1% rule at list price ($3k rent vs $150k).
- Recommended offer: $132k (12.0% below list) — sets the bar for market timing.
- Cap rate 16.3% vs local median 4.4% in New Orleans — top-decile yield for the area; either an underpriced asset or a hidden risk that comps aren't pricing in. Stress-test before assuming the spread holds.
Location & tenants
- Location reads 81/100 on livability (#3 in LA, #1,383 nationally) — a professional / high-income tenant draw. Strengths: amenities A+, commute A+, health & safety A+; Watch: crime C-, employment D.
- Orleans Parish (urban): math 11% / reading 27% proficiency, ranked #69 of 98 in LA (top 70%) — low school quality limits family demand, transient renter base, plan for 1-2y turnover; 68% free/reduced lunch — lower-income household profile, screen leases tightly.
- Market conditions: Rents rising (+2.5%/yr); 581 active listings in the ZIP; 6 comparable units currently listed for rent nearby; rentals at typical pace (median 25d on market — plan ~3-4 weeks tenant-placement turnaround); 710 units permitted in Orleans Parish in 2024 (244 in 5+ unit buildings).
- At $2,897/mo this rent would consume 76% of the median local household income ($46k/yr) (locally 1988% of renters already pay >50% of income on rent) — very limited rent-growth headroom before tenants either downsize or default.
Forward outlook
- Local home prices are declining (-3.0%/yr); year-one equity from $1k of loan paydown is wiped out by about $4k of value loss. Plan a longer hold.
- Orleans County population projected at +61% by 2050 — long-run rental-demand tailwind backs the buy-and-hold thesis.
- At projected returns (-3.0% appreciation + 2.5% rent growth), your $42k cash investment doubles in ~4 years — after that, you're playing with house money.
Negotiation context
- It's been on market 352 days — a 12% lower offer ($132k) is reasonable based on typical stale-listing flexibility.
- 2 sale attempts since 2y ago with the ask held roughly flat each time — persistent listings suggest the price (not the market) is what's stuck; bring a comps-based counter.
Risks & watch-outs
- Watch-outs: flood insurance adds $66/mo.
- Climate carrying-cost: severe flood risk; severe wind risk, 99% chance of damaging wind over 30y; extreme-heat days projected 7→21/yr by 2055 (HVAC capex compounding) — expect insurance premiums to compound above CPI over the hold.
Questions for the listing agent
- It's been on market 352 days. Have you received any prior offers? Is the seller open to a 12% concession, seller financing, or rate buy-down credit?
- Have any recent inspections been done? Can we get a copy of the seller's disclosures and any deferred-maintenance estimates?
- What's the actual annual flood-insurance premium (NFIP or private), and is the property in a SFHA with mandatory coverage?
- Why hasn't it sold? Are there any deal-killer items the seller is aware of (foundation, flood, title, zoning, code violations)?
- Is there a deadline driving the sale (1031 exchange, divorce, estate, relocation)? That informs how much negotiation room exists.
- What's the average days-on-market for RENTAL listings here right now (not sales)? A rising rental-DOM trend means longer vacancies and softer asking-rent achievability than the comps imply.
- What's the recent tenant-quality profile in this submarket — average credit score on applications, eviction rate, late-payment / NSF rate, and stable-employment percentage? A property-management company in the area should have these aggregated.
- How much new apartment / multifamily construction is in the pipeline within 1–3 miles? Heavy new supply (>2% of stock underway) typically softens rents 12–24 months out; light construction supports rent growth.
Investment metrics
- 1% rule
- 1.93% ✓
- Cap rate
- 16.32%
- Cash-on-cash
- 35.82%
- DSCR
- 2.59
- GRM
- 4.3
CMA / ARV
- ARV (median comp)
- $212,248
- List price
- $149,900
- Delta
- -29.38%
- Verdict
- UNDERPRICED
- Comps
- 20 within 1.0 mi
Show comp detail 9 sales within ~0.75 mi
| Address | Dist | Beds/Ba | Sqft | Sold | Price | $/sf | Match |
|---|---|---|---|---|---|---|---|
| 4731 33 Dauphine St | 0.11mi | 4/2.0 (-1) | 1,985 (+0%) | 12mo | $300,000 | $151 | 80 |
| 4716-18 Burgundy St | 0.11mi | 4/2.0 (-1) | 1,934 (-2%) | 11mo | $283,600 | $147 | 77 |
| 1135 37 Deslonde St | 0.20mi | 6/2.0 (+1) | 2,132 (+8%) | 7mo | $215,000 | $101 | 67 |
| 901 03 Jourdan Ave | 0.05mi | 4/2.0 (-1) | 1,767 (-11%) | 18mo | $120,000 | $68 | 60 |
| 1008 10 Charbonnet St | 0.63mi | 6/2.0 (+1) | 2,016 (+2%) | 16mo | $46,000 | $23 | 50 |
| 1205 07 Deslonde St | 0.22mi | 6/2.0 (+1) | 1,704 (-14%) | 14mo | $125,000 | $73 | 49 |
| 1310 12 Lesseps St | 0.60mi | 6/2.0 (+1) | 2,125 (+7%) | 16mo | $435,000 | $205 | 41 |
| 4023 25 Dauphine St | 0.65mi | 4/3.5 (-1) | 2,168 (+9%) | 11mo | $489,000 | $226 | 34 |
| 5717 19 Royal St | 0.63mi | 4/2.0 (-1) | 1,716 (-14%) | 14mo | $175,000 | $102 | 32 |
Match score weights: distance 35% · size 25% · config 20% · recency 20%. Top-matched comps best support the ARV.
Projected returns pro-forma
-3.0% appreciation · 2.49% rent growth · sell at horizon
- IRR
- 28.7%
- Equity multiple
- 2.19×
- Total profit
- $49,868
- Equity at exit
- $22,351
- IRR
- 35.8%
- Equity multiple
- 4.22×
- Total profit
- $135,046
- Equity at exit
- $12,961
Cash invested: $41,972 (down + closing). Projections, not guarantees.
Landlord ↔ Tenant lean methodology
- Overall (STATE)
- 90 Strongly Landlord-Friendly
- State Louisiana
- 90 Strongly Landlord-Friendly · R+12
- County
- — inherits STATE
- City
- — inherits STATE
ZIP-level market 70117
- Rents YoY
- 2.5%
- Active inventory
- 581
- Price-to-rent
- 8.6×
Monthly cashflow live
- Estimated rent
- $2,897 high interval (Pro) →
- Mortgage (P&I)
- −$786
- Tax est. 1.5%
- −$187 /mo · $2,248/yr
- Insurance
- −$62
- Flood insurance flood zone
- −$66 /mo · $798/yr
- HOA
- −$0
- Vacancy / Maint / Mgmt
- −$608
- Net cashflow
- $1,186
Break-even live
Sensitivity live
| Price | -10% $1,290 | -5% $1,238 | +0% $1,186 | +5% $1,134 | +10% $1,083 |
|---|---|---|---|---|---|
| Rent | -10% $957 | -5% $1,072 | +0% $1,186 | +5% $1,301 | +10% $1,415 |
| Rate | -1.0pp $1,262 | -0.5pp $1,224 | base $1,186 | +0.5pp $1,147 | +1.0pp $1,108 |
2-unit breakdown (identical units grouped — click to expand)
| Units | Beds | Baths | Est. rent |
|---|---|---|---|
| 2× units | 2 | 1 | $2,898 |
| #1 | 2 | 1 | $1,449 |
| #2 | 2 | 1 | $1,449 |
| Total (2 units) | $2,897 | ||
UW: 25.0% down · 7.5% · 30yr · 1.5% tax · 5.0% vac · 8.0% maint · 8.0% mgmt
Financing live
Cash to close
- Down payment
- $37,475
- Closing costs
- $4,497
- Reserves months
- —
- Total cash needed
- —
Loan-product check · same deal, 3 products live
Conventional
25% down · 7.5% · 30yr
- Down + closing
- —
- Monthly P&I
- —
- Monthly cashflow
- —
- DSCR
- —
- Eligible?
- —
Personal DTI + credit; lowest rate.
DSCR
20% down · 8.5% · 30yr
- Down + closing
- —
- Monthly P&I
- —
- Monthly cashflow
- —
- DSCR
- —
- Eligible?
- —
No personal income docs; deal must DSCR.
Hard money
10% down · 12.0% · 12mo
- Down + closing
- —
- Monthly P&I
- —
- Monthly cashflow
- —
- DSCR
- —
- Eligible?
- —
Short-term bridge; refi at stabilization.
Rent comps 6 comps
| Address | Beds | Baths | Sqft | Rent | $/sqft | DOM | Units | Dist |
|---|---|---|---|---|---|---|---|---|
| 5459 Saint Claude Ave Unit 5461 New Orleans, LA | 4.0 | 2.0 | 1454 | $2,350 | $1.62 | 24d | 1 | 0.47mi |
| 5461 Saint Claude Ave New Orleans, LA | 4.0 | 2.0 | 1250 | $2,350 | $1.88 | 24d | 1 | 0.48mi |
| 1314 Lamanche St New Orleans, LA | 4.0 | 1.0 | 1300 | $2,100 | $1.62 | 16d | 1 | 0.67mi |
| 5624-5626 Saint Claude ST New Orleans, LA | 4.0 | 3.0 | 1521 | $2,300 | $1.51 | 24d | 1 | 1.12mi |
| 1824 Saint Maurice Ave New Orleans, LA | 4.0 | 2.0 | 1500 | $1,500 | $1.00 | 24d | 1 | 1.17mi |
| 2019 Gallier St New Orleans, LA | 4.0 | 2.0 | 1400 | $2,200 | $1.57 | 24d | 1 | 1.25mi |
Listing history 2 events
-
2025-06-09$149,900 Active 851-char remark
Show marketing remark (851 chars)
Welcome to an exceptional opportunity in the highly desirable Holy Cross neighborhood of New Orleans! This gutted duplex, ripe for renovation, offers endless possibilities for customization and investment. Nestled in a vibrant community known for its historic charm and close-knit feel, this property stands as a blank canvas awaiting your vision. Boasting a prime location, you'll be within walking distance of the scenic Mississippi River, local parks, and the bustling cultural scenes of the Bywater and Marigny districts. Whether you envision a stunning single-family home, a lucrative rental property, or a combination of both, this duplex offers the flexibility to create your dream living space. Don't miss your chance to own a piece of Holy Cross history and make your mark on this charming neighborhood. Contact me today to schedule a showng!
-
2024-05-15$165,000 Active
ⓘ Source: listings_history table (triggers on properties + properties_extension) + one-shot
backfill from property_details.listing_events for pre-trigger history.
Climate risk First Street
- Flood 8/10 Severe FEMA zone X (shaded) · 60% chance over 30 yrs
- Wildfire 1/10 Low
- Heat 10/10 Extreme 7 d/yr ≥108°F today · 21 d/yr by 30 yrs out
- Wind 10/10 Extreme 99% chance of damaging wind over 30 yrs
- Air quality 3/10 Moderate 3 unhealthy d/yr today · 3 by 30 yrs out
Nearby sold comps map
Loading sold comps map…
Walkable amenities ~0.75 mi
Loading nearby amenities…
Taxation est. · year 1
- Rental income
- $34,764
- − Mortgage interest
- −$8,397
- − Property taxes
- −$2,248
- − Insurance
- −$1,547
- − Repairs & maintenance
- −$2,781
- − Management
- −$2,781
- − Depreciation
- −$4,361
- Taxable income
- $12,649
- Est. tax owed @ 24.0%
- −$3,036
- After-tax cash flow
- $11,199/yr
For passive investors: Depreciation is non-cash, so a rental often shows a tax loss while cash-flowing — sheltering income. Rental losses are passive: they offset passive income freely, and up to $25,000/yr can offset ordinary (W-2) income if you actively participate and your MAGI is under $100k (phasing out to $0 by $150k); unused losses carry forward. On sale, claimed depreciation is recaptured at up to 25%, and gains may owe capital-gains tax (a 1031 exchange can defer both). Figures are a year-1 estimate at your 24.0% rate — not tax advice; consult a CPA.
Condition & rehab AI · 12 photos
This gutted duplex requires extensive renovation, including exterior siding, interior framing, and HVAC systems, to become move-in ready. Significant structural work is needed to restore the property's value.
Repairs flagged
- Major Exterior siding — Severe damage and weathering
- Major Interior framing — Significant structural work needed
- Major Exposed concrete floor — Needs replacement
- Major Exposed windows — Structural work required
- Major Exposed HVAC components — Structural work needed
Value-add opportunities
- Both Exterior siding replacement — Improves curb appeal and property value
- Both Interior framing and drywall installation — Restores structural integrity and creates livable spaces
- Both Concrete floor replacement — Enhances living space and safety
- Both Window installation — Restores structural integrity and improves energy efficiency
- Both HVAC system installation — Enhances comfort and energy efficiency
Renovation cost estimate screening
| Repair item | Severity | Est. cost |
|---|---|---|
| Exterior siding · Severe damage and weathering | Major | $15,000–50,000 |
| Interior framing · Significant structural work needed | Major | $15,000–50,000 |
| Exposed concrete floor · Needs replacement | Major | $15,000–50,000 |
| Exposed windows · Structural work required | Major | $15,000–50,000 |
| Exposed HVAC components · Structural work needed | Major | $15,000–50,000 |
| Total estimated repair cost · 5 items | $75,000–250,000 |
Value-add ROI direction
- Both Exterior siding replacement — Improves curb appeal and property value ↑
- Both Interior framing and drywall installation — Restores structural integrity and creates livable spaces ↑
- Both Concrete floor replacement — Enhances living space and safety ↑
- Both Window installation — Restores structural integrity and improves energy efficiency ↑
- Both HVAC system installation — Enhances comfort and energy efficiency ↑
ⓘ Cost ranges are severity-bucket heuristics (US national rule-of-thumb). Get contractor quotes + a written scope before underwriting a rehab budget.
Schools (NCES district)
- District
- Orleans Parish
- NCES district ID
- 2201170
- Math proficiency
- 11% ▼ -52.00%
- Reading proficiency
- 27% ▼ -46.00%
- Median HH income
- $37,011
- Composite
- 15.78/100
- National rank
- #9271
- State rank
- #69 of 98 in LA
Livability — New Orleans
- Score
- 81/100
- State rank
- #3
- US rank
- #1383
Category grades
Schools grade is shown separately in the Schools card above.
Census & demographics
- Census place
- New Orleans, LA
- County
- Orleans Parish · 338,817 people
- City population
- 338,817
- Metro
- New Orleans-Metairie, LA
- Population (ZIP)
- 25,652
- Household income
- $45,764
- Rent vs Own
- Severe rent burden
- 1988.0
Population outlook (Orleans County) Hauer SSP2
- Today (2025)
- 513,025 people
- By 2030
- 575,781 · +12.2%
- By 2040
- 700,174 · +36.5%
- By 2050
- 826,541 · +61.1%
- By 2075
- 1,123,374 · +119.0%
- By 2100
- 1,355,609 · +164.2%
Race, ethnicity, and origin ACS 2023
- Neighborhood character
- Majority Black (60%)
- Race & ethnicity
- Black 60% White 30% Two or more races 6% Hispanic / Latino 5%
- Common ancestry
- Lithuanian 5% Italian 1% Romanian 1%
- Foreign-born
- 5% · Canada, South Korea
- Languages at home
- 93% English-only · Spanish 3% Other Indo-European 1% French/Haitian/Cajun 1%
Political lean MEDSL · Orleans
- 2024 margin
- Solid D (+67.0) · D 82.2% · R 15.2% · Other 2.7%
- 2008→2024 swing
- +6.7pp toward D · 2008: 60.3pp · 2024: 67.0pp
- All cycles
- 2024: D+67.0 2020: D+68.2 2016: D+66.2 2012: D+62.5 2008: D+60.3
Not yet ingested
- Civics
- —
Market trends
- HPI YoY
- ▼ -177.22%
- Current HPI
- 184.6061
- Rent YoY
- ▲ 2.49%
- Metro
- New Orleans-Metairie, LA
- State GDP YoY
- ▲ 3.29%
- F500 in state
- 10
Industry mix (Fortune 500 HQ in LA)
| Industry | F500 HQs | Revenue |
|---|---|---|
| Telecommunications | 2 | $23B |
|
||
| Utilities | 1 | $12B |
|
||
| Wholesale / Distribution | 1 | $5B |
|
||
| Advertising | 1 | $2B |
|
||
Price history
-9.2% since first listed2 events — show timeline
- 2025-06-09 Listed $149,900 AcadianaMLS
- 2024-05-15 Listed $165,000 AcadianaMLS
Cash-flow waterfall
monthlySold comps — $/sqft
last 12 mo · ≤1 miLoading sold comps…