 🌊 Lakefront
849 S Gun Barrel Ln Unit G7 · Gun Barrel City, TX
Flood risk 1/10 · Minimal
- FEMA flood zone
- X (unshaded)
- Chance of flooding over 30 yrs
- 0.0%
- Est. flood insurance / yr
- $507 – $1,088
Fire risk 3/10 · Minor
- Est. fire insurance / yr
- $1,222 – $2,270
Heat risk 7/10 · Major
- Hot days now (above 109°F)
- 7 days/yr
- Hot days in 30 yrs
- 25 days/yr
Wind risk 6/10 · Moderate
- Chance of severe wind over 30 yrs
- 69.0%
Air-quality risk 2/10 · Minimal
- Unhealthy air days now
- 0 days/yr
- Unhealthy air days in 30 yrs
- 1 days/yr
Risk factors via First Street. Map © Google.
Why this score? — see what drove the D grade
The composite is a weighted blend of 9 inputs, each scored 0–100. Each bar is that input's sub-score; the figure is the points it added to the 100-point composite (weight × sub-score).
- ARV discount +15.0/15.0
- Cash flow +7.8/30.0
- 1% rule +5.4/10.0
- Schools +3.8/10.0
- Livability +3.4/5.0
- Condition / age +2.5/5.0
- DSCR +1.8/10.0
- Rent growth +1.1/5.0
- Appreciation +0.0/10.0
$140,000
🖨 Deal sheet (PDF) 📄 Offer letter ✓ Due diligence
Listing remarks MLS
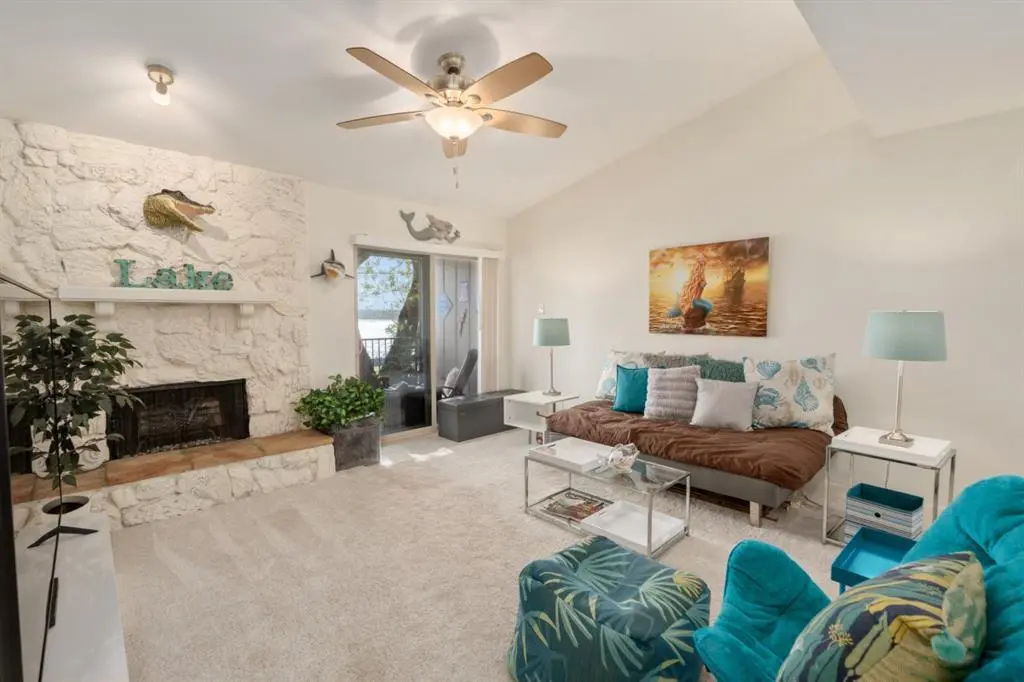
Welcome to this serene lakeside retreat in Gun Barrel City. This beautifully updated condominium offers breathtaking views of Cedar Creek Lake, creating the perfect escape from everyday living. Step inside to an inviting, modern interior featuring tasteful upgrades throughout. The recently renovated kitchen boasts granite countertops, stainless steel appliances, and a convenient breakfast bar, seamlessly opening to the main living area. A whitewashed stone fireplace serves as a charming focal point, adding warmth and character, while the dedicated dining area is ideal for entertaining. Enjoy peaceful lake views from the spacious private balcony—perfect for relaxing or hosting guests. Lifescape Condominiums provide an affordable, lock-and-leave lifestyle with desirable amenities, including a community pool for leisure and social gatherings. Ideally located near local marinas and boat storage facilities, this property offers easy access to a variety of water activities. Conveniently situated close to shopping and dining in Gun Barrel City and Mabank, and within the highly regarded Mabank ISD.
Key facts
- $343 HOA
- Parking
- Community pool
Neighborhood map
What this means for you Summary
Snapshot
- This is a 2-bed/2.0-bath condo listed at $140k.
Deal economics
- At list price, monthly cash flow is $-158 ($-2k/yr) — negative.
- To cash-flow at today's rent, offer at most $112k (20.0% below list).
- Meets the 1% rule at list price ($1k rent vs $140k).
- Recommended offer: $112k (20.0% below list) — sets the bar for cash-flow.
- Cap rate 4.9% vs local median 3.2% in Gun Barrel City — top-decile yield for the area; either an underpriced asset or a hidden risk that comps aren't pricing in. Stress-test before assuming the spread holds.
Location & tenants
- Location reads 67/100 on livability (#519 in TX) — a middle-class / working-renter tenant base. Strengths: cost of living A+, housing A+, health & safety B+; Watch: employment D+, amenities F, commute F.
- Mabank ISD (town): math 47% / reading 44% proficiency, ranked #273 of 826 in TX (top 33%) — families likely to look elsewhere, expect single-tenant / working-renter base with shorter leases.
- Zoned schools: Southside El (math 37% / reading 37%, grade F, #1,769 of 4,322 statewide, top 44%, 486 students, 80% FRL); Mabank Int (math 49% / reading 34%, grade F, #595 of 1,662 statewide, top 37%, 611 students, 66% FRL); Mabank H S (math 36% / reading 53%, grade F, #652 of 1,632 statewide, top 43%, 1,111 students, 57% FRL).
- Market conditions: Rents falling (-5.8%/yr); 705 active listings in the ZIP; 2 comparable units currently listed for rent nearby; 263 units permitted in Henderson County in 2024 (0 in 5+ unit buildings).
Forward outlook
- Local home prices are declining (-3.0%/yr); year-one equity from $968 of loan paydown is wiped out by about $4k of value loss. Plan a longer hold.
Negotiation context
- It's been on market 76 days — a 6% lower offer ($132k) is reasonable based on typical stale-listing flexibility.
- 5 sale attempts since 9y ago with the ask held roughly flat each time — persistent listings suggest the price (not the market) is what's stuck; bring a comps-based counter.
Risks & watch-outs
- Watch-outs: HOA is 23% of rent.
- Climate carrying-cost: major wind risk, 69% chance of damaging wind over 30y; extreme-heat days projected 7→25/yr by 2055 (HVAC capex compounding) — expect insurance premiums to compound above CPI over the hold.
Questions for the listing agent
- What do current leases actually rent for vs. the listed asking? Can we see a recent rent roll and the last 12 months of T-12 income?
- It's been on market 76 days. Have you received any prior offers? Is the seller open to a 20% concession, seller financing, or rate buy-down credit?
- What does the HOA fee cover, when was the last increase, and are there any pending special assessments or reserve-fund shortfalls?
- Any open or pending special assessments — roof, HVAC, plumbing, elevator, façade? What's the per-unit balance and payoff schedule, and is the seller paying it off at close or rolling it to the buyer?
- Why hasn't it sold? Are there any deal-killer items the seller is aware of (foundation, flood, title, zoning, code violations)?
- Is there a deadline driving the sale (1031 exchange, divorce, estate, relocation)? That informs how much negotiation room exists.
- The area grade is low — what's the realistic commute time and amenity access for the typical tenant pool here? Any planned neighborhood developments (good or bad) we should know about?
- This sits on a lake — are riparian / water-frontage rights deeded with the parcel? Any dock permits, shoreline easements, or HOA water-use restrictions?
- What's the documented flood / surge / shoreline-erosion history here (FEMA AND non-FEMA — e.g., storm surge, creek backup, septic-field saturation)?
- Any water-quality or seasonal algae-bloom issues that affect tenant satisfaction or short-term-rental demand?
- What's the average days-on-market for RENTAL listings here right now (not sales)? A rising rental-DOM trend means longer vacancies and softer asking-rent achievability than the comps imply.
- What's the recent tenant-quality profile in this submarket — average credit score on applications, eviction rate, late-payment / NSF rate, and stable-employment percentage? A property-management company in the area should have these aggregated.
- How much new apartment / multifamily construction is in the pipeline within 1–3 miles? Heavy new supply (>2% of stock underway) typically softens rents 12–24 months out; light construction supports rent growth.
Investment metrics
- 1% rule
- 1.04% ✓
- Cap rate
- 4.94%
- Cash-on-cash
- -4.84%
- DSCR
- 0.78
- GRM
- 8.0
CMA / ARV
- ARV (median comp)
- $256,661
- List price
- $140,000
- Delta
- -45.45%
- Verdict
- UNDERPRICED
- Comps
- 20 within 1.0 mi
Projected returns pro-forma
-3.0% appreciation · 0.0% rent growth · sell at horizon
- IRR
- -29.2%
- Equity multiple
- 0.06×
- Total profit
- $-36,809
- Equity at exit
- $20,874
- IRR
- -58.9%
- Equity multiple
- -0.55×
- Total profit
- $-60,617
- Equity at exit
- $12,105
Cash invested: $39,200 (down + closing). Projections, not guarantees.
Landlord ↔ Tenant lean methodology
- Overall (STATE)
- 87 Strongly Landlord-Friendly
- State Texas
- 87 Strongly Landlord-Friendly · R+5
- County
- — inherits STATE
- City
- — inherits STATE
ZIP-level market 75156
- Rents YoY
- -5.8%
- Active inventory
- 705
- Price-to-rent
- 8.0×
Monthly cashflow live
- Estimated rent
- $1,460 medium interval (Pro) →
- Mortgage (P&I)
- −$734
- Tax from tax record
- −$176 /mo · $2,115/yr
- Insurance
- −$58
- HOA
- −$343
- Vacancy / Maint / Mgmt
- −$307
- Net cashflow
- $-158
Break-even live
Sensitivity live
| Price | -10% $-79 | -5% $-119 | +0% $-158 | +5% $-198 | +10% $-237 |
|---|---|---|---|---|---|
| Rent | -10% $-274 | -5% $-216 | +0% $-158 | +5% $-101 | +10% $-43 |
| Rate | -1.0pp $-88 | -0.5pp $-123 | base $-158 | +0.5pp $-194 | +1.0pp $-231 |
UW: 25.0% down · 7.5% · 30yr · 1.5% tax · 5.0% vac · 8.0% maint · 8.0% mgmt
Financing live
Cash to close
- Down payment
- $35,000
- Closing costs
- $4,200
- Reserves months
- —
- Total cash needed
- —
Loan-product check · same deal, 3 products live
Conventional
25% down · 7.5% · 30yr
- Down + closing
- —
- Monthly P&I
- —
- Monthly cashflow
- —
- DSCR
- —
- Eligible?
- —
Personal DTI + credit; lowest rate.
DSCR
20% down · 8.5% · 30yr
- Down + closing
- —
- Monthly P&I
- —
- Monthly cashflow
- —
- DSCR
- —
- Eligible?
- —
No personal income docs; deal must DSCR.
Hard money
10% down · 12.0% · 12mo
- Down + closing
- —
- Monthly P&I
- —
- Monthly cashflow
- —
- DSCR
- —
- Eligible?
- —
Short-term bridge; refi at stabilization.
Rent comps 2 comps
| Address | Beds | Baths | Sqft | Rent | $/sqft | DOM | Units | Dist |
|---|---|---|---|---|---|---|---|---|
| 114 Timber Crst Mabank, TX | 2.0 | 2.0 | 950 | $1,300 | $1.37 | 45d | 1 | 1.17mi |
| 367 Box Rd Gun Barrel City, TX | 3.0 | 2.0 | 1216 | $1,600 | $1.32 | 45d | 1 | 1.36mi |
HOA detail condo
- Monthly dues
- $343 · $4,116/yr
- Likely covers
- waterpool
- Assessments
- None detected in remarks — confirm with the listing agent.
Listing history 38 events
-
2026-06-22days on market $140,000 Active 76 DOM
-
2026-06-21days on market $140,000 Active 75 DOM
-
2026-06-19days on market $140,000 Active 73 DOM
-
2026-06-18days on market $140,000 Active 72 DOM
-
2026-06-17days on market $140,000 Active 71 DOM
-
2026-06-16days on market $140,000 Active 70 DOM
-
2026-06-15days on market $140,000 Active 69 DOM
-
2026-06-14days on market $140,000 Active 67 DOM
-
2026-06-12days on market $140,000 Active 66 DOM
-
2026-06-09days on market $140,000 Active 63 DOM
-
2026-06-08days on market $140,000 Active 62 DOM
-
2026-06-07days on market $140,000 Active 61 DOM
-
2026-06-05days on market $140,000 Active 58 DOM
-
2026-06-03days on market $140,000 Active 57 DOM
-
2026-06-02days on market $140,000 Active 56 DOM
-
2026-06-01days on market $140,000 Active 55 DOM
-
2026-05-31days on market $140,000 Active 54 DOM
-
2026-05-30days on market $140,000 Active 53 DOM
-
2026-04-07$140,000 Active 1113-char remark
Show marketing remark (1113 chars)
Welcome to this serene lakeside retreat in Gun Barrel City. This beautifully updated condominium offers breathtaking views of Cedar Creek Lake, creating the perfect escape from everyday living. Step inside to an inviting, modern interior featuring tasteful upgrades throughout. The recently renovated kitchen boasts granite countertops, stainless steel appliances, and a convenient breakfast bar, seamlessly opening to the main living area. A whitewashed stone fireplace serves as a charming focal point, adding warmth and character, while the dedicated dining area is ideal for entertaining. Enjoy peaceful lake views from the spacious private balcony—perfect for relaxing or hosting guests. Lifescape Condominiums provide an affordable, lock-and-leave lifestyle with desirable amenities, including a community pool for leisure and social gatherings. Ideally located near local marinas and boat storage facilities, this property offers easy access to a variety of water activities. Conveniently situated close to shopping and dining in Gun Barrel City and Mabank, and within the highly regarded Mabank ISD.
-
2024-09-27historical
-
2024-08-20price $159,000
-
2024-06-06price $169,900
-
2024-03-30$179,900 Active
-
2020-12-30soldstatus Sold
-
2020-12-30soldstatus
-
2020-10-05status Pending
-
2020-05-04$129,900 Active
-
2018-09-24soldstatus
-
2018-03-16historical
-
2017-11-20price $98,000
-
2017-09-15$100,000 Active
-
2017-08-20historical
-
2017-07-21$110,000 Active
-
2012-10-18soldstatus
-
2003-10-08soldstatus
-
2002-08-01soldstatus
-
2001-06-13soldstatus
-
2001-06-08soldstatus
ⓘ Source: listings_history table (triggers on properties + properties_extension) + one-shot
backfill from property_details.listing_events for pre-trigger history.
Tax reassessment forecast TX · Resets to sale price
- Current annual tax
- $2,115 · $176/mo
- Projected year-2 tax
- $2,562 · $214/mo
- Expected delta
- +$447/yr (+$37/mo · 21.1%)
ⓘ Screening estimate from a state-policy table — verify with the county assessor before closing.
Climate risk First Street
- Flood 1/10 Low FEMA zone X (unshaded) · 0% chance over 30 yrs
- Wildfire 3/10 Moderate
- Heat 7/10 Severe 7 d/yr ≥109°F today · 25 d/yr by 30 yrs out
- Wind 6/10 Major 69% chance of damaging wind over 30 yrs
- Air quality 2/10 Low 0 unhealthy d/yr today · 1 by 30 yrs out
Nearby sold comps map
Loading sold comps map…
Walkable amenities ~0.75 mi
Loading nearby amenities…
Taxation est. · year 1
- Rental income
- $17,522
- − Mortgage interest
- −$7,842
- − Property taxes
- −$2,115
- − Insurance
- −$700
- − Repairs & maintenance
- −$1,402
- − Management
- −$1,402
- − HOA
- −$4,116
- − Depreciation
- −$4,073
- Taxable loss
- −$4,127
- Est. tax savings @ 24.0%
- +$991
- After-tax cash flow
- $-908/yr
For passive investors: Depreciation is non-cash, so a rental often shows a tax loss while cash-flowing — sheltering income. Rental losses are passive: they offset passive income freely, and up to $25,000/yr can offset ordinary (W-2) income if you actively participate and your MAGI is under $100k (phasing out to $0 by $150k); unused losses carry forward. On sale, claimed depreciation is recaptured at up to 25%, and gains may owe capital-gains tax (a 1031 exchange can defer both). Figures are a year-1 estimate at your 24.0% rate — not tax advice; consult a CPA.
Schools (NCES district)
- District
- Mabank ISD
- NCES district ID
- 4828680
- Math proficiency
- 47% ▼ -19.00%
- Reading proficiency
- 44% ▼ -11.00%
- Median HH income
- $40,321
- Composite
- 38.15/100
- National rank
- #4267
- State rank
- #273 of 826 in TX
Livability — Gun Barrel City
- Score
- 67/100
- State rank
- #519
- US rank
- #10212
Category grades
Schools grade is shown separately in the Schools card above.
Census & demographics
- Census place
- Gun Barrel City, TX
- County
- Henderson County · 34,977 people
- Metro
- Athens, TX
- Population (ZIP)
- 16,333
- Household income
- $60,867
- Rent vs Own
- Severe rent burden
- 400.0
Population outlook (Henderson County) Hauer SSP2
- Today (2025)
- 80,471 people
- By 2030
- 80,608 · +0.2%
- By 2040
- 80,087 · -0.5%
- By 2050
- 78,208 · -2.8%
- By 2075
- 72,423 · -10.0%
- By 2100
- 61,012 · -24.2%
Race, ethnicity, and origin ACS 2023
- Neighborhood character
- Predominantly White (85%)
- Race & ethnicity
- White 85% Hispanic / Latino 7% Two or more races 7% Black 1%
- Hispanic origin (detail)
- Mexican 5%
- Common ancestry
- Slovak 3% Serbian 2% European 2%
- Foreign-born
- 4% · Canada, Jamaica
- Languages at home
- 94% English-only · Spanish 4% Other Indo-European 1%
Political lean MEDSL · Henderson
- 2024 margin
- Solid R (+63.5) · D 18.0% · R 81.4%
- 2008→2024 swing
- -18.8pp toward R · 2008: -44.6pp · 2024: -63.5pp
- All cycles
- 2024: R+63.5 2020: R+60.2 2016: R+60.0 2012: R+54.8 2008: R+44.6
Not yet ingested
- Civics
- —
Market trends
- HPI YoY
- ▼ -216.77%
- Current HPI
- 199.8108
- Rent YoY
- ▼ -5.76%
- Metro
- Athens, TX
- State GDP YoY
- ▲ 3.95%
- F500 in state
- 110
Industry mix (Fortune 500 HQ in TX)
| Industry | F500 HQs | Revenue |
|---|---|---|
| Energy | 16 | $1,198B |
|
||
| Technology | 5 | $198B |
|
||
| Engineering / Construction | 4 | $72B |
|
||
| Energy Services | 3 | $60B |
|
||
| Utilities | 3 | $41B |
|
||
| Healthcare | 2 | $330B |
|
||
Price history
+27.3% since first listed20 events — show timeline
- 2026-04-07 Listed $140,000 NTREIS
- 2024-09-27 Listing Removed — NTREIS
- 2024-08-20 Price Changed $159,000 NTREIS
- 2024-06-06 Price Changed $169,900 NTREIS
- 2024-03-30 Listed $179,900 NTREIS
- 2020-12-30 Sold (Public Records) — Public Records
- 2020-12-30 Sold (MLS) — NTREIS
- 2020-10-05 Pending — NTREIS
- 2020-05-04 Listed $129,900 NTREIS
- 2018-09-24 Sold (Public Records) — Public Records
- 2018-03-16 Listing Removed — NTREIS
- 2017-11-20 Price Changed $98,000 NTREIS
- 2017-09-15 Listed $100,000 NTREIS
- 2017-08-20 Listing Removed — NTREIS
- 2017-07-21 Listed $110,000 NTREIS
- 2012-10-18 Sold (Public Records) — Public Records
- 2003-10-08 Sold (Public Records) — Public Records
- 2002-08-01 Sold (Public Records) — Public Records
- 2001-06-13 Sold (Public Records) — Public Records
- 2001-06-08 Sold (Public Records) — Public Records
Property tax history
+6.7%/yrLatest (2025): $2,115 · +0.5% YoY. Source: county tax records.
Cash-flow waterfall
monthlySold comps — $/sqft
last 12 mo · ≤1 miLoading sold comps…