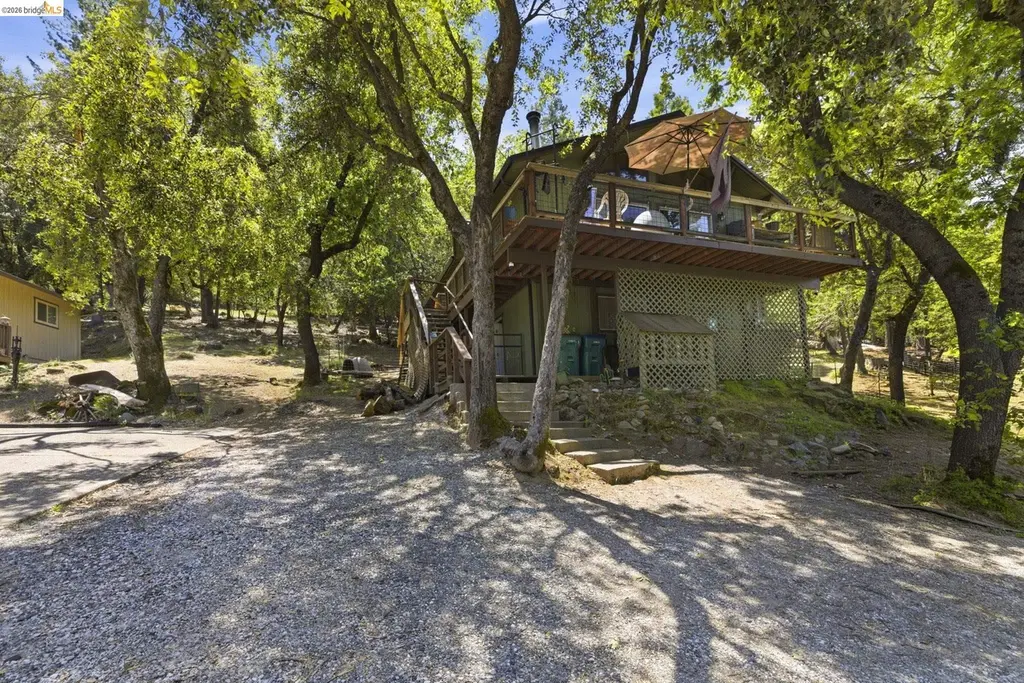
17221 Smokey River Dr · Mono Vista, CA
Flood risk 1/10 · Minimal
- FEMA flood zone
- X (unshaded)
- Chance of flooding over 30 yrs
- 0.0%
- Est. flood insurance / yr
- $507 – $1,088
Fire risk 8/10 · Major
- Est. fire insurance / yr
- $659 – $1,223
Heat risk 4/10 · Minor
- Hot days now (above 93°F)
- 7 days/yr
- Hot days in 30 yrs
- 16 days/yr
Wind risk 1/10 · Minimal
- Chance of severe wind over 30 yrs
- —
Air-quality risk 10/10 · Severe
- Unhealthy air days now
- 29 days/yr
- Unhealthy air days in 30 yrs
- 33 days/yr
Risk factors via First Street. Map © Google.
Why this score? — see what drove the D+ grade
The composite is a weighted blend of 9 inputs, each scored 0–100. Each bar is that input's sub-score; the figure is the points it added to the 100-point composite (weight × sub-score).
- ARV discount +14.3/15.0
- Cash flow +14.0/30.0
- DSCR +4.2/10.0
- Schools +3.1/10.0
- 1% rule +3.0/10.0
- Livability +2.8/5.0
- Rent growth +2.5/5.0
- Condition / age +2.5/5.0
- Appreciation +0.0/10.0
$295,000
🖨 Deal sheet 📄 Offer letter ✓ Due diligence
Listing remarks
With a newer roof, fresh exterior paint, newer vinyl flooring, a cozy wood-burning fireplace, a comfortable kitchen and dining combo, a spacious deck with tree-lined views, a fenced yard, and ample parking, this home checks all the boxes for comfort, functionality, and peace of mind. Tucked away in the peaceful pines of Sonora, this charming 3-bedroom, 2.5-bath home is the perfect opportunity for a first-time buyer ready to step into homeownership or someone searching for a relaxing second home escape. Inside, the warm and inviting layout makes everyday living easy, while the fireplace creates the perfect setting for cozy evenings. Step outside to unwind on the private deck, enjoy the quiet
Key facts
- 0.52 acre lot
- Community pool
- Built 1978
Property features AI
Finance
- HOA & community: Part of Crystal Falls Homeowners Association; Quarterly HOA fee; Association amenities include clubhouse, park, and trails
Exterior
- Parking: No garage
- Utilities: Septic tank
- Home design: Single-family residence; Residential property; Built in 1978
- Construction: Wood siding; Shingle roof
- Exterior features: Back yard; Side yard; Low-maintenance yard; Deck and enclosed deck; On-site storage; Partial fencing
Interior
- Kitchen: Eat-in kitchen; Dishwasher
- Bedrooms: 5 rooms total (includes bedroom count within room total)
- Flooring: Vinyl flooring; Carpet
- Bathrooms: 3 bathrooms total — 2 full and 1 partial
- Heating & cooling: Electric heating; Wood stove; Wall/window cooling units
- Interior features: Storage; Bonus room; Free-standing wood-burning fireplace
- Laundry & utility: Laundry in an inside room
Neighborhood map
What this means for you Summary
Snapshot
- This is a 3-bed/2.5-bath single-family listed at $295k.
Deal economics
- At list price, monthly cash flow is $38 ($459/yr) — positive.
- The deal already cash-flows at list — no discount required.
- To meet the 1% rule (rent ≥ 1% of price), the offer needs to be $236k (19.9% below list).
- Recommended offer: $236k (19.9% below list) — sets the bar for 1% rule.
- Cap rate 6.4% vs local median 5.0% in Mono Vista — meaningfully above typical; check what's discounted (condition, days-on-market, listing class) to confirm the premium yield is real.
Location & tenants
- Location reads 56/100 on livability (#793 in CA) — a working-class tenant base; expect higher turnover. Strengths: housing A+, crime B, employment B; Watch: schools D, amenities F, commute F.
- Soulsbyville Elementary (town): math 30% / reading 38% proficiency, ranked #272 of 517 in CA (top 53%) — families likely to look elsewhere, expect single-tenant / working-renter base with shorter leases.
- Market conditions: 299 active listings in the ZIP; 2 comparable units currently listed for rent nearby; 60 units permitted in Tuolumne County in 2024 (0 in 5+ unit buildings).
Forward outlook
- Local home prices are declining (-3.0%/yr); year-one equity from $2k of loan paydown is wiped out by about $9k of value loss. Plan a longer hold.
- Tuolumne County population projected at -15% by 2050 — secular population decline; favor cash flow + early exit over multi-decade hold.
Negotiation context
- Only 13 days on market — expect competitive offers; lowballing is unlikely to land.
- 2 sale attempts with the ask held roughly flat each time — persistent listings suggest the price (not the market) is what's stuck; bring a comps-based counter.
- Current owner paid $83k; list at $295k implies a 255% gain — meaningful room to come down on a strong offer.
Risks & watch-outs
- Climate carrying-cost: severe wildfire risk — expect insurance premiums to compound above CPI over the hold.
Questions for the listing agent
- Built in 1978 — when were the roof, HVAC, electrical panel, plumbing, and water heater last replaced?
- What does the HOA fee cover, when was the last increase, and are there any pending special assessments or reserve-fund shortfalls?
- Is there a deadline driving the sale (1031 exchange, divorce, estate, relocation)? That informs how much negotiation room exists.
- Schools are D-rated, which usually means shorter tenancies and higher turnover. Who's the typical renter profile here, and what's been the actual vacancy rate?
- The area grade is low — what's the realistic commute time and amenity access for the typical tenant pool here? Any planned neighborhood developments (good or bad) we should know about?
- What's the average days-on-market for RENTAL listings here right now (not sales)? A rising rental-DOM trend means longer vacancies and softer asking-rent achievability than the comps imply.
- What's the recent tenant-quality profile in this submarket — average credit score on applications, eviction rate, late-payment / NSF rate, and stable-employment percentage? A property-management company in the area should have these aggregated.
- How much new for-sale + rental construction is in the pipeline within 1–3 miles? Heavy new supply typically softens prices + rents 12–24 months out; constrained supply supports both.
Investment metrics
- 1% rule
- 0.80% ✗
- Cap rate
- 6.45%
- Cash-on-cash
- 0.56%
- DSCR
- 1.02
- GRM
- 10.4
CMA / ARV
- ARV (on-the-fly)
- $347,760
- Comps found
- 12
Show comp detail 12 sales within ~0.75 mi
| Address | Dist | Beds/Ba | Sqft | Sold | Price | $/sf | Match |
|---|---|---|---|---|---|---|---|
| 17221 Smokey River Dr | 0.00mi | 3/2.5 | 1,512 (0%) | 0mo | $297,213 | $197 | 100 |
| 17223 Nile River Dr | 0.28mi | 3/2.0 | 1,631 (+8%) | 1mo | $350,000 | $215 | 71 |
| 17272 Nile River Dr | 0.22mi | 3/2.0 | 1,422 (-6%) | 9mo | $297,000 | $209 | 70 |
| 22420 E Rhine River Dr | 0.28mi | 3/2.0 | 1,617 (+7%) | 4mo | $399,000 | $247 | 70 |
| 17301 Smokey Riv | 0.13mi | 3/2.0 | 1,660 (+10%) | 9mo | $379,000 | $228 | 68 |
| 22447 Colorado River Dr | 0.12mi | 2/2.0 (-1) | 1,440 (-5%) | 14mo | $355,000 | $247 | 68 |
| 22502 S Colorado River Dr | 0.15mi | 3/2.0 | 1,712 (+13%) | 9mo | $335,000 | $196 | 61 |
| 22528 E Rhine River Dr | 0.30mi | 3/2.0 | 1,340 (-11%) | 7mo | $308,000 | $230 | 60 |
| 21984 Crystal Falls Dr | 0.66mi | 3/2.0 | 1,546 (+2%) | 7mo | $337,000 | $218 | 58 |
| 22101 Longeway Rd | 0.72mi | 3/2.0 | 1,540 (+2%) | 5mo | $362,000 | $235 | 57 |
| 22192 Crystal Falls Dr | 0.45mi | 3/2.0 | 1,374 (-9%) | 11mo | $369,000 | $269 | 52 |
| 16853 E Meadow Ln | 0.66mi | 3/2.0 | 1,440 (-5%) | 14mo | $336,500 | $234 | 48 |
Match score weights: distance 35% · size 25% · config 20% · recency 20%. Top-matched comps best support the ARV.
Projected returns pro-forma
-3.0% appreciation · 3.0% rent growth · sell at horizon
- IRR
- -15.5%
- Equity multiple
- 0.45×
- Total profit
- $-45,463
- Equity at exit
- $43,985
- IRR
- -7.0%
- Equity multiple
- 0.55×
- Total profit
- $-36,836
- Equity at exit
- $25,506
Cash invested: $82,600 (down + closing). Projections, not guarantees.
Landlord ↔ Tenant lean methodology
- Overall (STATE)
- 18 Strongly Tenant-Friendly
- State California
- 18 Strongly Tenant-Friendly · D+13
- County
- — inherits STATE
- City
- — inherits STATE
ZIP-level market 95370
- Active inventory
- 299
- Price-to-rent
- 10.4×
Monthly cashflow live
- Estimated rent
- $2,362 medium interval (Pro) →
- Mortgage (P&I)
- −$1,547
- Tax from tax record
- −$119 /mo · $1,430/yr
- Insurance
- −$123
- HOA
- −$39
- Vacancy / Maint / Mgmt
- −$496
- Net cashflow
- $38
Break-even live
UW: 25.0% down · 7.5% · 30yr · 1.5% tax · 5.0% vac · 8.0% maint · 8.0% mgmt
Financing live
Cash to close
- Down payment
- $73,750
- Closing costs
- $8,850
- Reserves months
- —
- Total cash needed
- —
Loan-product check · same deal, 3 products live
Conventional
25% down · 7.5% · 30yr
- Down + closing
- —
- Monthly P&I
- —
- Monthly cashflow
- —
- DSCR
- —
- Eligible?
- —
Personal DTI + credit; lowest rate.
DSCR
20% down · 8.5% · 30yr
- Down + closing
- —
- Monthly P&I
- —
- Monthly cashflow
- —
- DSCR
- —
- Eligible?
- —
No personal income docs; deal must DSCR.
Hard money
10% down · 12.0% · 12mo
- Down + closing
- —
- Monthly P&I
- —
- Monthly cashflow
- —
- DSCR
- —
- Eligible?
- —
Short-term bridge; refi at stabilization.
Rent comps 2 comps
| Address | Beds | Baths | Sqft | Rent | $/sqft | DOM | Units | Dist |
|---|---|---|---|---|---|---|---|---|
| 19011 Middle Camp Rd Twain Harte, CA | 3.0 | 2.0 | 1586 | $2,295 | $1.45 | 13d | 1 | 0.15mi |
| 21593 Crystal Falls Dr Sonora, CA | 3.0 | 2.0 | 1250 | $2,950 | $2.36 | 23d | 1 | 1.13mi |
HOA detail
- Monthly dues
- $39 · $468/yr
Listing history 5 events
-
2026-05-15status Pending
-
2026-05-02status Active
-
2026-04-25status Pending
-
2026-04-24$295,000 Active
-
1999-04-23soldstatus $83,000
ⓘ Source: listings_history table (triggers on properties + properties_extension) + one-shot
backfill from property_details.listing_events for pre-trigger history.
Tax reassessment forecast CA · Resets to sale price
- Current annual tax
- $1,430 · $119/mo
- Projected year-2 tax
- $2,242 · $187/mo
- Expected delta
- +$812/yr (+$68/mo · 56.8%)
ⓘ Screening estimate from a state-policy table — verify with the county assessor before closing.
Climate risk First Street
- Flood 1/10 Low FEMA zone X (unshaded) · 0% chance over 30 yrs
- Wildfire 8/10 Severe
- Heat 4/10 Moderate 7 d/yr ≥93°F today · 16 d/yr by 30 yrs out
- Wind 1/10 Low
- Air quality 10/10 Extreme 29 unhealthy d/yr today · 33 by 30 yrs out
Nearby sold comps map
Loading sold comps map…
Walkable amenities ~0.75 mi
Loading nearby amenities…
Taxation est. · year 1
- Rental income
- $28,349
- − Mortgage interest
- −$16,525
- − Property taxes
- −$1,430
- − Insurance
- −$1,475
- − Repairs & maintenance
- −$2,268
- − Management
- −$2,268
- − HOA
- −$468
- − Depreciation
- −$8,582
- Taxable loss
- −$4,666
- Est. tax savings @ 24.0%
- +$1,120
- After-tax cash flow
- $1,578/yr
For passive investors: Depreciation is non-cash, so a rental often shows a tax loss while cash-flowing — sheltering income. Rental losses are passive: they offset passive income freely, and up to $25,000/yr can offset ordinary (W-2) income if you actively participate and your MAGI is under $100k (phasing out to $0 by $150k); unused losses carry forward. On sale, claimed depreciation is recaptured at up to 25%, and gains may owe capital-gains tax (a 1031 exchange can defer both). Figures are a year-1 estimate at your 24.0% rate — not tax advice; consult a CPA.
Schools (NCES district)
- District
- Soulsbyville Elementary
- NCES district ID
- 0637320
- Math proficiency
- 30% ▼ -4.00%
- Reading proficiency
- 38% ▼ -10.00%
- Median HH income
- $60,518
- Composite
- 30.5/100
- National rank
- #6217
- State rank
- #272 of 517 in CA
Livability — Mono Vista
- Score
- 56/100
- State rank
- #793
- US rank
- #22675
Category grades
Schools grade is shown separately in the Schools card above.
Census & demographics
- Census place
- Mono Vista, CA
- Population (ZIP)
- 28,373
Population outlook (Tuolumne County) Hauer SSP2
- Today (2025)
- 50,349 people
- By 2030
- 48,708 · -3.3%
- By 2040
- 45,284 · -10.1%
- By 2050
- 42,575 · -15.4%
- By 2075
- 36,827 · -26.9%
- By 2100
- 30,369 · -39.7%
Race, ethnicity, and origin ACS 2023
- Neighborhood character
- Predominantly White (82%)
- Race & ethnicity
- White 82% Hispanic / Latino 11% Two or more races 9% Asian 1% Native American 1%
- Hispanic origin (detail)
- Mexican 7% Puerto Rican 1%
- Common ancestry
- Italian 5% Russian 4% Slovak 3%
- Foreign-born
- 5% · Canada
- Languages at home
- 95% English-only · Spanish 3%
Political lean MEDSL · Tuolumne
- 2024 margin
- Strong R (+21.9) · D 37.9% · R 59.7% · Other 2.4%
- 2008→2024 swing
- -9.2pp toward R · 2008: -12.7pp · 2024: -21.9pp
- All cycles
- 2024: R+21.9 2020: R+18.8 2016: R+20.9 2012: R+15.9 2008: R+12.7
Not yet ingested
- Civics
- —
Market trends
- HPI YoY
- ▼ -322.67%
- Current HPI
- 130.9637
- Rent YoY
- —
- Metro
- —
- State GDP YoY
- ▲ 3.21%
- F500 in state
- 116
Industry mix (Fortune 500 HQ in CA)
| Industry | F500 HQs | Revenue |
|---|---|---|
| Technology | 27 | $1,492B |
|
||
| Financial Services | 3 | $174B |
|
||
| Retail | 3 | $44B |
|
||
| Insurance | 3 | $26B |
|
||
| Media / Entertainment | 2 | $115B |
|
||
| Pharmaceuticals / Biotech | 2 | $62B |
|
||
Price history
+255.4% since first listed5 events — show timeline
- 2026-05-15 Pending — bridgeMLS, Bay East AOR, or Contra Costa AOR
- 2026-05-02 Relisted — bridgeMLS, Bay East AOR, or Contra Costa AOR
- 2026-04-25 Pending — bridgeMLS, Bay East AOR, or Contra Costa AOR
- 2026-04-24 Listed $295,000 bridgeMLS, Bay East AOR, or Contra Costa AOR
- 1999-04-23 Sold (Public Records) $83,000 Public Records
Property tax history
+1.4%/yrLatest (2025): $1,430 · +1.8% YoY. Source: county tax records.
Cash-flow waterfall
monthlySold comps — $/sqft
last 12 mo · ≤1 miLoading sold comps…