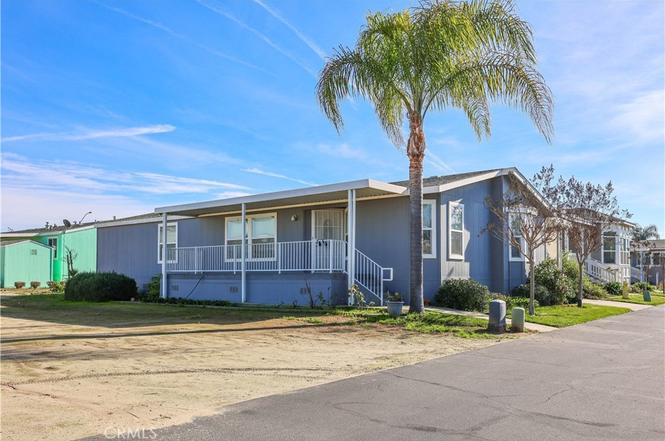
1528 Duke · Livingston, CA
Flood risk 1/10 · Minimal
- FEMA flood zone
- X (unshaded)
- Chance of flooding over 30 yrs
- 0.0%
- Est. flood insurance / yr
- $507 – $1,088
Fire risk 7/10 · Major
- Est. fire insurance / yr
- $659 – $1,223
Heat risk 7/10 · Major
- Hot days now (above 103°F)
- 8 days/yr
- Hot days in 30 yrs
- 19 days/yr
Wind risk 1/10 · Minimal
- Chance of severe wind over 30 yrs
- —
Air-quality risk 10/10 · Severe
- Unhealthy air days now
- 34 days/yr
- Unhealthy air days in 30 yrs
- 35 days/yr
Risk factors via First Street. Map © Google.
Why this score? — see what drove the D+ grade
The composite is a weighted blend of 9 inputs, each scored 0–100. Each bar is that input's sub-score; the figure is the points it added to the 100-point composite (weight × sub-score).
- Cash flow +18.0/30.0
- ARV discount +5.7/15.0
- DSCR +5.6/10.0
- 1% rule +4.8/10.0
- Livability +3.3/5.0
- Schools +2.8/10.0
- Rent growth +2.5/5.0
- Condition / age +2.5/5.0
- Appreciation +0.0/10.0
$159,900
🖨 Deal sheet (PDF) 📄 Offer letter ✓ Due diligence
Listing remarks
Beautiful well-maintained 2007 year built manufactured home in a vibrant 55+ community offering 1620 sq-ft of comfortable living space. This home features 3 bedrooms and 2 full bathrooms, a formal dining room with plenty of windows offers a bright and elegant space for entertaining, and Spacious living room. Kitchen includes ample cabinet storage and boasts a charming island with bar, Cozy breakfast nook, refrigerator and plenty of counter space. Spacious master bath with sunken tub and separate shower stall. Indoor laundry room with sink, washer, electrict dryer, cabinets, side door to carport adds extra convinience. Ceiling fans in all bedrooms and living room. Additional features include
Key facts
- Formal dining room
- 12x8 shed
- Island with bar
Tags
Property features AI
Finance
- Other: Park name: Monte Cristo Adult Community; Accessibility: see remarks; Number of sheds: 1
- Financial info: Land lease of $765 monthly (park provided)
- HOA & community: Senior community (Monte Cristo Adult Community); Community features: Urban; Park manager approval required; Pets allowed with breed restrictions; Rent includes gardener and pool (land lease community)
Exterior
- Parking: Attached carport (2 spaces)
- Security: Carbon monoxide detector(s); Smoke detector
- Utilities: Electricity on property; Natural gas connected; Water connected (district/public); Public sewer; Cable available; Telephone in street
- Home design: Single-story home; Entry on main level; Turnkey condition; Has a view; Mobile home (27' x 60') — model KS60003F; mobile home remains; Lot shape: rectangular
- Construction: Wood construction; Composition/shingle roof; Concrete perimeter foundation; Year built from public records
- Exterior features: Covered patio; Patio; Front porch; Community in-ground pool (fenced); Siding skirt; Shed
Interior
- Kitchen: Kitchen island; Dishwasher; Garbage disposal; Gas range; Microwave; Gas water heater
- Bedrooms: All bedrooms located on main level; Walk-in closet
- Flooring: Carpet; Vinyl
- Bathrooms: 2 full bathrooms; Shower; Shower-in-tub; Soaking tub
- Heating & cooling: Central cooling; Central furnace heating
- Interior features: Ceiling fans; High ceilings (9 feet+); Blinds; Double pane windows; Carbon monoxide detector(s); Smoke detector
- Laundry & utility: Laundry room inside; Gas and electric dryer hookup; Individual laundry room
Neighborhood map
What this means for you Summary
Snapshot
- This is a 3-bed/2.0-bath manufactured listed at $160k.
Deal economics
- At list price, monthly cash flow is $137 ($2k/yr) — positive.
- The deal already cash-flows at list — no discount required.
- To meet the 1% rule (rent ≥ 1% of price), the offer needs to be $157k (1.7% below list).
- Recommended offer: $141k (12.0% below list) — sets the bar for market timing.
- Cap rate 7.3% vs local median 3.0% in Livingston — top-decile yield for the area; either an underpriced asset or a hidden risk that comps aren't pricing in. Stress-test before assuming the spread holds.
Location & tenants
- Location reads 66/100 on livability (#359 in CA) — a middle-class / working-renter tenant base. Strengths: housing A+, health & safety A+; Watch: employment C-, commute F, cost of living F.
- Merced Union High (urban): math 20% / reading 46% proficiency, ranked #301 of 517 in CA (top 58%) — families likely to look elsewhere, expect single-tenant / working-renter base with shorter leases.
- Zoned schools: Selma Herndon Elementary (math 16% / reading 28%, grade F, #1,179 of 1,571 statewide, top 78%, 601 students, 77% FRL); Livingston Middle (math 13% / reading 29%, grade F, #408 of 498 statewide, top 82%, 833 students, 78% FRL); Livingston High (math 20% / reading 43%, grade F, #696 of 1,170 statewide, top 60%, 1,156 students, 83% FRL).
- Market conditions: 46 active listings in the ZIP; 2 comparable units currently listed for rent nearby; 459 units permitted in Merced County in 2024 (0 in 5+ unit buildings).
Forward outlook
- Local home prices are declining (-3.0%/yr); year-one equity from $1k of loan paydown is wiped out by about $5k of value loss. Plan a longer hold.
- Merced County population projected at +12% by 2050 — modest demand growth; plan on rents tracking national, not racing it.
Negotiation context
- It's been on market 156 days — a 12% lower offer ($141k) is reasonable based on typical stale-listing flexibility.
Risks & watch-outs
- Climate carrying-cost: major wildfire risk; extreme-heat days projected 8→19/yr by 2055 (HVAC capex compounding) — expect insurance premiums to compound above CPI over the hold.
Questions for the listing agent
- It's been on market 156 days. Have you received any prior offers? Is the seller open to a 12% concession, seller financing, or rate buy-down credit?
- Why hasn't it sold? Are there any deal-killer items the seller is aware of (foundation, flood, title, zoning, code violations)?
- Is there a deadline driving the sale (1031 exchange, divorce, estate, relocation)? That informs how much negotiation room exists.
- Schools are F-rated, which usually means shorter tenancies and higher turnover. Who's the typical renter profile here, and what's been the actual vacancy rate?
- The area grade is low — what's the realistic commute time and amenity access for the typical tenant pool here? Any planned neighborhood developments (good or bad) we should know about?
- What's the average days-on-market for RENTAL listings here right now (not sales)? A rising rental-DOM trend means longer vacancies and softer asking-rent achievability than the comps imply.
- What's the recent tenant-quality profile in this submarket — average credit score on applications, eviction rate, late-payment / NSF rate, and stable-employment percentage? A property-management company in the area should have these aggregated.
- How much new for-sale + rental construction is in the pipeline within 1–3 miles? Heavy new supply typically softens prices + rents 12–24 months out; constrained supply supports both.
Investment metrics
- 1% rule
- 0.98% ✗
- Cap rate
- 7.32%
- Cash-on-cash
- 3.67%
- DSCR
- 1.16
- GRM
- 8.5
CMA / ARV
- ARV (on-the-fly)
- $153,900
- Comps found
- 7
Show comp detail 7 sales within ~0.75 mi
| Address | Dist | Beds/Ba | Sqft | Sold | Price | $/sf | Match |
|---|---|---|---|---|---|---|---|
| 1557 Monte Cristo Way | 0.03mi | 2/2.0 (-1) | 1,596 (-2%) | 6mo | $160,000 | $100 | 86 |
| 1565 Queen Way | 0.06mi | 3/2.0 | 1,736 (+7%) | 6mo | $165,000 | $95 | 80 |
| 1568 Queen Way | 0.08mi | 3/2.0 | 1,404 (-13%) | 5mo | $137,000 | $98 | 70 |
| 1330 Queen Way #27 | 0.13mi | 2/2.0 (-1) | 1,782 (+10%) | 7mo | $144,000 | $81 | 67 |
| 1470 Queen Way #17 | 0.09mi | 2/2.0 (-1) | 1,782 (+10%) | 11mo | $165,000 | $93 | 65 |
| 825 Knights Ct | 0.16mi | 3/2.0 | 1,808 (+12%) | 11mo | $170,000 | $94 | 64 |
| 824 Count Dr #1 | 0.06mi | 2/2.0 (-1) | 1,793 (+11%) | 14mo | $184,000 | $103 | 62 |
Match score weights: distance 35% · size 25% · config 20% · recency 20%. Top-matched comps best support the ARV.
Projected returns pro-forma
-3.0% appreciation · 3.0% rent growth · sell at horizon
- IRR
- -10.5%
- Equity multiple
- 0.62×
- Total profit
- $-17,162
- Equity at exit
- $23,842
- IRR
- -1.2%
- Equity multiple
- 0.92×
- Total profit
- $-3,613
- Equity at exit
- $13,825
Cash invested: $44,772 (down + closing). Projections, not guarantees.
Landlord ↔ Tenant lean methodology
- Overall (STATE)
- 18 Strongly Tenant-Friendly
- State California
- 18 Strongly Tenant-Friendly · D+13
- County
- — inherits STATE
- City
- — inherits STATE
ZIP-level market 95334
- Active inventory
- 46
- Price-to-rent
- 8.5×
Monthly cashflow live
- Estimated rent
- $1,572 medium interval (Pro) →
- Mortgage (P&I)
- −$839
- Tax est. 1.5%
- −$200 /mo · $2,398/yr
- Insurance
- −$67
- HOA
- −$0
- Lot rent leased land?
- −$0
- Vacancy / Maint / Mgmt
- −$330
- Net cashflow
- $137
Break-even live
Sensitivity live
| Price | -10% $247 | -5% $192 | +0% $137 | +5% $82 | +10% $26 |
|---|---|---|---|---|---|
| Rent | -10% $13 | -5% $75 | +0% $137 | +5% $199 | +10% $261 |
| Rate | -1.0pp $218 | -0.5pp $178 | base $137 | +0.5pp $96 | +1.0pp $53 |
UW: 25.0% down · 7.5% · 30yr · 1.5% tax · 5.0% vac · 8.0% maint · 8.0% mgmt
Financing live
Cash to close
- Down payment
- $39,975
- Closing costs
- $4,797
- Reserves months
- —
- Total cash needed
- —
Loan-product check · same deal, 3 products live
Conventional
25% down · 7.5% · 30yr
- Down + closing
- —
- Monthly P&I
- —
- Monthly cashflow
- —
- DSCR
- —
- Eligible?
- —
Personal DTI + credit; lowest rate.
DSCR
20% down · 8.5% · 30yr
- Down + closing
- —
- Monthly P&I
- —
- Monthly cashflow
- —
- DSCR
- —
- Eligible?
- —
No personal income docs; deal must DSCR.
Hard money
10% down · 12.0% · 12mo
- Down + closing
- —
- Monthly P&I
- —
- Monthly cashflow
- —
- DSCR
- —
- Eligible?
- —
Short-term bridge; refi at stabilization.
Rent comps 2 comps
| Address | Beds | Baths | Sqft | Rent | $/sqft | DOM | Units | Dist |
|---|---|---|---|---|---|---|---|---|
| 336 1st St Livingston, CA | 4.0 | 2.0 | 1400 | $2,000 | $1.43 | 46d | 1 | 0.86mi |
| 505 East Ave Livingston, CA | 4.0 | 2.0 | 1856 | $2,100 | $1.13 | 16d | 1 | 1.20mi |
Listing history 17 events
-
2026-06-22statusdays on market $159,900 Pending Sale 156 DOM
-
2026-06-18days on market $159,900 Active 155 DOM
-
2026-06-17days on market $159,900 Active 154 DOM
-
2026-06-16days on market $159,900 Active 153 DOM
-
2026-06-15days on market $159,900 Active 152 DOM
-
2026-06-14days on market $159,900 Active 150 DOM
-
2026-06-13days on market $159,900 Active 149 DOM
-
2026-06-10days on market $159,900 Active 147 DOM
-
2026-06-09days on market $159,900 Active 146 DOM
-
2026-06-08days on market $159,900 Active 145 DOM
-
2026-06-07days on market $159,900 Active 144 DOM
-
2026-06-03days on market $159,900 Active 140 DOM
-
2026-06-02days on market $159,900 Active 139 DOM
-
2026-06-01days on market $159,900 Active 138 DOM
-
2026-05-31days on market $159,900 Active 137 DOM
-
2026-05-30days on market $159,900 Active 136 DOM
-
2026-01-14$159,900 Active
ⓘ Source: listings_history table (triggers on properties + properties_extension) + one-shot
backfill from property_details.listing_events for pre-trigger history.
Climate risk First Street
- Flood 1/10 Low FEMA zone X (unshaded) · 0% chance over 30 yrs
- Wildfire 7/10 Severe
- Heat 7/10 Severe 8 d/yr ≥103°F today · 19 d/yr by 30 yrs out
- Wind 1/10 Low
- Air quality 10/10 Extreme 34 unhealthy d/yr today · 35 by 30 yrs out
Nearby sold comps map
Loading sold comps map…
Walkable amenities ~0.75 mi
Loading nearby amenities…
Taxation est. · year 1
- Rental income
- $18,866
- − Mortgage interest
- −$8,957
- − Property taxes
- −$2,398
- − Insurance
- −$800
- − Repairs & maintenance
- −$1,509
- − Management
- −$1,509
- − Depreciation
- −$4,652
- Taxable loss
- −$959
- Est. tax savings @ 24.0%
- +$230
- After-tax cash flow
- $1,874/yr
For passive investors: Depreciation is non-cash, so a rental often shows a tax loss while cash-flowing — sheltering income. Rental losses are passive: they offset passive income freely, and up to $25,000/yr can offset ordinary (W-2) income if you actively participate and your MAGI is under $100k (phasing out to $0 by $150k); unused losses carry forward. On sale, claimed depreciation is recaptured at up to 25%, and gains may owe capital-gains tax (a 1031 exchange can defer both). Figures are a year-1 estimate at your 24.0% rate — not tax advice; consult a CPA.
Schools (NCES district)
- District
- Merced Union High
- NCES district ID
- 0624660
- Math proficiency
- 20% ▲ 3.00%
- Reading proficiency
- 46% ▼ -1.00%
- Median HH income
- $44,977
- Composite
- 28.11/100
- National rank
- #6823
- State rank
- #301 of 517 in CA
Livability — Livingston
- Score
- 66/100
- State rank
- #359
- US rank
- #12317
Category grades
Schools grade is shown separately in the Schools card above.
Census & demographics
- Census place
- Livingston, CA
- Population (ZIP)
- 17,198
Population outlook (Merced County) Hauer SSP2
- Today (2025)
- 285,501 people
- By 2030
- 293,437 · +2.8%
- By 2040
- 308,808 · +8.2%
- By 2050
- 321,011 · +12.4%
- By 2075
- 338,497 · +18.6%
- By 2100
- 330,493 · +15.8%
Race, ethnicity, and origin ACS 2023
- Neighborhood character
- Predominantly Hispanic (70%)
- Race & ethnicity
- Hispanic / Latino 70% Asian 18% White 10% Two or more races 9% Native American 1%
- Hispanic origin (detail)
- Mexican 69%
- Common ancestry
- Russian 2% Lithuanian 1%
- Foreign-born
- 38% · Canada
- Languages at home
- 26% English-only · Spanish 57% Other Indo-European 16% Other Asian/Pacific 1%
Political lean MEDSL · Merced
- 2024 margin
- Toss-up / Even · D 46.5% · R 50.9% · Other 2.6%
- 2008→2024 swing
- -12.7pp toward R · 2008: 8.3pp · 2024: -4.4pp
- All cycles
- 2024: R+4.4 2020: D+10.6 2016: D+7.9 2012: D+5.4 2008: D+8.3
Not yet ingested
- Civics
- —
Market trends
- HPI YoY
- ▼ -237.01%
- Current HPI
- 275.9339
- Rent YoY
- —
- Metro
- —
- State GDP YoY
- ▲ 3.21%
- F500 in state
- 116
Industry mix (Fortune 500 HQ in CA)
| Industry | F500 HQs | Revenue |
|---|---|---|
| Technology | 27 | $1,492B |
|
||
| Financial Services | 3 | $174B |
|
||
| Retail | 3 | $44B |
|
||
| Insurance | 3 | $26B |
|
||
| Media / Entertainment | 2 | $115B |
|
||
| Pharmaceuticals / Biotech | 2 | $62B |
|
||
Price history
1 event — show timeline
- 2026-01-14 Listed $159,900 CRMLS
Cash-flow waterfall
monthlySold comps — $/sqft
last 12 mo · ≤1 miLoading sold comps…