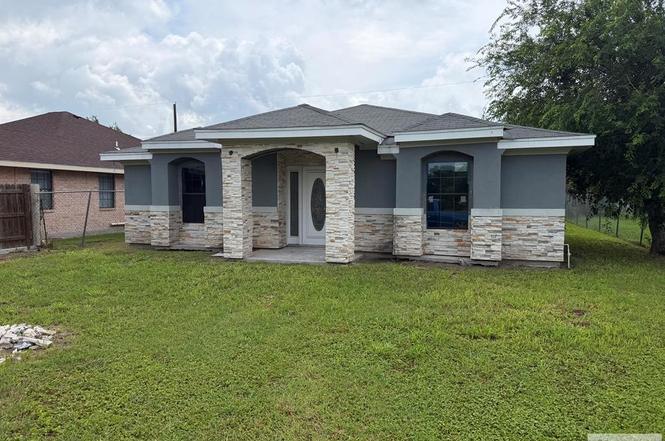
1218 Sunset Dr · Harlingen, TX
Flood risk 6/10 · Moderate
- FEMA flood zone
- X (unshaded)
- Chance of flooding over 30 yrs
- 0.68%
- Est. flood insurance / yr
- $507 – $1,088
Fire risk 1/10 · Minimal
- Est. fire insurance / yr
- $1,222 – $2,270
Heat risk 9/10 · Severe
- Hot days now (above 110°F)
- 7 days/yr
- Hot days in 30 yrs
- 25 days/yr
Wind risk 9/10 · Severe
- Chance of severe wind over 30 yrs
- 99.0%
Air-quality risk 1/10 · Minimal
- Unhealthy air days now
- 0 days/yr
- Unhealthy air days in 30 yrs
- 0 days/yr
Risk factors via First Street. Map © Google.
Why this score? — see what drove the C+ grade
The composite is a weighted blend of 9 inputs, each scored 0–100. Each bar is that input's sub-score; the figure is the points it added to the 100-point composite (weight × sub-score).
- Cash flow +26.9/30.0
- DSCR +9.3/10.0
- 1% rule +8.2/10.0
- ARV discount +7.5/15.0
- Livability +3.7/5.0
- Rent growth +3.4/5.0
- Schools +2.5/10.0
- Condition / age +2.5/5.0
- Appreciation +0.0/10.0
$99,000
🖨 Deal sheet (PDF) 📄 Offer letter ✓ Due diligence
Listing remarks
Investor special. Construction is roughly 80% complete (buyer to verify exact stage). Mandatory Disclosure: Property sustained flood damage in March 2025. Sold strictly AS-IS. Seller will make no repairs, completions, or concessions for remediation. Please have your buyers perform all due diligence regarding remaining construction costs, structural integrity, and flood insurance requirements prior to submitting an offer.
Key facts
- 6,021 sq ft lot
- Built 2025
- Listed 4 days
Property features AI
Finance
- Other: Listing broker: ARNOLD CELIS REALTY, LLC; Listing agent: ARNOLD CELIS (956-238-3379)
- Financial info: Not specified
- HOA & community: Not specified
Exterior
- Parking: Not specified
- Security: Not specified
- Utilities: Public water; Public sewer
- Home design: Single-family residence; House with one story
- Construction: Stucco exterior; Composition roof; Slab foundation; Built on a 0.1382-acre lot
- Exterior features: Located in the Expressway subdivision; Directions: Off expressway toward Lon C Pill Park area, go down main road and turn into Sunset Dr
Interior
- Kitchen: Not specified
- Bedrooms: Not specified
- Flooring: Not specified
- Bathrooms: Two full bathrooms
- Heating & cooling: Not specified
- Interior features: One-story interior layout
- Laundry & utility: Not specified
Neighborhood map
What this means for you Summary
Snapshot
- This is a 3-bed/2.0-bath single-family listed at $99k.
Deal economics
- At list price, monthly cash flow is $275 ($3k/yr) — positive.
- The deal already cash-flows at list — no discount required.
- Meets the 1% rule at list price ($1k rent vs $99k).
- Cap rate 9.6% vs local median 3.8% in Harlingen — top-decile yield for the area; either an underpriced asset or a hidden risk that comps aren't pricing in. Stress-test before assuming the spread holds.
Location & tenants
- Location reads 73/100 on livability (#217 in TX) — a middle-class / working-renter tenant base. Strengths: amenities A+, cost of living A+, housing A+; Watch: crime C-, commute F, employment F.
- Harlingen CISD (urban): math 25% / reading 35% proficiency, ranked #647 of 826 in TX (top 78%) — families likely to look elsewhere, expect single-tenant / working-renter base with shorter leases; 74% free/reduced lunch — lower-income household profile, screen leases tightly.
- Zoned schools: Lamar El (math 17% / reading 22%, grade F, #3,583 of 4,322 statewide, top 86%, 426 students, 92% FRL); Gutierrez Middle (math 26% / reading 31%, grade F, #1,122 of 1,662 statewide, top 69%, 819 students, 71% FRL); Harlingen H S (math 32% / reading 22%, grade F, #1,204 of 1,632 statewide, top 75%, 1,942 students, 82% FRL).
- Market conditions: Rents rising (+3.5%/yr); 465 active listings in the ZIP; 6 comparable units currently listed for rent nearby; rentals lingering (median 44d on market — plan ~5-8 weeks vacancy on turnover, expect pricing pressure); 50% of comp listings sitting > 30 days — soft ceiling on asking rent; 2,326 units permitted in Cameron County in 2024 (503 in 5+ unit buildings).
- This rent runs 32% of the median local income ($49k/yr) — at the standard rent-burdened threshold; future hikes will face affordability resistance.
Forward outlook
- Local home prices are declining (-3.0%/yr); year-one equity from $684 of loan paydown is wiped out by about $3k of value loss. Plan a longer hold.
- Cameron County population projected at +3% by 2050 — modest demand growth; plan on rents tracking national, not racing it.
- At projected returns (-3.0% appreciation + 3.5% rent growth), your $28k cash investment doubles in ~9 years — after that, you're playing with house money.
Negotiation context
- Only 4 days on market — expect competitive offers; lowballing is unlikely to land.
Risks & watch-outs
- Climate carrying-cost: major flood risk; severe wind risk, 99% chance of damaging wind over 30y; extreme-heat days projected 7→25/yr by 2055 (HVAC capex compounding) — expect insurance premiums to compound above CPI over the hold.
Questions for the listing agent
- Is there a deadline driving the sale (1031 exchange, divorce, estate, relocation)? That informs how much negotiation room exists.
- Schools are D-rated, which usually means shorter tenancies and higher turnover. Who's the typical renter profile here, and what's been the actual vacancy rate?
- What's the average days-on-market for RENTAL listings here right now (not sales)? A rising rental-DOM trend means longer vacancies and softer asking-rent achievability than the comps imply.
- What's the recent tenant-quality profile in this submarket — average credit score on applications, eviction rate, late-payment / NSF rate, and stable-employment percentage? A property-management company in the area should have these aggregated.
- How much new for-sale + rental construction is in the pipeline within 1–3 miles? Heavy new supply typically softens prices + rents 12–24 months out; constrained supply supports both.
Investment metrics
- 1% rule
- 1.32% ✓
- Cap rate
- 9.62%
- Cash-on-cash
- 11.90%
- DSCR
- 1.53
- GRM
- 6.3
CMA / ARV
- ARV (on-the-fly)
- $204,360
- Comps found
- 3
Show comp detail 3 sales within ~0.75 mi
| Address | Dist | Beds/Ba | Sqft | Sold | Price | $/sf | Match |
|---|---|---|---|---|---|---|---|
| 530 N P St | 0.47mi | 3/2.0 | 1,492 (-5%) | 6mo | $152,500 | $102 | 65 |
| 2118 Vista Verde Cir W | 0.70mi | 4/2.0 (+1) | 1,344 (-14%) | 21mo | $199,900 | $149 | 20 |
| 1917 W Vista Verde Cir | 0.72mi | 4/2.0 (+1) | 1,344 (-14%) | 21mo | $174,900 | $130 | 20 |
Match score weights: distance 35% · size 25% · config 20% · recency 20%. Top-matched comps best support the ARV.
Projected returns pro-forma
-3.0% appreciation · 3.45% rent growth · sell at horizon
- IRR
- 2.0%
- Equity multiple
- 1.08×
- Total profit
- $2,123
- Equity at exit
- $14,761
- IRR
- 12.1%
- Equity multiple
- 1.98×
- Total profit
- $27,126
- Equity at exit
- $8,560
Cash invested: $27,720 (down + closing). Projections, not guarantees.
Landlord ↔ Tenant lean methodology
- Overall (STATE)
- 87 Strongly Landlord-Friendly
- State Texas
- 87 Strongly Landlord-Friendly · R+5
- County
- — inherits STATE
- City
- — inherits STATE
ZIP-level market 78550
- Rents YoY
- 3.5%
- Active inventory
- 465
- Price-to-rent
- 6.3×
Monthly cashflow live
- Estimated rent
- $1,311 high interval (Pro) →
- Mortgage (P&I)
- −$519
- Tax from tax record
- −$200 /mo · $2,403/yr
- Insurance
- −$41
- HOA
- −$0
- Vacancy / Maint / Mgmt
- −$275
- Net cashflow
- $275
Break-even live
Sensitivity live
| Price | -10% $331 | -5% $303 | +0% $275 | +5% $247 | +10% $219 |
|---|---|---|---|---|---|
| Rent | -10% $171 | -5% $223 | +0% $275 | +5% $327 | +10% $378 |
| Rate | -1.0pp $325 | -0.5pp $300 | base $275 | +0.5pp $249 | +1.0pp $223 |
UW: 25.0% down · 7.5% · 30yr · 1.5% tax · 5.0% vac · 8.0% maint · 8.0% mgmt
Financing live
Cash to close
- Down payment
- $24,750
- Closing costs
- $2,970
- Reserves months
- —
- Total cash needed
- —
Loan-product check · same deal, 3 products live
Conventional
25% down · 7.5% · 30yr
- Down + closing
- —
- Monthly P&I
- —
- Monthly cashflow
- —
- DSCR
- —
- Eligible?
- —
Personal DTI + credit; lowest rate.
DSCR
20% down · 8.5% · 30yr
- Down + closing
- —
- Monthly P&I
- —
- Monthly cashflow
- —
- DSCR
- —
- Eligible?
- —
No personal income docs; deal must DSCR.
Hard money
10% down · 12.0% · 12mo
- Down + closing
- —
- Monthly P&I
- —
- Monthly cashflow
- —
- DSCR
- —
- Eligible?
- —
Short-term bridge; refi at stabilization.
Rent comps 6 comps
| Address | Beds | Baths | Sqft | Rent | $/sqft | DOM | Units | Dist |
|---|---|---|---|---|---|---|---|---|
| 1421 W Madison Ave Unit A Harlingen, TX | 2.0 | 1.0 | 1160 | $925 | $0.80 | 44d | 1 | 0.76mi |
| 1010 W Madison Ave Unit A Harlingen, TX | 4.0 | 2.5 | 1761 | $1,600 | $0.91 | 21d | 1 | 0.92mi |
| 821 W Matz Ave Unit B Harlingen, TX | 3.0 | 2.0 | 1190 | $1,300 | $1.09 | 14d | 1 | 0.99mi |
| 1917 New Combes Hwy Unit H Harlingen, TX | 3.0 | 2.0 | 1098 | $975 | $0.89 | 21d | 1 | 1.14mi |
| 226 W Darrell Wayne Shipp St Harlingen, TX | 3.0 | 2.0 | 1400 | $1,700 | $1.21 | 44d | 1 | 1.40mi |
| 18586 Primera Rd Harlingen, TX | 2.0 | 2.0 | 1100 | $1,095 | $1.00 | 44d | 1 | 1.49mi |
Listing history 5 events
-
2026-06-18days on market $99,000 Active 4 DOM
-
2026-06-17days on market $99,000 Active 3 DOM
-
2026-06-16days on market $99,000 Active 2 DOM
-
2026-06-15remarks 424-char remark
-
2026-06-15$99,000 Active 1 DOM
ⓘ Source: listings_history table (triggers on properties + properties_extension) + one-shot
backfill from property_details.listing_events for pre-trigger history.
Tax reassessment forecast TX · Resets to sale price
- Current annual tax
- $2,403 · $200/mo
- Projected year-2 tax
- $2,403 · $200/mo
- Expected delta
- $0/yr ($0/mo · 0.0%)
ⓘ Screening estimate from a state-policy table — verify with the county assessor before closing.
Climate risk First Street
- Flood 6/10 Major FEMA zone X (unshaded) · 68% chance over 30 yrs
- Wildfire 1/10 Low
- Heat 9/10 Extreme 7 d/yr ≥110°F today · 25 d/yr by 30 yrs out
- Wind 9/10 Extreme 99% chance of damaging wind over 30 yrs
- Air quality 1/10 Low 0 unhealthy d/yr today · 0 by 30 yrs out
Nearby sold comps map
Loading sold comps map…
Walkable amenities ~0.75 mi
Loading nearby amenities…
Taxation est. · year 1
- Rental income
- $15,728
- − Mortgage interest
- −$5,546
- − Property taxes
- −$2,403
- − Insurance
- −$495
- − Repairs & maintenance
- −$1,258
- − Management
- −$1,258
- − Depreciation
- −$2,880
- Taxable income
- $1,889
- Est. tax owed @ 24.0%
- −$453
- After-tax cash flow
- $2,844/yr
For passive investors: Depreciation is non-cash, so a rental often shows a tax loss while cash-flowing — sheltering income. Rental losses are passive: they offset passive income freely, and up to $25,000/yr can offset ordinary (W-2) income if you actively participate and your MAGI is under $100k (phasing out to $0 by $150k); unused losses carry forward. On sale, claimed depreciation is recaptured at up to 25%, and gains may owe capital-gains tax (a 1031 exchange can defer both). Figures are a year-1 estimate at your 24.0% rate — not tax advice; consult a CPA.
Schools (NCES district)
- District
- Harlingen CISD
- NCES district ID
- 4822530
- Math proficiency
- 25% ▼ -28.00%
- Reading proficiency
- 35% ▼ -11.00%
- Median HH income
- $37,182
- Composite
- 24.94/100
- National rank
- #7566
- State rank
- #647 of 826 in TX
Livability — Harlingen
- Score
- 73/100
- State rank
- #217
- US rank
- #5347
Category grades
Schools grade is shown separately in the Schools card above.
Census & demographics
- Census place
- Harlingen, TX
- County
- Cameron County · 310,734 people
- City population
- 95,667
- Metro
- Brownsville-Harlingen, TX
- Population (ZIP)
- 53,335
- Household income
- $49,007
- Rent vs Own
- Severe rent burden
- 2251.0
Population outlook (Cameron County) Hauer SSP2
- Today (2025)
- 441,603 people
- By 2030
- 448,113 · +1.5%
- By 2040
- 456,385 · +3.3%
- By 2050
- 456,294 · +3.3%
- By 2075
- 423,851 · -4.0%
- By 2100
- 342,787 · -22.4%
Race, ethnicity, and origin ACS 2023
- Neighborhood character
- Predominantly Hispanic (83%)
- Race & ethnicity
- Hispanic / Latino 83% Two or more races 29% White 14% Black 1%
- Hispanic origin (detail)
- Mexican 76%
- Common ancestry
- Italian 1% Lithuanian 1%
- Foreign-born
- 14% · Canada
- Languages at home
- 51% English-only · Spanish 48%
Political lean MEDSL · Cameron
- 2024 margin
- Lean R (+5.8) · D 46.7% · R 52.5%
- 2008→2024 swing
- -34.6pp toward R · 2008: 28.8pp · 2024: -5.8pp
- All cycles
- 2024: R+5.8 2020: D+13.2 2016: D+32.5 2012: D+32.4 2008: D+28.8
Not yet ingested
- Civics
- —
Market trends
- HPI YoY
- ▼ -142.60%
- Current HPI
- 167.7038
- Rent YoY
- ▲ 3.45%
- Metro
- Brownsville-Harlingen, TX
- State GDP YoY
- ▲ 3.95%
- F500 in state
- 110
Industry mix (Fortune 500 HQ in TX)
| Industry | F500 HQs | Revenue |
|---|---|---|
| Energy | 16 | $1,198B |
|
||
| Technology | 5 | $198B |
|
||
| Engineering / Construction | 4 | $72B |
|
||
| Energy Services | 3 | $60B |
|
||
| Utilities | 3 | $41B |
|
||
| Healthcare | 2 | $330B |
|
||
Price history
6 events — show timeline
- 2026-06-14 Listed $99,000 RGVMLS
- 2017-07-14 Sold (Public Records) — Public Records
- 2014-07-09 Sold (Public Records) — Public Records
- 2014-05-27 Sold (Public Records) — Public Records
- 1993-04-23 Sold (Public Records) — Public Records
- 1991-10-01 Sold (Public Records) — Public Records
Property tax history
+23.2%/yrLatest (2025): $2,403 · +0.7% YoY. Source: county tax records.
Cash-flow waterfall
monthlySold comps — $/sqft
last 12 mo · ≤1 miLoading sold comps…