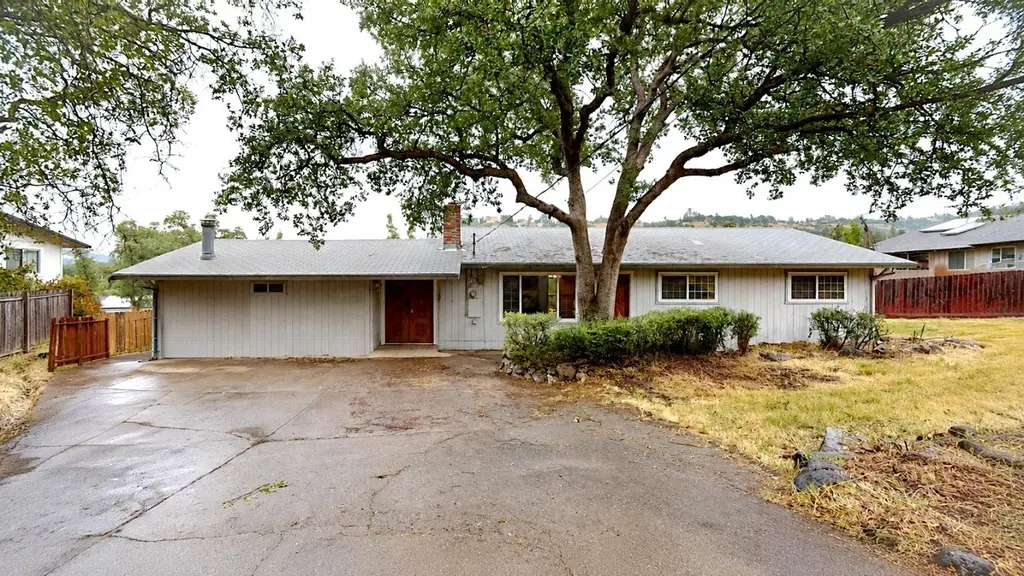
20654 Charlotte Ct · Soulsbyville, CA
Flood risk 1/10 · Minimal
- FEMA flood zone
- X (unshaded)
- Chance of flooding over 30 yrs
- 0.0%
- Est. flood insurance / yr
- $507 – $1,088
Fire risk 8/10 · Major
- Est. fire insurance / yr
- $659 – $1,223
Heat risk 5/10 · Moderate
- Hot days now (above 96°F)
- 7 days/yr
- Hot days in 30 yrs
- 17 days/yr
Wind risk 1/10 · Minimal
- Chance of severe wind over 30 yrs
- —
Air-quality risk 10/10 · Severe
- Unhealthy air days now
- 29 days/yr
- Unhealthy air days in 30 yrs
- 33 days/yr
Risk factors via First Street. Map © Google.
Why this score? — see what drove the B- grade
The composite is a weighted blend of 9 inputs, each scored 0–100. Each bar is that input's sub-score; the figure is the points it added to the 100-point composite (weight × sub-score).
- Cash flow +24.1/30.0
- ARV discount +15.0/15.0
- DSCR +7.8/10.0
- Appreciation +5.2/10.0
- 1% rule +4.9/10.0
- Schools +3.1/10.0
- Livability +2.9/5.0
- Rent growth +2.5/5.0
- Condition / age +2.5/5.0
$239,999
🖨 Deal sheet (PDF) 📄 Offer letter ✓ Due diligence
Listing remarks
Fixer Opportunity in Soulsbyville! Investor special with endless potential at 20654 Charlotte Court. Nestled in a picturesque foothill setting with mature trees and a sense of privacy, this home is ready for a complete transformation. Featuring multiple living areas, two brick fireplaces, original wood accents, a versatile floor plan, and an oversized family room from a garage conversion, this property offers the perfect canvas for investors, flippers, contractors, or buyers looking to build serious sweat equity. Enjoy the peaceful Soulsbyville location with convenient access to Sonora, Twain Harte, Highway 108, outdoor recreation, lakes, shopping, and dining. Bring your vision and unlock t
Key facts
- Peaceful location
- Brick fireplaces
- Versatile floor plan
Tags
Property features AI
Finance
- HOA & community: No homeowners association; Not a senior community
Exterior
- Parking: No garage
- Utilities: Public water; Other electric service; Other sewer service; Other irrigation source
- Home design: Single-family detached residence; Custom design; One story (single level); Built in 1965
- Construction: Composition roof; Fixer condition
- Exterior features: Back yard fencing; Storage structure on the property; Located on a court
Interior
- Kitchen: Free standing gas range; Free standing refrigerator; Synthetic countertops
- Bedrooms: 3 bedrooms (all on the main level)
- Flooring: Carpet; Vinyl
- Bathrooms: 2 full bathrooms; Tubs with shower over and windows in bathrooms
- Heating & cooling: Fireplace heating; Wall-mounted cooling units
- Interior features: Two fireplaces with brick, wood-burning and wood stove features; Covered patio; Living room; Family room; Dining area open to the kitchen; Synthetic kitchen counters
- Laundry & utility: Laundry area inside the home
Neighborhood map
What this means for you Summary
Snapshot
- This is a 3-bed/1.0-bath single-family listed at $240k.
Deal economics
- At list price, monthly cash flow is $476 ($6k/yr) — positive.
- The deal already cash-flows at list — no discount required.
- To meet the 1% rule (rent ≥ 1% of price), the offer needs to be $239k (0.6% below list).
- Recommended offer: $239k (0.6% below list) — sets the bar for 1% rule.
Location & tenants
- Location reads 57/100 on livability (#731 in CA) — a working-class tenant base; expect higher turnover. Strengths: housing A+, crime B+, employment B+; Watch: amenities F, commute F, cost of living F.
- Soulsbyville Elementary (town): math 30% / reading 38% proficiency, ranked #272 of 517 in CA (top 53%) — families likely to look elsewhere, expect single-tenant / working-renter base with shorter leases.
- Market conditions: 14 active listings in the ZIP; 2 comparable units currently listed for rent nearby; 60 units permitted in Tuolumne County in 2024 (0 in 5+ unit buildings).
Forward outlook
- In year one you build about $3k of equity ($2k loan paydown + $1k appreciation (0.5% local appreciation)).
- Tuolumne County population projected at -15% by 2050 — secular population decline; favor cash flow + early exit over multi-decade hold.
- At projected returns (0.5% appreciation + 3.0% rent growth), your $67k cash investment doubles in ~7 years — after that, you're playing with house money.
- By year 10, paydown + projected appreciation supports a ~$33k cash-out refi (75% LTV) — recoverable capital for the next deal without selling this one.
Negotiation context
- Only 5 days on market — expect competitive offers; lowballing is unlikely to land.
Risks & watch-outs
- Climate carrying-cost: severe wildfire risk; extreme-heat days projected 7→17/yr by 2055 (HVAC capex compounding) — expect insurance premiums to compound above CPI over the hold.
Questions for the listing agent
- Built in 1965 — when were the roof, HVAC, electrical panel, plumbing, and water heater last replaced?
- Is there a deadline driving the sale (1031 exchange, divorce, estate, relocation)? That informs how much negotiation room exists.
- What's the average days-on-market for RENTAL listings here right now (not sales)? A rising rental-DOM trend means longer vacancies and softer asking-rent achievability than the comps imply.
- What's the recent tenant-quality profile in this submarket — average credit score on applications, eviction rate, late-payment / NSF rate, and stable-employment percentage? A property-management company in the area should have these aggregated.
- How much new for-sale + rental construction is in the pipeline within 1–3 miles? Heavy new supply typically softens prices + rents 12–24 months out; constrained supply supports both.
Investment metrics
- 1% rule
- 0.99% ✗
- Cap rate
- 8.67%
- Cash-on-cash
- 8.50%
- DSCR
- 1.38
- GRM
- 8.4
CMA / ARV
- ARV (on-the-fly)
- $337,480
- Comps found
- 9
Show comp detail 9 sales within ~0.75 mi
| Address | Dist | Beds/Ba | Sqft | Sold | Price | $/sf | Match |
|---|---|---|---|---|---|---|---|
| 20568 Charlotte Ct | 0.15mi | 3/2.0 | 1,148 (+0%) | 4mo | $305,000 | $266 | 85 |
| 20569 Charlotte Ct | 0.13mi | 3/2.0 | 1,152 (+1%) | 6mo | $379,000 | $329 | 84 |
| 17270 Kelleher Ct | 0.43mi | 3/1.5 | 1,162 (+2%) | 4mo | $275,000 | $237 | 72 |
| 20575 Willow Spgs | 0.26mi | 3/2.0 | 1,152 (+1%) | 22mo | $340,000 | $295 | 64 |
| 20660 Willow Springs Dr | 0.08mi | 2/1.0 (-1) | 1,030 (-10%) | 13mo | $325,000 | $316 | 64 |
| 20508 Tracy Ct | 0.40mi | 2/1.5 (-1) | 1,132 (-1%) | 11mo | $312,375 | $276 | 63 |
| 20713 W Willow Springs Dr | 0.13mi | 2/1.0 (-1) | 1,052 (-8%) | 15mo | $370,000 | $352 | 63 |
| 20805 Keith | 0.20mi | 3/2.0 | 1,053 (-8%) | 17mo | $319,000 | $303 | 59 |
| 17096 S Mono Vista Rd | 0.67mi | 2/1.5 (-1) | 1,024 (-10%) | 6mo | $215,000 | $210 | 39 |
Match score weights: distance 35% · size 25% · config 20% · recency 20%. Top-matched comps best support the ARV.
Projected returns pro-forma
0.49% appreciation · 3.0% rent growth · sell at horizon
- IRR
- 8.7%
- Equity multiple
- 1.43×
- Total profit
- $28,800
- Equity at exit
- $75,685
- IRR
- 13.1%
- Equity multiple
- 2.51×
- Total profit
- $101,612
- Equity at exit
- $95,912
Cash invested: $67,200 (down + closing). Projections, not guarantees.
Landlord ↔ Tenant lean methodology
- Overall (STATE)
- 18 Strongly Tenant-Friendly
- State California
- 18 Strongly Tenant-Friendly · D+13
- County
- — inherits STATE
- City
- — inherits STATE
ZIP-level market 95372
- Home prices YoY
- 0.5%
- Active inventory
- 14
- Price-to-rent
- 8.4×
Monthly cashflow live
- Estimated rent
- $2,387 medium interval (Pro) →
- Mortgage (P&I)
- −$1,259
- Tax from tax record
- −$51 /mo · $614/yr
- Insurance
- −$100
- HOA
- −$0
- Vacancy / Maint / Mgmt
- −$501
- Net cashflow
- $476
Break-even live
Sensitivity live
| Price | -10% $612 | -5% $544 | +0% $476 | +5% $408 | +10% $340 |
|---|---|---|---|---|---|
| Rent | -10% $287 | -5% $381 | +0% $476 | +5% $570 | +10% $664 |
| Rate | -1.0pp $597 | -0.5pp $537 | base $476 | +0.5pp $414 | +1.0pp $350 |
UW: 25.0% down · 7.5% · 30yr · 1.5% tax · 5.0% vac · 8.0% maint · 8.0% mgmt
Financing live
Cash to close
- Down payment
- $60,000
- Closing costs
- $7,200
- Reserves months
- —
- Total cash needed
- —
Loan-product check · same deal, 3 products live
Conventional
25% down · 7.5% · 30yr
- Down + closing
- —
- Monthly P&I
- —
- Monthly cashflow
- —
- DSCR
- —
- Eligible?
- —
Personal DTI + credit; lowest rate.
DSCR
20% down · 8.5% · 30yr
- Down + closing
- —
- Monthly P&I
- —
- Monthly cashflow
- —
- DSCR
- —
- Eligible?
- —
No personal income docs; deal must DSCR.
Hard money
10% down · 12.0% · 12mo
- Down + closing
- —
- Monthly P&I
- —
- Monthly cashflow
- —
- DSCR
- —
- Eligible?
- —
Short-term bridge; refi at stabilization.
Rent comps 2 comps
| Address | Beds | Baths | Sqft | Rent | $/sqft | DOM | Units | Dist |
|---|---|---|---|---|---|---|---|---|
| 20381 Sherry Ct Unit A Soulsbyville, CA | 3.0 | 2.0 | 1467 | $2,195 | $1.50 | 24d | 1 | 0.41mi |
| 21593 Crystal Falls Dr Sonora, CA | 3.0 | 2.0 | 1250 | $2,950 | $2.36 | 24d | 1 | 1.41mi |
Listing history 4 events
-
2026-06-03statusdays on market $239,999 Pending 5 DOM
-
2026-06-02days on market $239,999 Active 4 DOM
-
2026-06-01days on market $239,999 Active 3 DOM
-
2026-05-31days on market $239,999 Active 2 DOM
ⓘ Source: listings_history table (triggers on properties + properties_extension) + one-shot
backfill from property_details.listing_events for pre-trigger history.
Tax reassessment forecast CA · Resets to sale price
- Current annual tax
- $614 · $51/mo
- Projected year-2 tax
- $1,824 · $152/mo
- Expected delta
- +$1,210/yr (+$101/mo · 196.9%)
ⓘ Screening estimate from a state-policy table — verify with the county assessor before closing.
Climate risk First Street
- Flood 1/10 Low FEMA zone X (unshaded) · 0% chance over 30 yrs
- Wildfire 8/10 Severe
- Heat 5/10 Major 7 d/yr ≥96°F today · 17 d/yr by 30 yrs out
- Wind 1/10 Low
- Air quality 10/10 Extreme 29 unhealthy d/yr today · 33 by 30 yrs out
Nearby sold comps map
Loading sold comps map…
Walkable amenities ~0.75 mi
Loading nearby amenities…
Taxation est. · year 1
- Rental income
- $28,641
- − Mortgage interest
- −$13,444
- − Property taxes
- −$614
- − Insurance
- −$1,200
- − Repairs & maintenance
- −$2,291
- − Management
- −$2,291
- − Depreciation
- −$6,982
- Taxable income
- $1,819
- Est. tax owed @ 24.0%
- −$436
- After-tax cash flow
- $5,273/yr
For passive investors: Depreciation is non-cash, so a rental often shows a tax loss while cash-flowing — sheltering income. Rental losses are passive: they offset passive income freely, and up to $25,000/yr can offset ordinary (W-2) income if you actively participate and your MAGI is under $100k (phasing out to $0 by $150k); unused losses carry forward. On sale, claimed depreciation is recaptured at up to 25%, and gains may owe capital-gains tax (a 1031 exchange can defer both). Figures are a year-1 estimate at your 24.0% rate — not tax advice; consult a CPA.
Schools (NCES district)
- District
- Soulsbyville Elementary
- NCES district ID
- 0637320
- Math proficiency
- 30% ▼ -4.00%
- Reading proficiency
- 38% ▼ -10.00%
- Median HH income
- $60,518
- Composite
- 30.5/100
- National rank
- #6217
- State rank
- #272 of 517 in CA
Livability — Soulsbyville
- Score
- 57/100
- State rank
- #731
- US rank
- #21555
Category grades
Schools grade is shown separately in the Schools card above.
Census & demographics
- Census place
- Soulsbyville, CA
- City population
- 1,825
- Population (ZIP)
- 1,825
Population outlook (Tuolumne County) Hauer SSP2
- Today (2025)
- 50,349 people
- By 2030
- 48,708 · -3.3%
- By 2040
- 45,284 · -10.1%
- By 2050
- 42,575 · -15.4%
- By 2075
- 36,827 · -26.9%
- By 2100
- 30,369 · -39.7%
Race, ethnicity, and origin ACS 2023
- Neighborhood character
- Predominantly White (80%)
- Race & ethnicity
- White 80% Hispanic / Latino 15% Two or more races 13%
- Hispanic origin (detail)
- Mexican 8%
- Common ancestry
- Lithuanian 15% Russian 4% Scotch-Irish 2%
- Foreign-born
- 3% · Canada
Political lean MEDSL · Tuolumne
- 2024 margin
- Strong R (+21.9) · D 37.9% · R 59.7% · Other 2.4%
- 2008→2024 swing
- -9.2pp toward R · 2008: -12.7pp · 2024: -21.9pp
- All cycles
- 2024: R+21.9 2020: R+18.8 2016: R+20.9 2012: R+15.9 2008: R+12.7
Not yet ingested
- Civics
- —
Market trends
- HPI YoY
- ▲ 0.49%
- Current HPI
- 101.5849
- Rent YoY
- —
- Metro
- —
- State GDP YoY
- ▲ 3.21%
- F500 in state
- 116
Industry mix (Fortune 500 HQ in CA)
| Industry | F500 HQs | Revenue |
|---|---|---|
| Technology | 27 | $1,492B |
|
||
| Financial Services | 3 | $174B |
|
||
| Retail | 3 | $44B |
|
||
| Insurance | 3 | $26B |
|
||
| Media / Entertainment | 2 | $115B |
|
||
| Pharmaceuticals / Biotech | 2 | $62B |
|
||
Property tax history
+0.9%/yrLatest (2025): $614 · +1.9% YoY. Source: county tax records.
Cash-flow waterfall
monthlySold comps — $/sqft
last 12 mo · ≤1 miLoading sold comps…